. 2019 Jul;15(7):1199-1213.
doi: 10.1080/15548627.2019.1580096. Epub 2019 Mar 1.

BAG3 and SYNPO (synaptopodin) facilitate phospho-MAPT/Tau degradation via autophagy in neuronal processes

Affiliations

BAG3 and SYNPO (synaptopodin) facilitate phospho-MAPT/Tau degradation via autophagy in neuronal processes

Changyi Ji et al. Autophagy. 2019 Jul.

Abstract

A major cellular catabolic pathway in neurons is macroautophagy/autophagy, through which misfolded or aggregation-prone proteins are sequestered into autophagosomes that fuse with lysosomes, and are degraded. MAPT (microtubule-associated protein tau) is one of the protein clients of autophagy. Given that accumulation of hyperphosphorylated MAPT contributes to the pathogenesis of Alzheimer disease and other tauopathies, decreasing endogenous MAPT levels has been shown to be beneficial to neuronal health in models of these diseases. A previous study demonstrated that the HSPA/HSP70 co-chaperone BAG3 (BCL2-associated athanogene 3) facilitates endogenous MAPT clearance through autophagy. These findings prompted us to further investigate the mechanisms underlying BAG3-mediated autophagy in the degradation of endogenous MAPT. Here we demonstrate for the first time that BAG3 plays an important role in autophagic flux in the neurites of mature neurons (20-24 days in vitro [DIV]) through interaction with the post-synaptic cytoskeleton protein SYNPO (synaptopodin). Loss of either BAG3 or SYNPO impeded the fusion of autophagosomes and lysosomes predominantly in the post-synaptic compartment. A block of autophagy leads to accumulation of the autophagic receptor protein SQSTM1/p62 (sequestosome 1) as well as MAPT phosphorylated at Ser262 (p-Ser262). Furthermore, p-Ser262 appears to accumulate in autophagosomes at post-synaptic densities. Overall these data provide evidence of a novel role for the co-chaperone BAG3 in synapses. In cooperation with SYNPO, it functions as part of a surveillance complex that facilitates the autophagic clearance of MAPT p-Ser262, and possibly other MAPT species at the post-synapse. This appears to be crucial for the maintenance of a healthy, functional synapse.Abbreviations: aa: amino acids; ACTB: actin beta; BafA1: bafilomycin A1; BAG3: BCL2 associated athanogene 3; CQ chloroquine; CTSL: cathepsin L; DIV: days in vitro; DLG4/PSD95: discs large MAGUK scaffold protein 4; HSPA/HSP70: heat shock protein family A (Hsp70); MAP1LC3B/LC3B: microtubule associated protein 1 light chain 3 beta; MAP2: microtubule associated protein 2; MAPT: microtubule associated protein tau; p-Ser262: MAPT phosphorylated at serine 262; p-Ser396/404: MAPT phosphorylated at serines 396 and 404; p-Thr231: MAPT phosphorylated at threonine 231; PBS: phosphate buffered saline; PK: proteinase K; scr: scrambled; shRNA: short hairpin RNA; SQSTM1/p62 sequestosome 1; SYN1: synapsin I; SYNPO synaptopodin; SYNPO2/myopodin: synaptopodin 2; VPS: vacuolar protein sorting.

Keywords: Autophagosome; PPxY domain; SQSTM1/p62; WW domain; postsynaptic density; synapse.


Figures

Figure 1.
Figure 1.
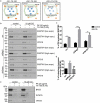
The BAG3 WW domain and SYNPO PPxY motifs are required for their interaction. (a) BAG3 is a multi-domain protein, which contains a WW domain at its amino-terminus for binding PPxY motifs in partner proteins. In a previously performed peptide array screen for BAG3 WW domain interacting proteins of the human proteome [18], 12-mer peptides of SYNPO2 (aa 615–626) and SYNPO (aa 333–344), respectively, were strongly recognized by the WW domain of the co-chaperone BAG3. (b) HeLa cells were transiently transfected with empty plasmid or plasmid constructs for the expression of FLAG-tagged SYNPO or mutant forms with inactivating mutations in the PPxY motifs, as indicated followed by immunoprecipitation with an anti-FLAG antibody (IP). Isolated immune complexes were probed for the presence of endogenous BAG3. Input samples correspond to 32 µg of protein. (c) Similar to the experimental approach described under (b), BAG3 complexes were isolated from HeLa cells expressing a wild-type form of the BAG3 co-chaperone or a form with an inactivated WW domain (BAG3-WAWA). Isolated complexes were analyzed for the presence of endogenous SYNPO.
Figure 2.
Figure 2.
BAG3 interacts with SYNPO in mature neurons. (a) Immunoprecipitation of endogenous BAG3 from mature rat cortical neuronal lysates. SYNPO was detected in the isolated bound fractions. (b) Immunoprecipitation of endogenous SYNPO from mature rat cortical neurons. Both BAG3 and SQSTM1 were detected in the precipitated fraction. (c) Co-immunoprecipitation of SQSTM1 and SYNPO is independent of BAG3 in mature rat neurons.
Figure 3.
Figure 3.
Colocalization of SYNPO with BAG3, SQSTM1 and HSPA/HSP70. Cortical neurons were immunostained for SYNPO and BAG3, SQSTM1, or HSPA/HSP70. Immunofluorescence of SYNPO overlaps with BAG3, SQSTM1 or HSPA/HSP70 in neuronal processes (a) and soma (b). Corresponding line scans are shown on the right; arrowheads indicate the areas of overlapping of intensity. Quantification of colocalization using Pearson’s correlation coefficient (c) and object-based analysis (d). In each condition, 10–30 neurons from 3 independent experiments were used for quantification. Data were plotted as mean ± SEM. As MAP2 appears in a continuous localization within neuronal dendrites and barely overlaps with SYNPO (see also Figure S1), the colocalization between SYNPO and BAG3, SQSTM1 and HSPA/HSP70, respectively, was compared to SYNPO and MAP2 using one-way ANOVA followed by Dunnett’s multiple.
Figure 4.
Figure 4.
Colocalization of BAG3, SYNPO or SQSTM1 with endogenous MAP1LC3B/LC3B in neuronal processes. (a) Neurons were co-immunostained for LC3B and BAG3, SYNPO or SQSTM1, respectively. Overlap of BAG3, SYNPO or SQSTM1 with LC3B puncta was observed in neuronal processes. SYN1 was used as a negative control. The corresponding line scans are shown at right. Arrowheads denote areas of overlap. Scale bar: 10 μm; scale bar in the high magnification inserts: 2 μm. (b) Quantification of colocalization using Pearson’s correlation coefficient. (c) Quantification of colocalization using object based analysis. In each condition, 12–20 neurons from 3 independent experiments were used for quantification. Graphs were plotted as mean ± SEM. Colocalization between LC3B and SYNPO, BAG3 and SQSTM1, respectively, was compared to LC3B and SYN1 using one-way ANOVA followed by Dunnett’s multiple comparisons test. ****, p < 0.0001; *, p < 0.05.
Figure 5.
Figure 5.
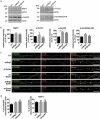
Loss of BAG3 or SYNPO reduces LC3B-II and SQSTM1 turnover. (a) LC3B-I/II levels in primary cortical neurons transduced with lentivirus expressing shBag3 or a scrambled (scr) version. Neurons were treated with or without 10 μM chloroquine (CQ) for 16 h. Vertical lines indicate that intervening lanes were removed, however all images were from the same blot and exposure. (b) LC3B blots of neurons transduced with lentivirus expressing shRNA for rat Synpo or a scrambled (scr) version. Neurons were treated as (a). (c) Quantifications of LC3B-II in BAG3 and SYNPO knockdown neurons in the absence or presence of CQ treatment. LC3B-II was normalized to the loading control ACTB then compared to the scrambled condition. Graph shows mean ± SEM of 4–6 samples from 3 independent experiments. Statistical analysis was performed using one-way ANOVA with Tukey’s post hoc test. *, p < 0.05; **, p < 0.01; ***, p < 0.001, ns, no significance. (d) Immunoblotting of SQSTM1, BAG3 and SYNPO in BAG3 or SYNPO knockdown neurons. GAPDH was used as loading control. (e) Quantification of SQSTM1 levels. Graph shows mean ± SEM from 3 independent experiments. Statistical analysis was performed using one-way ANOVA with Tukey’s post hoc test. ***, p < 0.001; ns, no significance. Scale bar: 10 μm. a.u., arbitrary units.
Figure 6.
Figure 6.
BAG3 or SYNPO knockdown blocks the autophagic flux of autophagy in neuronal processes. Representative maximal-projections of confocal z-stack images of neuronal soma (a) and processes (b). Neurons treated with 100 nM bafilomycin A1 (BafA1) for 4 h were used as positive controls. Scale bar: 10 μm. (c) Quantification of autophagosomes (green) and autolysosomes (red only) under the conditions of (a) and (b). The total number of green particles (autophagosomes) and red particles (autophagosomes plus autolysosomes) were counted as described in Materials and Methods. Red only particles (autolysosomes) were determined by subtracting the number of green particles from the respective number of red particles. Data were obtained from 20–30 neurons of 3 independent experiments. One to three processes from each neuron were chosen for analysis. Data are shown as mean ± SEM. Statistical analysis was performed using two-way ANOVA with Dunnett’s post hoc test. *, p < 0.05; ****, p < 0.0001; ns, no significance. (d) Colocalization of GFP-LC3B and LAMP1-RFP in neurons transduced with scramble, shBag3 or shSynpo lentivirus. Neurons were co-transfected with GFP-LC3B and LAMP1-RFP for 48 h before fixing. Representative images are shown with corresponding line scans below (e). Overlap between GFP-LC3B and LAMP1-RFP decreases in either SYNPO or BAG3 knockdown neurons compared to scramble controls. Scale bar: 10 μm. (f) Quantification of the colocalization between GFP-LC3B and LAMP1-RFP. In each condition, data were obtained from 15–24 neurons of 2 independent experiments. 1–3 processes from each neuron were chosen for analysis. Data are shown as mean ± SEM. Statistical analysis was performed using one-way ANOVA with Dunnett’s post hoc test. *, p < 0.05.
Figure 7.
Figure 7.
Loss of BAG3 or SYNPO does not affect the initiation or maturation of autophagosomes. (a) Schematic representation of proteinase K (PK) protection assay. This panel was adapted and reproduced from [46]. (b) Autophagic cargo receptor SQSTM1 was protected from PK digestion unless the detergent Triton X-100 (TX-100) was present. Lysates from scramble (scr), BAG3 or SYNPO knockdown neurons treated with or without 10 μM chloroquine (CQ) were subjected to PK protection assays. VPS18 was used as a cytosolic control. (c) Quantification of the amount of PK protected SQSTM1 in each condition. Percentage of PK protected SQSTM1 was the ratio of SQSTM1 in the presence PK but in the absence of TX-100 relative to its untreated control in a given condition. Data are shown as mean ± SEM. Statistical analysis was performed using two-way ANOVA with Tukey’s post hoc test. **, p < 0.01; ****, p < 0.0001. (d) Autophagosome and/or lysosome-protected SQSTM1. The difference in the amount of PK-protected SQSTM1 between chloroquine treated samples and untreated samples represent autophagosome and/or lysosome-protected SQSTM1. Data are shown as mean ± SEM. Statistical analysis was performed using one-way ANOVA with Tukey’s post hoc test. *, p < 0.05; ns, no significance. (e) BAG3 and SYNPO were sensitive to PK digestion. Chloroquine treatment did not increase the amount of either BAG3 or SYNPO that were PK protected.
Figure 8.
Figure 8.
MAPT phosphorylated at Ser262 increased in neuronal processes when BAG3 or SYNPO was knocked down in mature neurons. (a) Representative blots of MAPT and phosphorylated MAPT (p-Thr231, p-Ser262 and p-Ser396/Ser404) in neurons transduced with scramble (scr), shBag3 or shSynpo lentivirus. (b) Quantitation of the levels of MAPT or phosphorylated MAPT in BAG3 or SYNPO knockdown neurons from 3 independent experiments. Data were normalized to the loading control ACTB and then compared to scramble controls. Data are shown as mean ± SEM. Statistical analysis was performed using one-way ANOVA with Dunnett’s post hoc test. *, p < 0.05. (c) Endogenous p-Ser262 colocalized with LC3 puncta in neuronal process in BAG3 or SYNPO knockdown neurons. Neurons were treated with DMSO or 100 nM bafilomycin A1 (BafA1) for 4 h before processing, then immunostained with anti-phosphorylated MAPT Ser262 (12E8) and LC3B antibody. Scale bar: 10 μm. Arrowheads denote the overlapping of fluorescence. (d) Quantification of the colocalization between phosphorylated MAPT Ser262 and LC3B. In each condition, data were obtained from 13–17 neurons of 2 independent experiments. Data are shown as mean ± SEM. Statistical analysis was performed using one-way ANOVA with Dunnett’s post hoc test. *, p < 0.05; **, p < 0.01; ns, no significance.
Figure 9.
Figure 9.
Phosphorylated MAPT Ser262 accumulates in autophagosomes at post-synaptic densities when either BAG3 or SYNPO expression is decreased. (a) Representative images of LC3B and DLG4/PSD95 colocalization in dendrites. Neurons were treated with either DMSO or bafilomycin A1 (BafA1) for 4 h before fixing and immunostaining. (b) Representative images of p-Ser262 and DLG4 co-staining in dendrites of neurons transduced with scramble (scr), shBag3 or shSynpo lentivirus. Arrow heads denote the overlapping of fluorescence. (c) Quantification of colocalization using Mander’s colocalization coefficient and object based analysis. In each condition, 18–20 neurons from 2 independent experiments were counted. 1–3 processes from each neuron were chosen for analysis. Data are shown as mean ± SEM. Statistical analysis was performed using one-way ANOVA with Dunnett’s post hoc test. **, p < 0.01, ****, p < 0.0001. Scale bar: 10 μm. Scale bar for the high magnification insets: 2 μm.

Similar articles

Cited by

References

    1. Ariosa AR, Klionsky DJ.. Autophagy core machinery: overcoming spatial barriers in neurons. J Mol Med (Berl). 2016;94(11):1217–1227. - PMC - PubMed
    1. Galluzzi L, Baehrecke EH, Ballabio A, et al. Molecular definitions of autophagy and related processes. Embo J. 2017;36(13):1811–1836. - PMC - PubMed
    1. Hara T, Nakamura K, Matsui M, et al. Suppression of basal autophagy in neural cells causes neurodegenerative disease in mice. Nature. 2006;441(7095):885–889. - PubMed
    1. Komatsu M, Waguri S, Chiba T, et al. Loss of autophagy in the central nervous system causes neurodegeneration in mice. Nature. 2006;441(7095):880–884. - PubMed
    1. Maday S, Holzbaur EL.. Compartment-specific regulation of autophagy in primary neurons. J Neurosci. 2016;36(22):5933–5945. - PMC - PubMed

Publication types

MeSH terms