. 2019 Feb 11;11(1):24.
doi: 10.1186/s13148-019-0621-5.

Identification of potential blood biomarkers for Parkinson's disease by gene expression and DNA methylation data integration analysis

Affiliations

Identification of potential blood biomarkers for Parkinson's disease by gene expression and DNA methylation data integration analysis

Changliang Wang et al. Clin Epigenetics. .

Abstract

Background: Blood-based gene expression or epigenetic biomarkers of Parkinson's disease (PD) are highly desirable. However, accuracy and specificity need to be improved, and methods for the integration of gene expression with epigenetic data need to be developed in order to make this feasible.

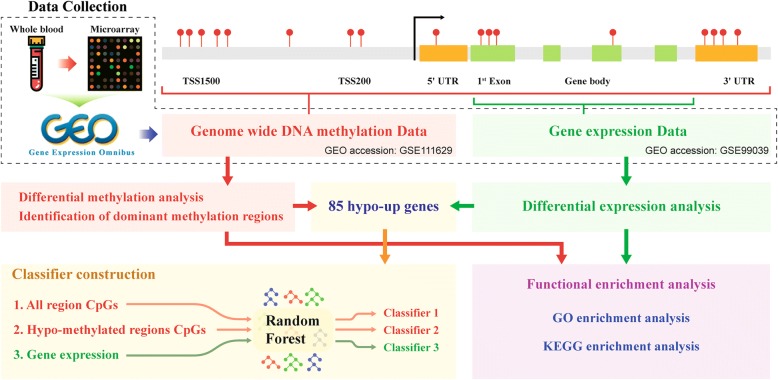
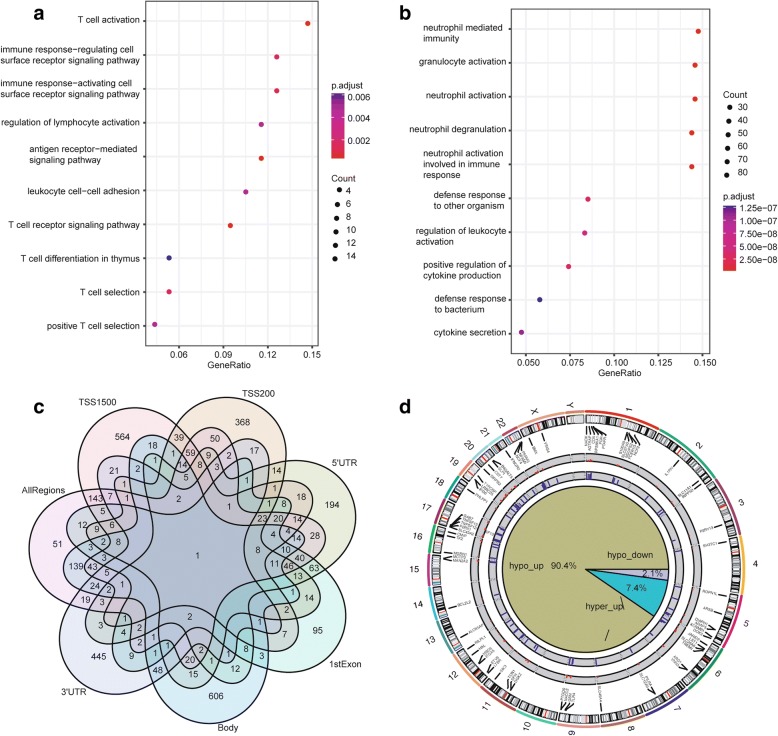
Methods: Whole blood gene expression data and DNA methylation data were downloaded from Gene Expression Omnibus (GEO) database. A linear model was used to identify significantly differentially expressed genes (DEGs) and differentially methylated genes (DMGs) according to specific gene regions 5'-C-phosphate-G-3' (CpGs) or all gene regions CpGs in PD. Gene set enrichment analysis was then applied to DEGs and DMGs. Subsequently, data integration analysis was performed to identify robust PD-associated blood biomarkers. Finally, the random forest algorithm and a leave-one-out cross validation method were performed to construct classifiers based on gene expression data integrated with methylation data.

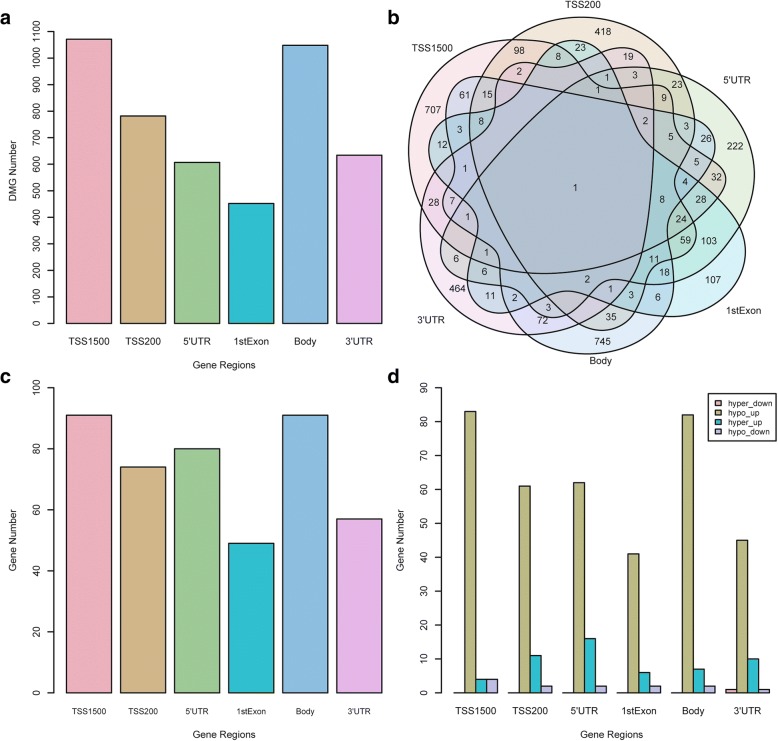
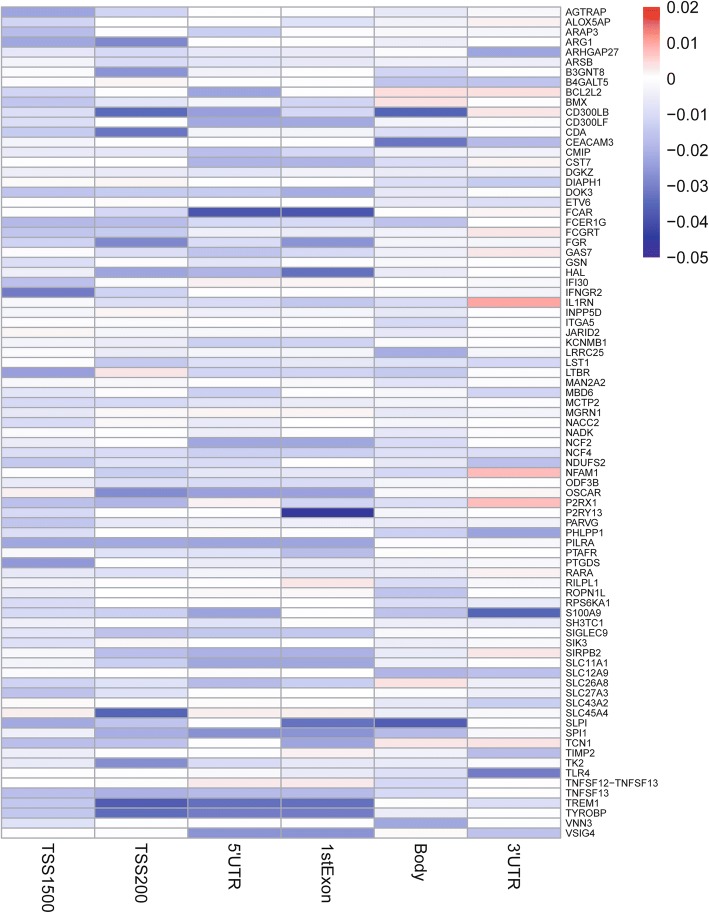
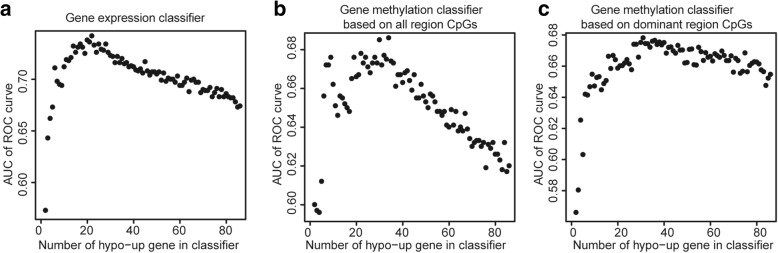
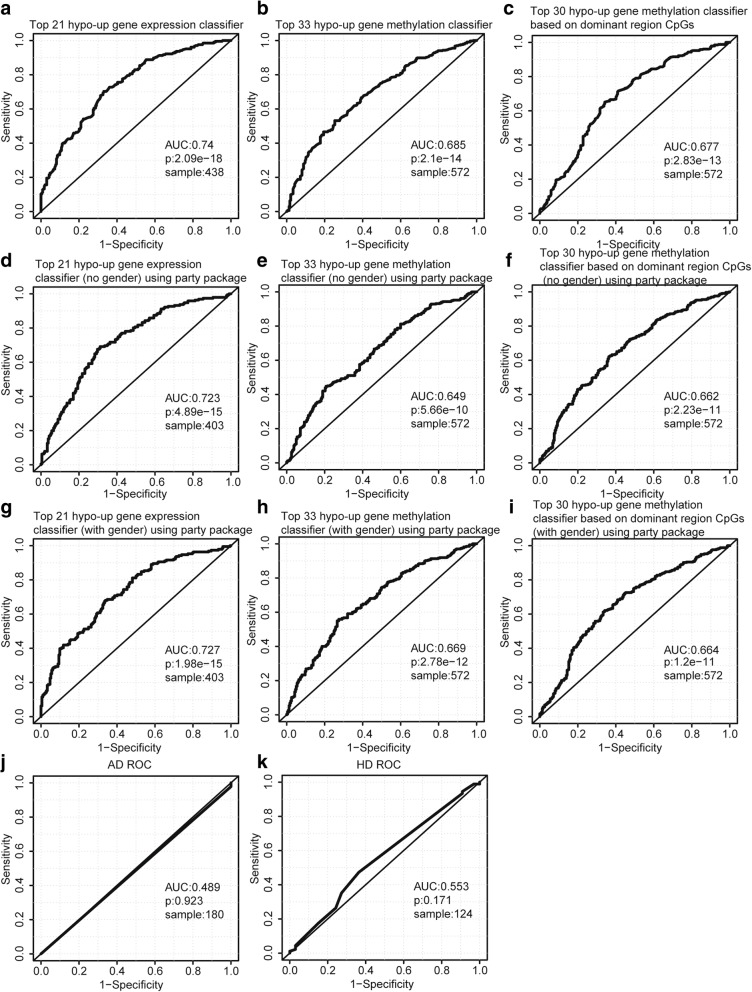
Results: Eighty-five (85) significantly hypo-methylated and upregulated genes in PD patients compared to healthy controls were identified. The dominant hypo-methylated regions of these genes were significantly different. Some genes had a single dominant hypo-methylated region, while others had multiple dominant hypo-methylated regions. One gene expression classifier and two gene methylation classifiers based on all or dominant methylation-altered region CpGs were constructed. All have a good prediction power for PD.

Conclusions: Gene expression and methylation data integration analysis identified a blood-based 53-gene signature, which could be applied as a biomarker for PD.

Keywords: DNA methylation; Data integration; Gene expression; Parkinson’s disease.


Conflict of interest statement

Ethics approval and consent to participate

Not applicable.

Consent for publication

Not applicable.

Competing interests

The authors declare that they have no competing interests.

Publisher’s Note

Springer Nature remains neutral with regard to jurisdictional claims in published maps and institutional affiliations.

Figures

Fig. 1
Fig. 1
Flowchart of the analysis process
Fig. 2
Fig. 2
Chromosome distribution of differentially methylated intergenic CpGs. The plot displays the distribution of differential intergenic CpG sites at 22 autosomes, the X chromosome, and the Y chromosome. The region in red is a hyper-methylated region, and the region in blue is a hypo-methylated region. The value is the logFC of the M value between PD patients and healthy controls
Fig. 3
Fig. 3
Integration analysis results of DMGs based on different region CpGs and DEGs. a Barplot for different region DMGs. The y-axis is the number of DMGs. The x-axis labels different gene regions: TSS1500, TSS200, 5′UTR, 1stExon, body, and 3′UTR. TSS1500 refers to 200–1500 bases upstream of the transcriptional start site (TSS). TSS200 means 0–200 bases upstream of TSS. 5′UTR stands for the 5′ untranslated region located between the TSS and the ATG start site. 1stExon is short for the first exon of the gene. Body is the region between ATG start site and stop codon. 3′UTR is short for 3′ untranslated region that is between stop codon and poly-A tail. b Venn plot for different region DMGs. The numbers on the diagram represent the DMG numbers in a specific region or multiple regions. Each region name is labeled beside the region circle. c Barplot for the overlap genes between DEG and different region DMGs. The y-axis is the number of overlap genes. The x-axis labels different gene regions: TSS1500, TSS200, 5′UTR, 1stExon, body and 3′UTR. d Barplot of four groups that overlap in each region. Hyper-down represents hyper-methylated and downregulated genes. Hypo-up represents hypo-methylated and upregulated genes. Hyper-up represents hyper-methylated and upregulated genes. Hypo-down represents hypo-methylated and downregulated genes. The y-axis is the number of genes
Fig. 4
Fig. 4
Enrichment analysis results and characteristics of DMGs based on all region CpGs. a Hyper-methylated genes enrichment analysis dotplot. The x-axis is the gene ratio. The y-axis is the enriched term list. The dot size represents the number of genes associated with a specific term. The dot color represents the adjusted p value of GSEA. b Hypo-methylated genes enrichment analysis dotplot. c Venn plot for different region DMGs and all region DMGs. The numbers on the diagram represent the DMG numbers in a specific region or multiple regions. Each region name is labeled beside the region circle. d Hypo-up genes genome position. The inner track is a pie chart for different overlap groups. Hypo-up represents hypo-methylated and upregulated genes. Hyper-up represents hyper-methylated and upregulated genes. Hypo-down represents hypo-methylated and downregulated genes. The second track is the barplot for the delta of beta value of hypo-up genes. The third track is the barplot for log2FC of hypo-up genes. The fourth track is parts of hypo-up gene names. The fifth track is the link from hypo-up gene name to chromosome position. The outer track is each chromosome
Fig. 5
Fig. 5
Hyper-up gene delta of beta value for each region. The columns are each region and the rows represent each hypo-up gene. The values are delta of beta value between PD patients and healthy controls at specific region for specific gene
Fig. 6
Fig. 6
Scatter plots illustrating the relationship between prediction power and number of hypo-up genes in classifier. a Gene expression classifier. x-axis represents the number of hypo-up genes in the classifier and y-axis represents the AUC value of the ROC curve for the classifier. AUC stands for area under the curve. ROC stands for receiver operating characteristic. b Gene methylation classifier based on all region CpGs. c Gene methylation classifier based on dominant methylation-altered regions
Fig. 7
Fig. 7
ROC curves for hypo-up gene classifiers. a Top 21 hypo-up gene expression classifier. AUC stands for area under the curve. ROC stands for receiver operating characteristic. The p value is calculated using the “wilcox.test” function. b Top 33 hypo-up gene methylation classifier based on all gene region CpGs. c Top 30 hypo-up gene methylation classifier based on dominant methylation-altered region CpGs. d–i These random forest classifiers composed of conditional inference trees are implemented by “party” package. d Top 21 hypo-up gene expression classifier for 403 samples with gender information but does not consider gender information as an input feature. e Top 33 hypo-up gene methylation classifier based on all gene region CpGs without “gender” as a feature. f Top 30 hypo-up gene methylation classifier based on dominant methylation-altered region CpGs without “gender” as a feature. g Top 21 hypo-up gene expression classifier with “gender” as a feature. h Top 33 hypo-up gene methylation classifier based on all gene region CpGs with “gender” as a feature. i Top 30 hypo-up gene methylation classifier based on dominant methylation-altered region CpGs with “gender” as a feature. j The ROC curve of top 21 gene expression classifier for AD samples. k The ROC curve of top 21 gene expression classifier for HD samples

References

    1. Kalia LV, Lang AE. Parkinson’s disease. Lancet. 2015;386(9996):896–912. - PubMed
    1. Oertel WH. Recent advances in treating Parkinson’s disease. F1000Res. 2017;6:260. - PMC - PubMed
    1. Warner TT, Schapira AH. Genetic and environmental factors in the cause of Parkinson’s disease. Ann Neurol. 2003;53(Suppl 3):S16–S23. - PubMed
    1. Yazdani U, Zaman S, Hynan LS, Brown LS, Dewey RB Jr, Karp D, German DC. Blood biomarker for Parkinson disease: peptoids. NPJ Parkinsons Dis. 2016;2:16012. - PMC - PubMed
    1. Thambisetty M, Lovestone S. Blood-based biomarkers of Alzheimer’s disease: challenging but feasible. Biomark Med. 2010;4(1):65–79. - PMC - PubMed

Publication types