. 2019 Feb 11;7(1):17.
doi: 10.1186/s40478-019-0671-0.

Endothelial edema precedes blood-brain barrier breakdown in early time points after experimental focal cerebral ischemia

Affiliations

Endothelial edema precedes blood-brain barrier breakdown in early time points after experimental focal cerebral ischemia

Martin Krueger et al. Acta Neuropathol Commun. .

Abstract

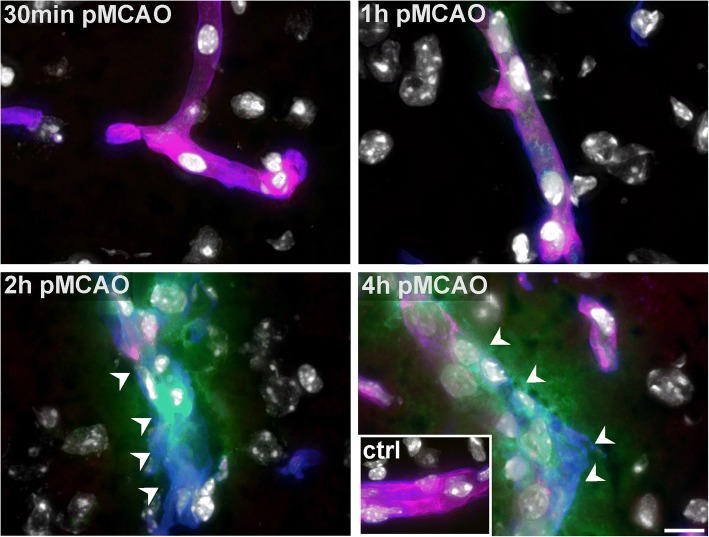
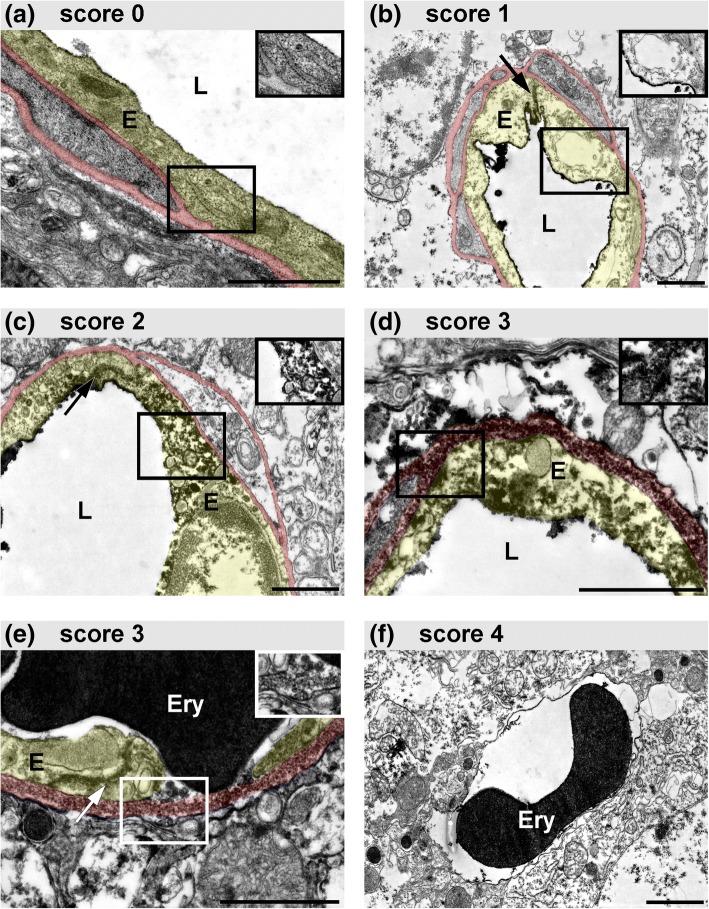
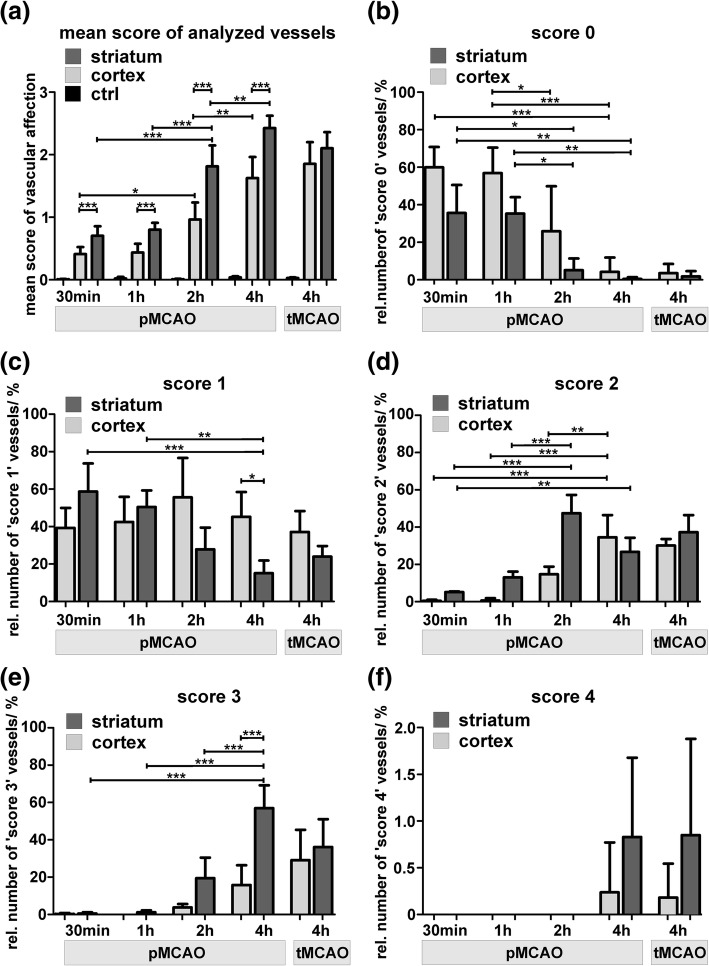
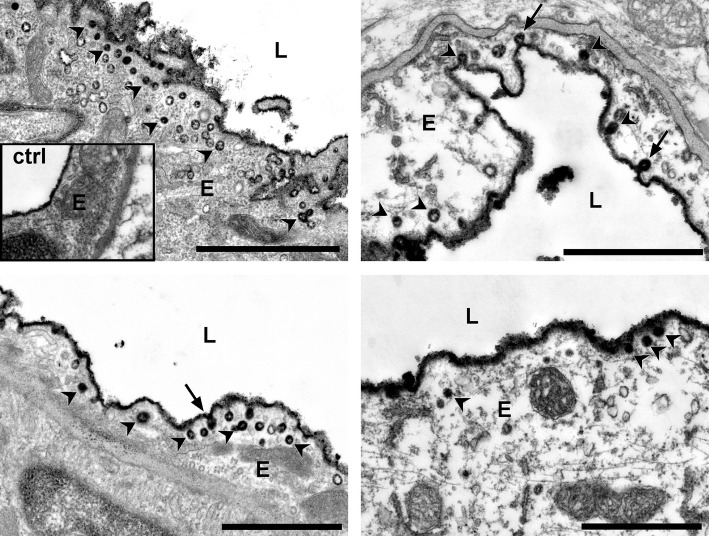
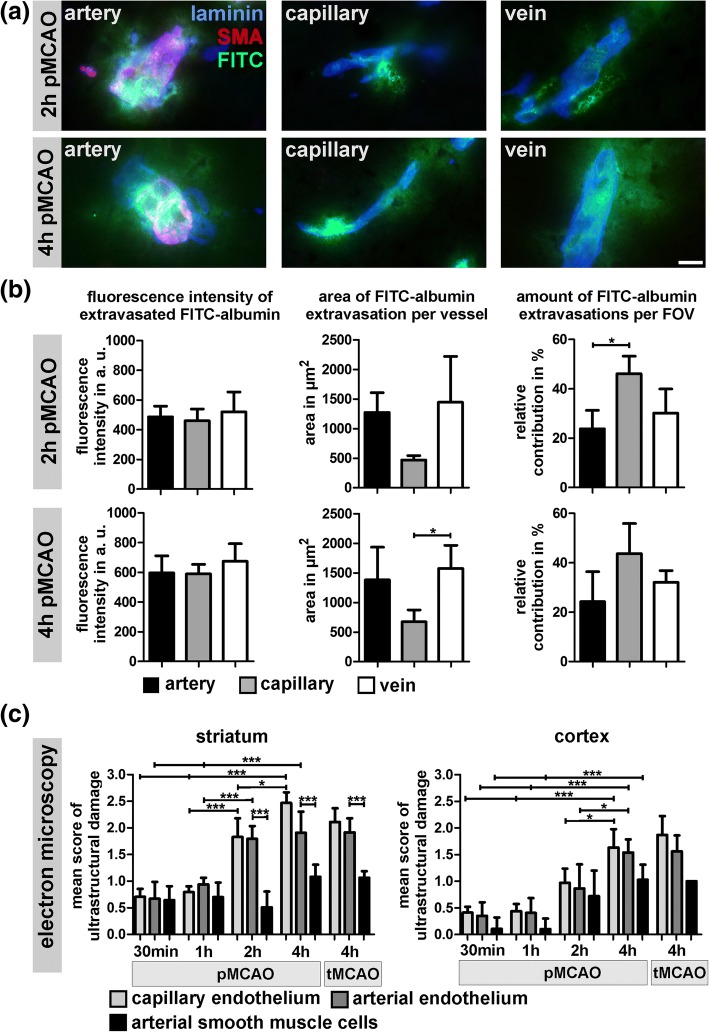
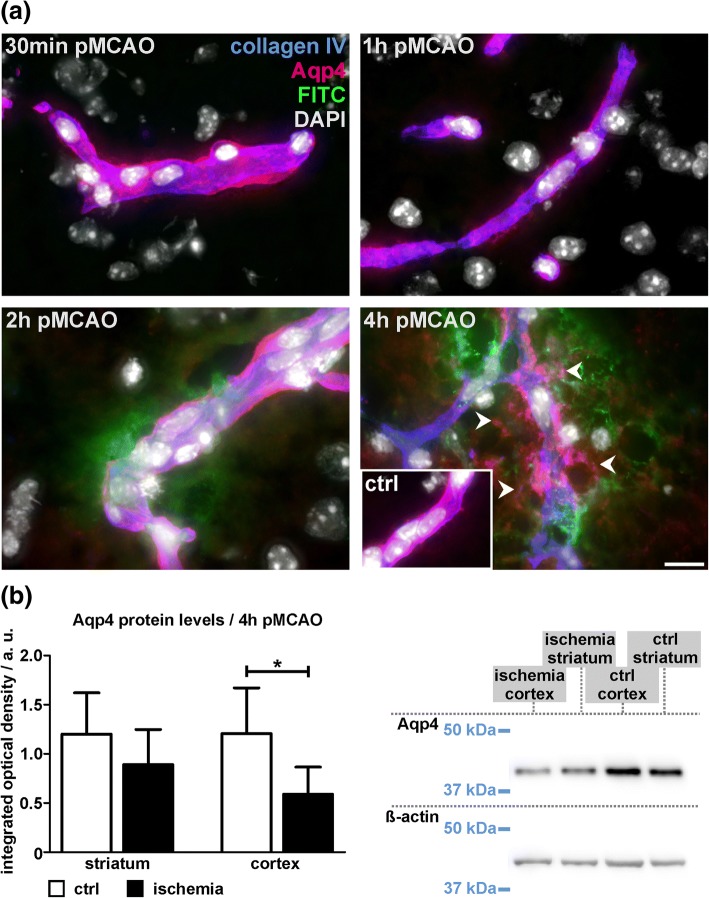
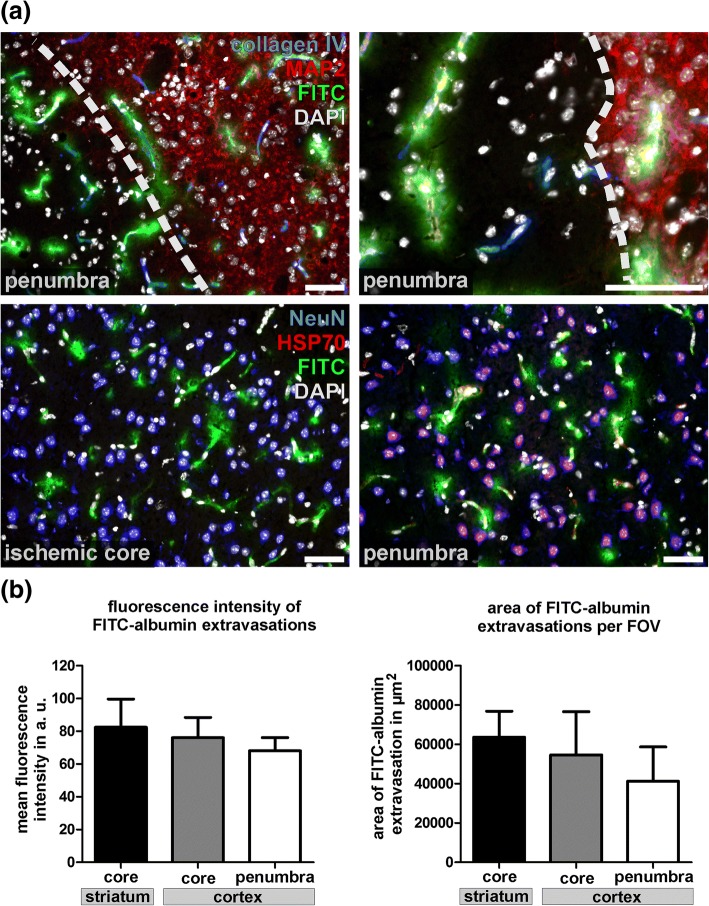
In the setting of stroke, ischemia-related blood-brain barrier (BBB) dysfunction aggravates the cerebral edema, which critically impacts on the clinical outcome. Further, an impaired vascular integrity is associated with the risk of intracranial bleeding, especially after therapeutic recanalization. Therefore, the present study was aimed to investigate early vascular alterations from 30 min to 4 h after experimental middle cerebral artery occlusion (MCAO) in mice. Here, an extravasation of the permeability marker FITC-albumin was detectable in animals 2 and 4 h after MCAO. Thereby, BBB breakdown correlated with alterations of the endothelial surface, indicated by a discontinuous isolectin-B4 staining, while tight junction strands remained detectable using electron and immunofluorescence microscopy. Noteworthy, already 30 min after MCAO, up to 60% of the ischemia-affected vessels showed an endothelial edema, paralleled by edematous astrocytic endfeet, clearly preceding FITC-albumin extravasation. With increasing ischemic periods, scores of vascular damage significantly increased with up to 60% of the striatal vessels showing loss of endothelial integrity. Remarkably, comparison of permanent and transient ischemia did not provide significant differences 4 h after ischemia induction. As these degenerations also involved penumbral areas of potentially salvageable tissue, adjuvant approaches of endothelial protection may help to reduce the vasogenic edema after ischemic stroke.

Keywords: Blood-brain barrier; Edema; Endothelium; Stroke; Tight junctions.


Conflict of interest statement

Ethics approval and consent to participate

All experiments involving animals were approved by institutional authorities (Landesdirektion Leipzig).

Consent for publication

Not applicable.

Competing interests

The authors declare that they have no competing interests.

Publisher’s Note

Springer Nature remains neutral with regard to jurisdictional claims in published maps and institutional affiliations.

Figures

Fig. 1
Fig. 1
a Immunofluorescence labeling of the tight junction (TJ) TJ marker occludin and the vascular basement membrane marker collagen IV reveals detectable occludin-positive TJ strands in vessels showing FITC-albumin (FITC) extravasations in ischemia-affected striatal areas. FITC-albumin extravasations indicative of BBB breakdown become visible as early as 2 h after pMCAO, while 1 h and 30 min pMCAO animals did not reveal FITC-albumin extravasations. Differences in the expression pattern of occludin between striatal and cortical regions were not observed. Nuclei are visualized with DAPI. Inset: contralateral control area; Scale bar: 10 μm. b Protein levels of occludin were analyzed in striatal and cortical areas using Western Blot analysis. Reduced occludin protein levels were found in the ischemia-affected striatum (p = 0.029; n = 6; Student’s t-test), whereas the difference in cortical areas failed to reach statistical significance (cortex: p = 0.167). Data are given as means. Error bars indicate SD
Fig. 2
Fig. 2
Representative micrographs showing ischemia-affected striatal areas of 4 h pMCAO, 2 h pMCAO, 1 h pMCAO and 30 min pMCAO animals. Vascular basement membranes are outlined by collagen IV immunolabeling while the endothelial surface is delineated by I-B4 staining. Of note, contralateral non-affected vessels show perfect co-localizations of I-B4 and collagen IV immunolabeling (inset). However, vessels showing FITC-albumin (FITC) extravasations (2 h and 4 h pMCAO) exhibit a discontinuous and patchy I-B4 staining pattern. Here, the vessels are partially devoid of any I-B4 staining, at all (arrow heads). In ischemia-affected areas of 1 h pMCAO animals, the endothelial I-B4 staining appeared slightly thinned and less intense. In vessels of 30 min pMCAO animals, the endothelial I-B4 signal did not differ when compared to the contralateral areas. Nuclei were visualized with DAPI. Scale bar: 10 μm
Fig. 3
Fig. 3
Representative electron micrographs obtained from areas of FITC-albumin extravasation of 4 h pMCAO animals illustrating different patterns of endothelial alterations. For comprehensibility, endothelial cells (E) are transparently highlighted in yellow. Vascular basement membranes are transparently highlighted in red. Insets show native image sections devoid of coloring. a Score 0: endothelial cells appear unaffected with a dense and compact cytoplasm. An extravasation of FITC-albumin is not observed. b Score 1: endothelial cells show a less electron dense cytoplasm indicative of an endothelial edema. Electron dense DAB-grains showing FITC-albumin remain restricted to the vascular lumen (L). If sectioned, TJ strands remain detectable (arrow). c Score 2: electron dense FITC-albumin-related DAB grains are found within the endothelial layer, but do not reach beyond the vascular basement membrane. Again, endothelial TJ remain detectable (arrow). d & e Score 3: FITC-albumin related DAB grains are not restricted to the endothelial layer, but reach the adjacent compartments of the neuropil, beyond the vascular basement membrane. Here, the endothelial integrity is lost, showing discontinuous plasma membranes of the endothelial layer (d). Often, parts of the endothelial cell are detached from the underlying basement membrane (e). f Score 4: in rare cases, erythrocytes are found to extravasate into the neuropil, not being associated to the vascular compartment. Scale bars: each 1 μm
Fig. 4
Fig. 4
At the level of electron microscopy, the described scores of vascular damage are used to quantitatively address vascular alterations at an ultrastructural level. a Mean score of analyzed vessels in contralateral control areas (ctrl), and ischemia-affected striatal and cortical areas of 30 min, 1 h, 2 h and 4 h pMCAO animals. Further, analysis included 4 h tMCAO animals, representing the reperfusion scenario. b-f Comparison of the relative numbers of ischemia-affected vascular damage (score 0–4). Importantly, the relative number of vessels showing an unaffected endothelial cells (score 0) is found to decrease from 30 min to 4 h pMCAO animals. Of note, as soon as 30 min after ischemia onset, up to 60% of the analyzed vessels show signs of an endothelial edema (c, score 1). In line, more severe scores (score 2 & 3) are found to be significantly increased when comparing 30 min, 1 h, 2 h and 4 h pMCAO animals. f An extravasation of erythrocytes was restricted to 4 h pMCAO and tMCAO animals, but appeared to be a rare event. Of note, for all the described scores, a direct comparison between 4 h pMCAO and 4 h tMCAO animals did not reveal statistically significant differences. * p < 0.05, ** p < 0.01, *** p < 0.001; 30 min, 1 h, 2 h pMCAO and 4 h tMCAO: n = 4; 4 h pMCAO: n = 5; ANOVA followed by Bonferroni’s multiple comparison test. Data are given as means. Error bars indicate SD
Fig. 5
Fig. 5
Electron micrographs illustrating the presence of FITC-albumin-related DAB-positive endothelial vesicles (arrow heads) and caveolae (arrows), which became apparent from 1 h to 4 h of pMCAO and in 4 h tMCAO after ischemia induction. Here, caveolae as well as vesicles were regularly detected in endothelial cells showing an endothelial edema (score 1). Inset: contralateral non-affected vessel. L = vascular lumen; scale bars: each 1 μm
Fig. 6
Fig. 6
a Double immunofluorescence labeling of laminin (blue) and SMA (red) is used to illustrate the extravasation of FITC-albumin (green) at the level of arteries, capillaries and veins. Images are obtained from the ischemia-affected striatum of 2 h pMCAO and 4 h pMCAO mice. Scale bar: 10 μm. b Further, the extent of FITC-albumin related BBB breakdown was analyzed along different segments of the vascular tree in 2 h and 4 h pMCAO mice. Here, the mean fluorescence intensity of FITC-albumin extravasations, the area of the extravasations per type of vessel and the relative contribution per field of view (FOV) were analyzed (n = 4, ANOVA followed by Bonferroni’s multiple comparison test). c Analysis of the mean score of ultrastructural damage at the level of electron microscopy in ischemia-affected arterial vessels and adjacent capillaries. In line with the results shown in Fig. 4, the mean scores of ultrastructural damage are significantly increased from 30 min to 4 h of MCAO. Importantly, arterial and capillary endothelial cells exhibit comparable scores of ultrastructural damage in the ischemia-affected striatum and the cortex. Compared to arterial and capillary endothelial cells, arterial smooth muscle cells of the vascular wall are significantly less affected after 2 and 4 h of ischemia, predominantly showing a cellular edema (‘score 1’), only. Comparison between 4 h pMCAO and tMCAO animals did not provide statistically significant differences. 30 min, 1 h, 2 h pMCAO and 4 h tMCAO: n = 4; 4 h pMCAO: n = 5; ANOVA followed by Bonferroni’s multiple comparison test. (b & c) Data are given as means. Error bars indicate SD
Fig. 7
Fig. 7
a Representative micrographs showing immunofluorescence labeling of vascular basement membranes (collagen IV) and aquaporin 4 (Aqp4) to illustrate the ischemia-associated affections of juxtavascular astrocytes. Again, an extravasation of FITC-albumin (FITC) is observed in 2 h and 4 h pMCAO animals. In contralateral control regions (ctrl, inset) Aqp4 expression is highly polarized and confined to astrocytic endfeet directly adjacent to the vascular basement membrane. Importantly, this polarization is lost around vessels showing FITC-albumin extravasation in 4 h pMCAO animals. Although FITC-albumin extravasations are also observed in 2 h pMCAO animals, an astrocytic depolarization is not observed, matching the observations from 1 h and 30 min pMCAO animals. Nuclei are visualized with DAPI. Scale bar: 10 μm. b Western Blot analysis reveals significantly decreased Aqp4 protein levels in cortical areas of 4 h pMCAO animals (p = 0.026), while this difference failed to reach statistical significance in the striatum. n = 6, Student’s t-test. Data are given as means. Error bars indicate SD
Fig. 8
Fig. 8
a Upper panel: Representative images obtained from the cerebral cortex of 4 h pMCAO animals illustrating that FITC-albumin (FITC) extravasations are found at the border zone of downregulated MAP2 expression, which represent penumbral areas. Collagen IV was used to identify cerebral vessels while nuclei are visualized with DAPI. Lower panel: In 4 h pMCAO animals, FITC-albumin extravasations are found in areas of neuronal HSP70 up-regulation, again representing areas of the ischemic penumbra. Of note, FITC-albumin extravasations are not restricted to penumbral areas, but are also found in striatal areas of the presumed ischemic core, which are lacking a selective HSP70 up-regulation in neurons. NeuN is used to identify neurons, while nuclei are visualized with DAPI. Scale bars: 50 μm. b Analysis of the mean fluorescence intensity of extravasated FITC-albumin (left) and the extravascular FITC-albumin spreading (right) in regions with neuronal HSP70 expression (penumbra) and lacking HSP70 expression (core). Data are obtained from different fields of view (FOV) at lower magnification (20×) from the ischemia-affected cortex. Direct comparison between core and penumbra failed to provide statistically significant differences (left: p = 0.345; right: p = 0.26; each n = 4, ANOVA followed by Bonferroni’s multiple comparison test). Data are given as means. Error bars indicate SD.

References

    1. Albers GW, Marks MP, Kemp S, et al. Thrombectomy for stroke at 6 to 16 hours with selection by perfusion imaging. N Engl J Med. 2018;378(8):708–718. doi: 10.1056/NEJMoa1713973. - DOI - PMC - PubMed
    1. Alvarez JI, Dodelet-Devillers A, Kebir H, et al. The hedgehog pathway promotes blood-brain barrier integrity and CNS immune quiescence. Science. 2011;334(6063):1727–1731. doi: 10.1126/science.1206936. - DOI - PubMed
    1. Astrup J, Siesjö BK, Symon L. Thresholds in cerebral ischemia - the ischemic penumbra. Stroke. 1981;12(6):723–725. doi: 10.1161/01.STR.12.6.723. - DOI - PubMed
    1. Battey TW, Karki M, Singhal AB, et al. Brain edema predicts outcome after nonlacunar ischemic stroke. Stroke. 2014;45(12):3643–3648. doi: 10.1161/STROKEAHA.114.006884. - DOI - PMC - PubMed
    1. Bechmann I, Galea I, Perry VH. What is the blood-brain barrier (not)? Trends Immunol. 2007;28:5–11. doi: 10.1016/j.it.2006.11.007. - DOI - PubMed

Publication types