. 2019 Jan 28:10:4.
doi: 10.3389/fimmu.2019.00004. eCollection 2019.

Immunobiochemical Reconstruction of Influenza Lung Infection-Melanoma Skin Cancer Interactions

Affiliations

Immunobiochemical Reconstruction of Influenza Lung Infection-Melanoma Skin Cancer Interactions

Evgeni V Nikolaev et al. Front Immunol. .

Abstract

It was recently reported that acute influenza infection of the lung promoted distal melanoma growth in the dermis of mice. Melanoma-specific CD8+ T cells were shunted to the lung in the presence of the infection, where they expressed high levels of inflammation-induced cell-activation blocker PD-1, and became incapable of migrating back to the tumor site. At the same time, co-infection virus-specific CD8+ T cells remained functional while the infection was cleared. It was also unexpectedly found that PD-1 blockade immunotherapy reversed this effect. Here, we proceed to ground the experimental observations in a mechanistic immunobiochemical model that incorporates T cell pathways that control PD-1 expression. A core component of our model is a kinetic motif, which we call a PD-1 Double Incoherent Feed-Forward Loop (DIFFL), and which reflects known interactions between IRF4, Blimp-1, and Bcl-6. The different activity levels of the PD-1 DIFFL components, as a function of the cognate antigen levels and the given inflammation context, manifest themselves in phenotypically distinct outcomes. Collectively, the model allowed us to put forward a few working hypotheses as follows: (i) the melanoma-specific CD8+ T cells re-circulating with the blood flow enter the lung where they express high levels of inflammation-induced cell-activation blocker PD-1 in the presence of infection; (ii) when PD-1 receptors interact with abundant PD-L1, constitutively expressed in the lung, T cells loose motility; (iii) at the same time, virus-specific cells adapt to strong stimulation by their cognate antigen by lowering the transiently-elevated expression of PD-1, remaining functional and mobile in the inflamed lung, while the infection is cleared. The role that T cell receptor (TCR) activation and feedback loops play in the underlying processes are also highlighted and discussed. We hope that the results reported in our study could potentially contribute to the advancement of immunological approaches to cancer treatment and, as well, to a better understanding of a broader complexity of fundamental interactions between pathogens and tumors.

Keywords: PD-1/PD-L1; incoherent feedforward loop; influenza; mathematical modeling; melanoma.


Figures

Figure 1
Figure 1
Schematic representation of lymphocyte re-circulation routes. There are two different routes for naïve and activated trafficking lymphocytes (12, 13). First, due to the data discussed in Owen et al. (, Ch.14) and, independently estimated in Van den Berg (, p. 23) after approximately 30 min. transit time in the blood, about 45% of all naïve lymphocytes (produced by the thymus and bone marrow) migrate to the spleen, where they reside for about 5 h. Another 45% of lymphocytes enter various peripheral nodes, where they remain for 12–18 h, scanning stromal cell surfaces. A smaller fraction of lymphocytes migrate to secondary lymphoid tissues (skin, gastrintestinal, etc.), to protect the organism against the external environment. Thus, about 5% of the lymphocytes are, at resting conditions, in the blood, and the majority resides in the lymph nodes. Second, as discussed in Poleszczuk et al. (15) activated CTLs enter the blood system via the great veins, flow through the pulmonary circulation, and, then, continue into systemic circulation. Venus blood from gastrointestinal tract and spleen goes to the liver through the hepatic portal vein. In all cases, lymphocytes migrate from the blood into lymph nodes through high-endothelial venues, specialized areas in postcappillary venues. (a) MALT is Mucosa Associated Lymphoid Tissue. (b) Lymph nodes have both afferent and efferent lymphatic vessels, while MALT, Spleen, and Thymus have efferent lymphatic only (12).
Figure 2
Figure 2
Regulation of PD-1 expression. Two different IFFLs, sharing a common set of species and regulatory activities highlighted in red, are presented. Both IFFLs are activated by the same input (Ag). The left hand side (A) depicts a dose-dependent biphasic activation of PD-1. The elements of the corresponding IFFL are highlighted in blue and red colors. When the input, the Ag dose, increases, the output, the PD-1 level, first also increases but then subsequently decreases. The right hand side (B) corresponds to a dose-dependent activation of Bcl-6. The elements of the corresponding IFFL are highlighted in green and red colors. Over a certain range of input dose, the Ag level, the output, in this case Bcl-6 level, increases but with a subsequent increase in the Ag dose, the Bcl-6 level then decreases.
Figure 3
Figure 3
The PD-1 DIFFL motif in the context of complex influenza-tumor interactions. (A) Shows the PD-1 DIFFL response in an anti-influenza CD8+ T cell in the infected lung. (B) Shows the response of the PD-1 DIFFL circuit in an anti-tumor CD8+ T cell in the TME. (C) Shows the PD-1 DIFFL response in an anti-tumor CD8+ T cell in the influenza-infected lung. (D) Shows the PD-1 DIFFL response in an anti-tumor CD8+ T cell in the influenza-infected lung after PD-1 blockade. Gray color corresponds to weak or disabled reactions shaped by the given inflammation context. Symbol + inside a circle in (C) shows the additional PD-1 activation route initiated by external cytokines in the case when the Blimp-1 mediated repression of PD-1 expression is absent. This route does not play any significant role in the case when the expression of PD-1 is suppressed by active Blimp-1 as in (A). Arrows denote activation, and barred lines denote repression. The abbreviation APCs stands for (influenza) Antigen Presenting Cells.
Figure 4
Figure 4
PD-1:PD-L1 induced paralysis of the anti-tumor exhausted CD8+ T cells in the infected site. (A) Suggests that anti-melanoma TEFF cells become paralyzed in the infected lung. In contrast, (B) suggests that anti-VACV TEFF studied in Kohlhapp et al. (1) can freely enter and leave the infected lung with the lymph motion and blood flow due to the lack of large amounts of PD-1 receptors on their surface. The immune suppressive environment (4) induced by inflammation in the infected lung is caused by multiple interactions between PD-1 receptors, expressed in large quantities on the surface of the anti-melanoma TEFF, and the PD-L1 ligands expressed in large quantities on the surface of various host immune cells (macrophages, DCs, and MDSCs) and the epithelium (29).
Figure 5
Figure 5
PD-1 DIFFL responses in the absence of PD-1:PD-L1 interaction. The color-coded plots corresponds to the PD-1 DIFFL-induced adaptation with respect to increasing Ag-levels. To obtain a full adaptation, approximately a 103-fold increase in the Ag-level is required. Four different (bottom-up) shades of green color correspond to koff=10-4,2.03×10-4,4.13×10-4, and 5.88 × 10⁻⁴, respectively. Two shades of blue color correspond to koff=2.43×10⁻³ and 7.01 × 10⁻³, respectively. Four (top-down) shades of purple color correspond to koff=2.03×10-2,4.13×10-2,5.88×10-2, and 8.38 × 10⁻². Magenta color corresponds to koff = 1.0. Black color corresponds to koff = 49.24. (A–D) Correspond to the levels of four species, PD-1, Blimp-1, Bcl-6, and IRF4, computed from the model developed in SI2, respectively.
Figure 6
Figure 6
Expression of PD-1 in the case when the expression of IRF4 is disabled. The levlel of PD-1 receptors in (A) is computed from our model developed in SI2. The level of TCR activity in (B) is computed from the model developed in Lever et al. (74) as explained in SI-2. All other explanations and parameter values are as in Figure 5.
Figure 7
Figure 7
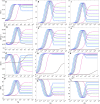
PD-1 DIFFL responses in the presence of PD-1:PD-L1 interaction. (A–D) Correspond the case when 20% of PD-1 receptors are ligated with PD-L1. (E–H) Correspond the case when 50% of PD-1 receptors are ligated with PD-L1. (I–L) correspond the case when 90% of PD-1 receptors are ligated with PD-L1. All other explanations are provided in the legend for Figure 5.
Figure 8
Figure 8
Schematic illustration of the adaption loss/gain hypothesis. Solid filled circles on the corresponding graphs of PD-1 receptor levels (top panels), plotted vs. the log-concentrations of Ag, correspond to the levels of PD-1 receptors on anti-melanoma (A) and anti-virus (B) CD8+ T cells, respectively (top panels). Phenotype (B) corresponds to a fully developed adaptation of the PD-1 expression with respect to the increasing levels of Ag, while phenotype (A) is characterized by the lack of such adaptation. Bottom (C,D) show time-dependent levels of BCL-1 tumor cells (left) and LCMV virus titers (right) in the spleen. The data points are digitized from the corresponding plots in Kuznetsov et al. (91) and Bocharov et al. (92), respectively. Comparing (C,D), we observe that the changes in the tumor Ag levels within the first 7 days are small, corresponding to the fold change less than 10 as seen from (C). At the same time, the viral Ag levels change significantly, corresponding to the 104-fold increase during the first seven days as seen from (D). The small 7-day tumor Ag-level increase shown in (C) corresponds to the red solid “snapshot” circle in (A), while the large 7-day increase in the viral Ag level shown in (D) corresponds to the green solid “snapshot” circle in (B). Additional detailed explanations of (A–D) are provided in the main text.

Similar articles

Cited by

References

    1. Kohlhapp FJ, Huelsmann EJ, Lacek AT, Schenkel JM, Lusciks J, Broucek JR, et al. . Non-oncogenic acute viral infections disrupt anti-cancer responses and lead to accelerated cancer-specific host death. Cell Rep. (2016) 17:957–65. 10.1016/j.celrep.2016.09.068 - DOI - PMC - PubMed
    1. Zloza A. Viruses, bacteria, and parasites - oh my! a resurgence of interest in microbial-based therapy for cancer. J Immunother Cancer (2018) 6:3. 10.1186/s40425-017-0312-8 - DOI - PMC - PubMed
    1. Grossman Z, Paul WE. Adaptive cellular interactions in the immune system: the tunable activation threshold and the significance of subthreshold responses. Proc Natl Acad Sci USA (1992) 89:10365–9. 10.1073/pnas.89.21.10365 - DOI - PMC - PubMed
    1. Grossman Z, Paul WE. Autoreactivity, dynamic tuning and selectivity. Curr Opin Immunol. (2001) 13:687–98. 10.1016/S0952-7915(01)00280-1 - DOI - PubMed
    1. Grossman Z, Paul WE. Dynamic tuning of lymphocytes: physiological basis, mechanisms, and function. Annu Rev Immunol. (2015) 33:677–713. 10.1146/annurev-immunol-032712-100027 - DOI - PubMed

Publication types

MeSH terms