

A nonparametric methodological analysis of rest-activity rhythm in type 2 diabetes
- PMID: 30746047
- PMCID: PMC6361299
- DOI: 10.5935/1984-0063.20180044
A nonparametric methodological analysis of rest-activity rhythm in type 2 diabetes
Abstract
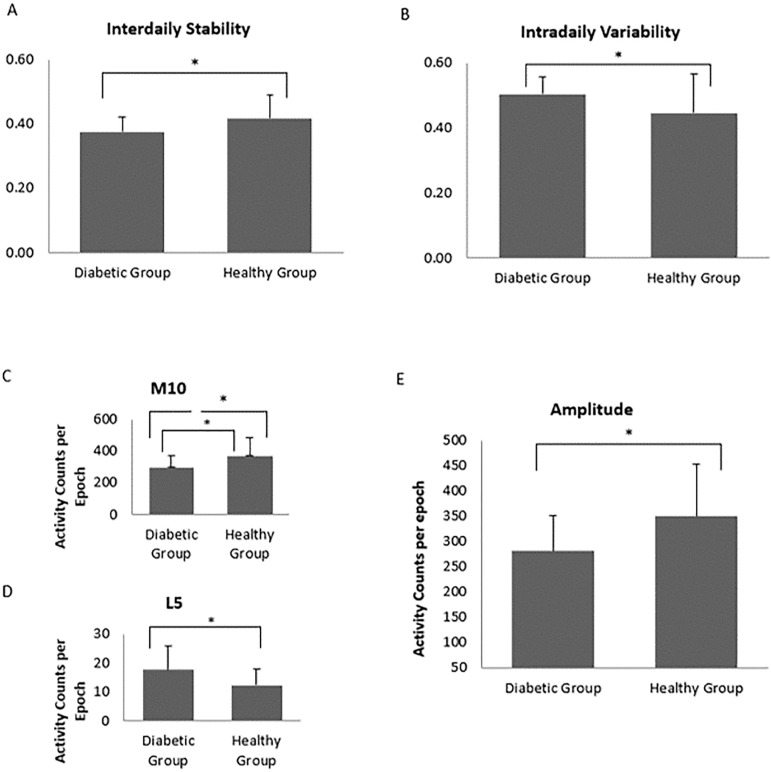
The purpose of this study was to analyze the rest-activity rhythm of type 2 diabetics mellitus (T2DM) and compare it to healthy controls using the nonparametric analytic approach. Twenty-one diabetics and 21 healthy subjects matched for gender and age were recruited to participate in the study. Data were analyzed using the Independent t-test, Mann-Whitney U test, and Spearmans correlation. T2DM subjects demonstrate lower interdaily stability (IS) (p=.03), higher intradaily variability (p=.046) and lower rhythm amplitude (p=.02) when compared to healthy controls. Also, there was a positive correlation between IS and most active 10 hr (M10) in the average of 24 hours pattern (r =.44; p=.046) in the diabetes group and a negative correlation between IV and M10 in the healthy group (r =-.57; p=.007). These data together suggest that T2DM exhibits a dysfunction in the rest-activity rhythm due to alterations in the circadian function as well as in the homeostatic capacity to maintain sleep; mainly characterized by less consistency across days of the daily circadian signal, higher rhythm fragmentation and lower rhythm amplitude. Future approaches may be developed considering the influence of circadian glucose variations throughout the day on the coupling of the rest-activity rhythm to zeitgeber and rhythm fragmentation.
Keywords: Circadian Rhythm; Diabetes Mellitus, Type 2; Sleep Wake Disorders.
Figures
References
-
- Department of Health and Human Services. Centers for Disease Control and Prevention . National diabetes fact sheet: national estimates and general information on diabetes and prediabetes in the United States, 2011. Atlanta: Department of Health and Human; 2011.
-
- Centers for Disease Control and Prevention . National Diabetes Statistics Report, 2017: Estimates of Diabetes and Its Burden in the United States. Atlanta: Centers for Disease Control and Prevention; 2017.
-
- Wild S, Roglic G, Green A, Sicree R, King H. Global prevalence of diabetes: estimates for the year 2000 and projections for 2030. Diabetes Care. 2004;27(5):1047–1053. - PubMed
-
- World Health Organization . Methods and data sources for country-level causes of death 2000-2015. Geneva: World Health Organization; 2017.
LinkOut - more resources
Full Text Sources