. 2019 Jan 16;5(1):eaat4858.
doi: 10.1126/sciadv.aat4858. eCollection 2019 Jan.

Standards for distribution models in biodiversity assessments

Affiliations

Standards for distribution models in biodiversity assessments

Miguel B Araújo et al. Sci Adv. .

Abstract

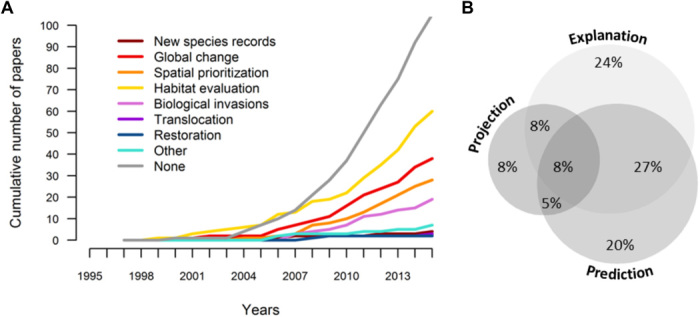
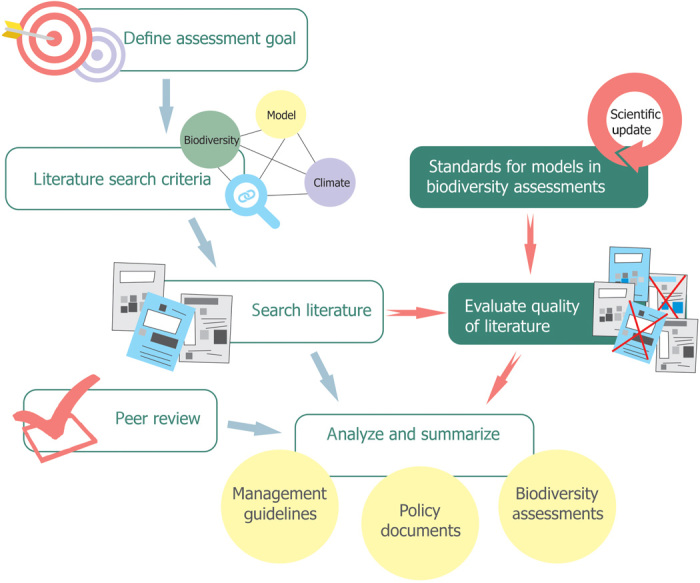
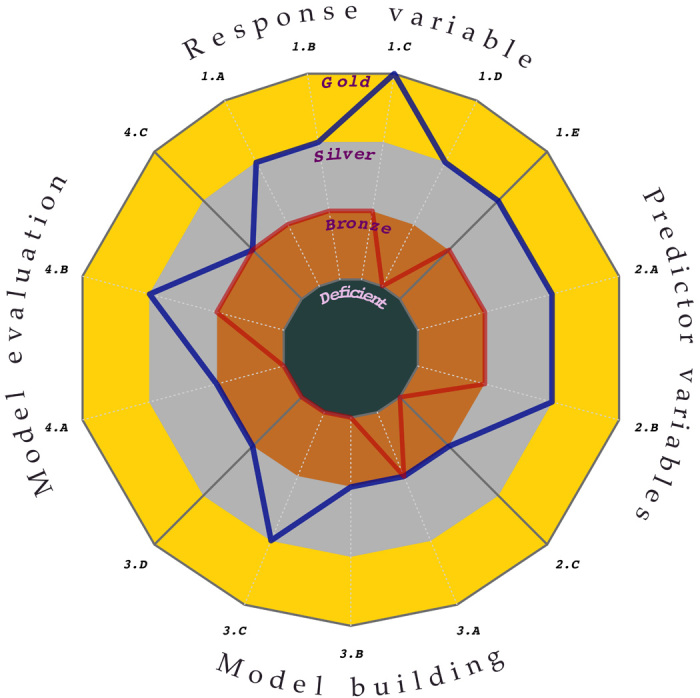
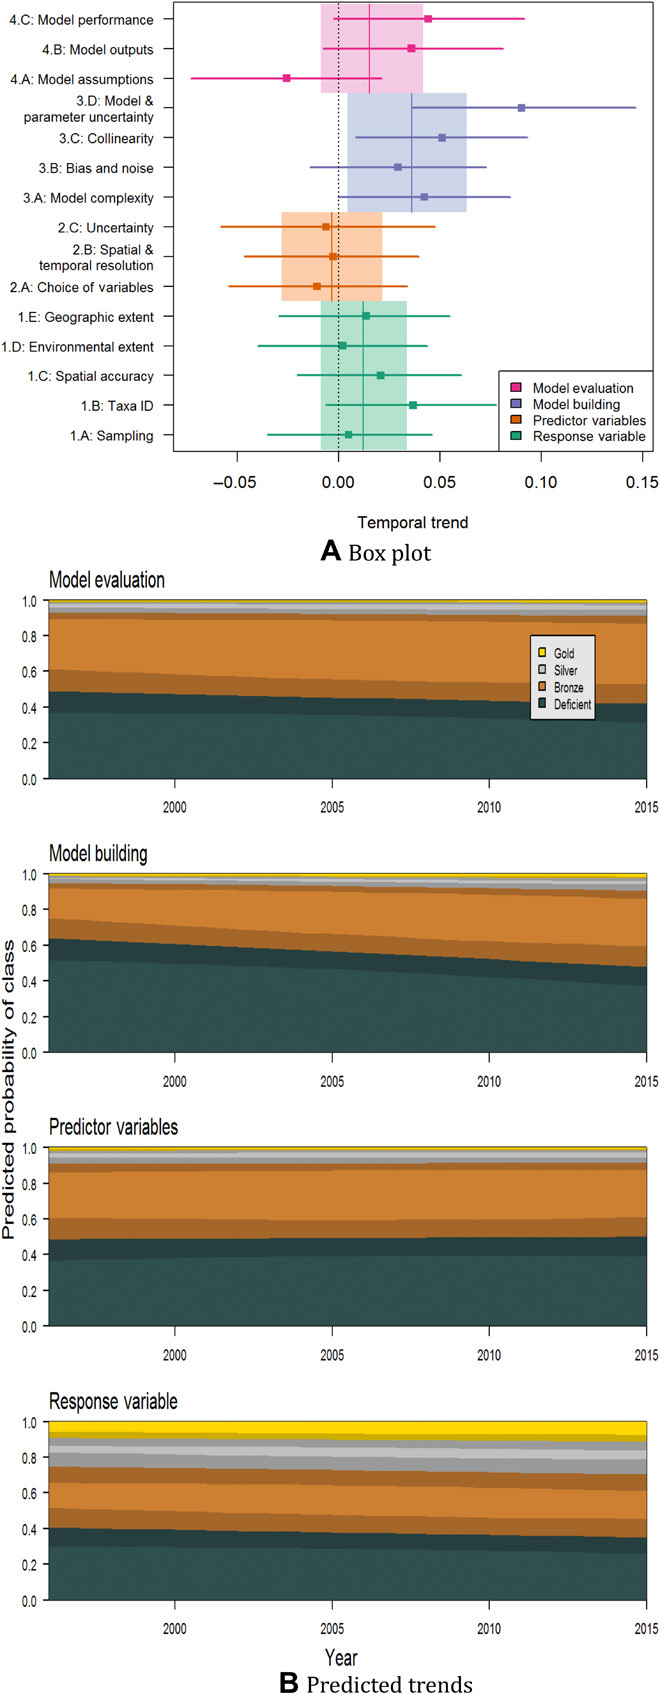
Demand for models in biodiversity assessments is rising, but which models are adequate for the task? We propose a set of best-practice standards and detailed guidelines enabling scoring of studies based on species distribution models for use in biodiversity assessments. We reviewed and scored 400 modeling studies over the past 20 years using the proposed standards and guidelines. We detected low model adequacy overall, but with a marked tendency of improvement over time in model building and, to a lesser degree, in biological data and model evaluation. We argue that implementation of agreed-upon standards for models in biodiversity assessments would promote transparency and repeatability, eventually leading to higher quality of the models and the inferences used in assessments. We encourage broad community participation toward the expansion and ongoing development of the proposed standards and guidelines.


Figures

Fig. 1
Fig. 1. Uses of SDMs.
Classification of published species distribution modeling studies by (A) type of biodiversity assessment accomplished with the trend in the numbers of studies shown over time and (B) purpose of the model (see glossary in text S4). In (A), the trend for translocation is very similar to that of restoration, and hence is hardly visible. The classification is based on a random sample of 400 papers (of 6483 identified articles mentioning statistical models of species distributions); 238 of the randomly selected papers used SDMs and were included in this analysis. Details on the literature search and analyses appear in text S1, figs. S1.1, S1.2, S1.3, and S1.4, and tables S1.1, S1.2, and S1.3.
Fig. 2
Fig. 2. Steps in biodiversity assessments.
Assessment process flow as typically implemented by international and national initiatives on biodiversity and/or climate change (e.g., IPBES, IPCC, IUCN, and national governments) and the suggested addition of agreed-upon (and updated) standards to ensure the adequacy of studies feeding into the assessments. Blue arrows and hollow boxes represent the current procedure, and red arrows and green-filled boxes represent the suggested additional steps.
Fig. 3
Fig. 3. Best-practice standards achieved by 400 species distribution modeling studies (1995–2015).
The lines show quantiles of scores for each issue across all studies (blue = top 90% of studies; red = top 50%). See tables S2.1, S2.2, S2.3, and S2.4 for definition of standards. The area inside the respective polygon (defined by the blue and red lines) is used as a metric of overall quality of the models. The greater the area inside the polygon, the higher the overall scores for the standards. Details on the selection and scoring of articles are provided in text S3 and table S3.1.
Fig. 4
Fig. 4. Changes in best-practice standards of species distribution modeling studies over time.
The diagrams show the results of ordinal regression using “Year” as a continuous variable and the four key aspects of modeling as effects (including an interaction). The analysis was implemented for a sample of 400 modeling studies used for various biodiversity assessments between 1995 and 2015. (A) Values near zero on the x axis represent no change in standards over time, positive values indicate improvement, and bars are 95% credible intervals. (B) Shading represents the 95% credible intervals. Note clear increase in the number of acceptable studies regarding model building as well as lesser increases in the quality of studies with regard to model evaluation and response data. Details on the selection and scoring of articles are provided in text S3 and table S3.1. Figure S1.5 shows the raw scores used.

References

    1. Lewis S. L., Maslin M. A., Defining the Anthropocene. Nature 519, 171–180 (2015). - PubMed
    1. Barnosky A. D., Matzke N., Tomiya S., Wogan G. O. U., Swartz B., Quental T. B., Marshall C., McGuire J. L., Lindsey E. L., Maguire K. C., Mersey B., Ferrer E. A., Has the Earth’s sixth mass extinction already arrived? Nature 471, 51–57 (2011). - PubMed
    1. Hooper D. U., Adair E. C., Cardinale B. J., Byrnes J. E. K., Hungate B. A., Matulich K. L., Gonzalez A., Duffy J. E., Gamfeldt L., O’Connor M. I., A global synthesis reveals biodiversity loss as a major driver of ecosystem change. Nature 486, 105–108 (2012). - PubMed
    1. Pereira H. M., Leadley P. W., Proença V., Alkemade R., Scharlemann J. P. W., Fernandez-Manjarrés J. F., Araújo M. B., Balvanera P., Biggs R., Cheung W. W. L., Chini L., Cooper H. D., Gilman E. L., Guénette S., Hurtt G. C., Huntington H. P., Mace G. M., Oberdorff T., Revenga C., Rodrigues P., Scholes R. J., Sumaila U. R., Walpole M., Scenarios for global biodiversity in the 21st century. Science 330, 1496–1501 (2010). - PubMed
    1. Urban M. C., Bocedi G., Hendry A. P., Mihoub J.-B., Pe’er G., Singer A., Bridle J. R., Crozier L. G., De Meester L., Godsoe W., Gonzalez A., Hellmann J. J., Holt R. D., Huth A., Johst K., Krug C. B., Leadley P. W., Palmer S. C. F., Pantel J. H., Schmitz A., Zollner P. A., Travis J. M. J., Improving the forecast for biodiversity under climate change. Science 353, eaad8466 (2016). - PubMed

Publication types

LinkOut - more resources