

Catalyst-free, highly selective synthesis of ammonia from nitrogen and water by a plasma electrolytic system
- PMID: 30746439
- PMCID: PMC6357762
- DOI: 10.1126/sciadv.aat5778
Catalyst-free, highly selective synthesis of ammonia from nitrogen and water by a plasma electrolytic system
Abstract
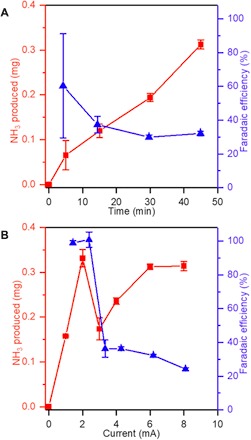
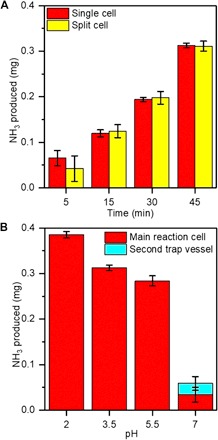
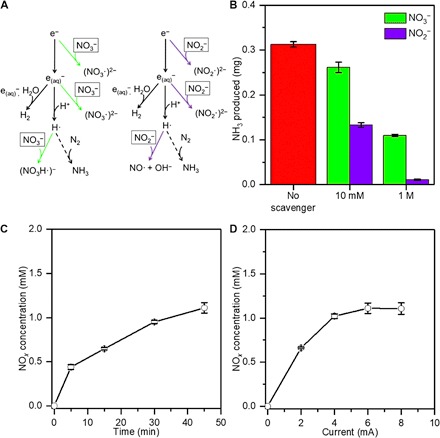
There is a growing need for scalable ammonia synthesis at ambient conditions that relies on renewable sources of energy and feedstocks to replace the Haber-Bosch process. Electrically driven approaches are an ideal strategy for the reduction of nitrogen to ammonia but, to date, have suffered from low selectivity associated with the catalyst. Here, we present a hybrid electrolytic system characterized by a gaseous plasma electrode that facilitates the study of ammonia formation in the absence of any material surface. We find record-high faradaic efficiency (up to 100%) for ammonia from nitrogen and water at atmospheric pressure and temperature with this system. Ammonia measurements under varying reaction conditions in combination with scavengers reveal that the unprecedented selectivity is achieved by solvated electrons produced at the plasma-water interface, which react favorably with protons to produce the key hydrogen radical intermediate. Our results demonstrate that limitations in selectivity can be circumvented by using catalyst-free solvated electron chemistry. In the absence of adsorption steps, the importance of controlling proton concentration and transport is also revealed.
Figures

References
-
- Erisman J. W., Sutton M. A., Galloway J., Klimont Z., Winiwarter W., How a century of ammonia synthesis changed the world. Nat. Geosci. 1, 636–639 (2008).
-
- M. Appl, Ammonia, 1. Introduction. In Ullmann’s Encyclopedia of Industrial Chemistry (Wiley-VCH Verlag GmbH, 2012).
-
- International Energy Agency, Technology Roadmap Energy and GHG reductions in the chemical industry via catalytic processes (IEA, DECHEMA, ICCA, 2013); www.iea.org/publications/freepublications/publication/TechnologyRoadmapE...
-
- Tunå P., Hulteberg C., Ahlgren S., Techno-economic assessment of nonfossil ammonia production. Environ. Prog. Sustain. Energy 33, 1290–1297 (2014).
-
- Medford A. J., Hatzell M. C., Photon-driven nitrogen fixation: Current progress, thermodynamic considerations, and future outlook. ACS Catal. 7, 2624–2643 (2017).
LinkOut - more resources
Full Text Sources
Other Literature Sources
