. 2019 Jan 11;5(1):eaau8355.
doi: 10.1126/sciadv.aau8355. eCollection 2019 Jan.

FDISCO: Advanced solvent-based clearing method for imaging whole organs

Affiliations

FDISCO: Advanced solvent-based clearing method for imaging whole organs

Yisong Qi et al. Sci Adv. .

Abstract

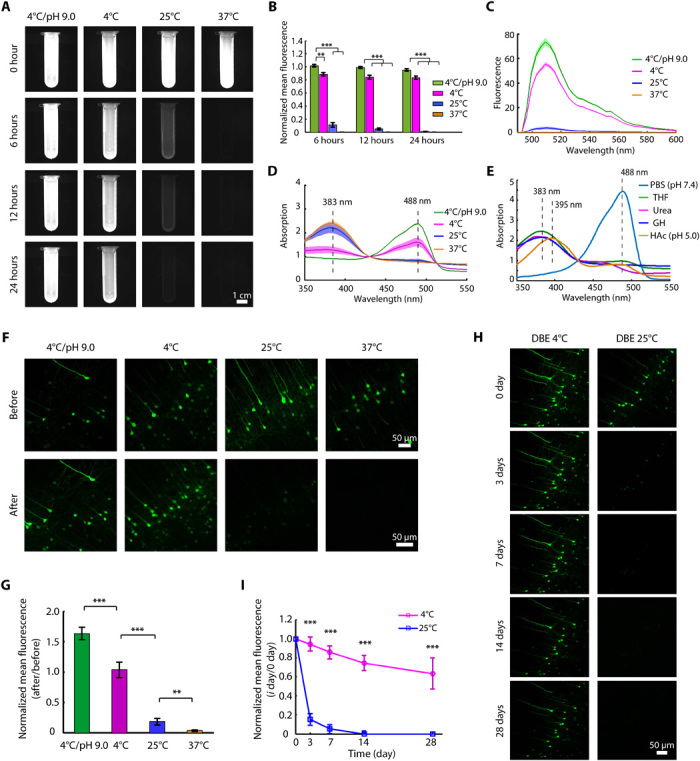
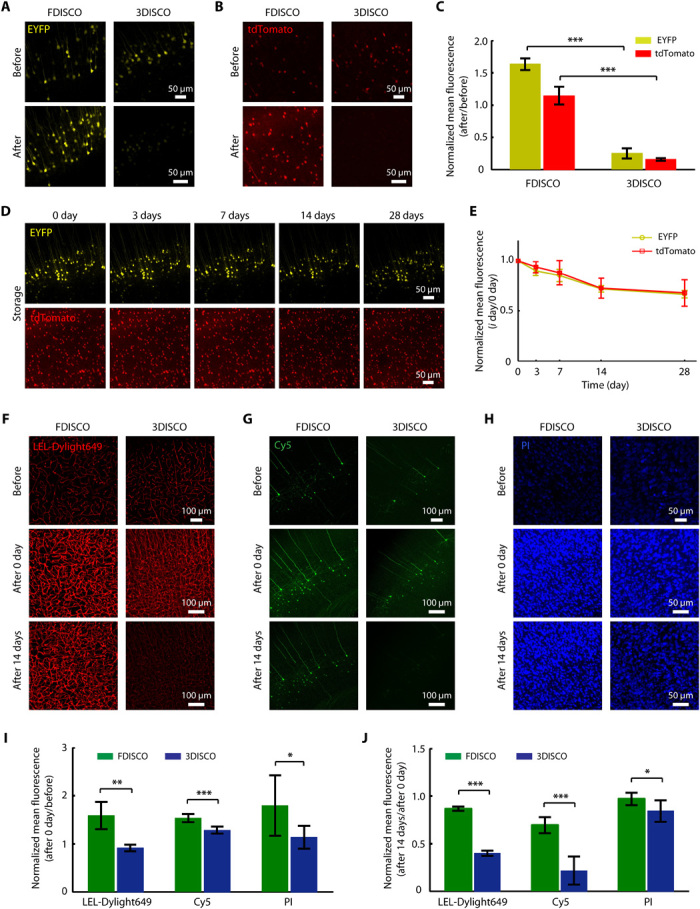
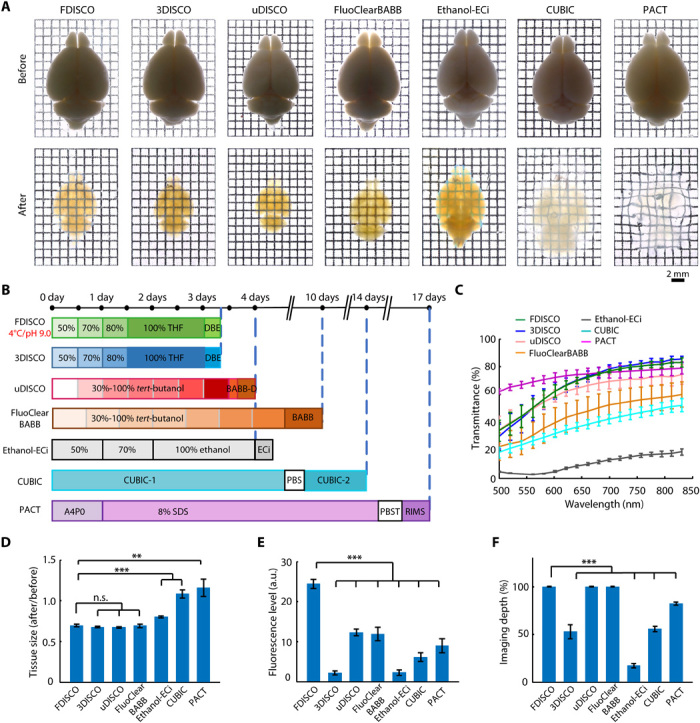
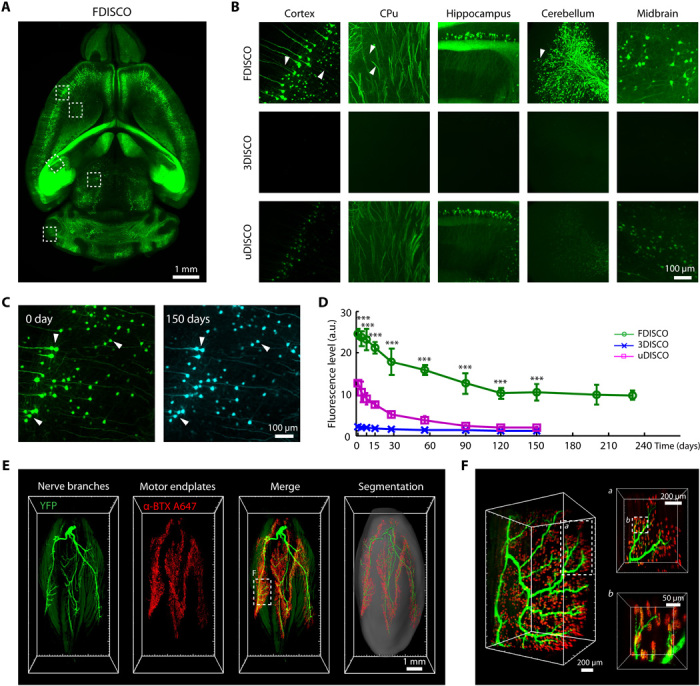
Various optical clearing methods have emerged as powerful tools for deep biological imaging. Organic solvent-based clearing methods, such as three-dimensional imaging of solvent-cleared organs (3DISCO), present the advantages of high clearing efficiency and size reduction for panoptic imaging of large samples such as whole organs and even whole bodies. However, 3DISCO results in a rapid quenching of endogenous fluorescence, which has impeded its application. Here, we propose an advanced method named FDISCO to overcome this limitation. FDISCO can effectively preserve the fluorescence of various fluorescent probes and can achieve a long storage time of months while retaining potent clearing capability. We used FDISCO for high-resolution imaging and reconstruction of neuronal and vascular networks. Moreover, FDISCO is compatible with labeling by multiple viruses and enables fine visualization of neurons with weak fluorescence labeling in the whole brain. FDISCO represents an effective alternative to the three-dimensional mapping of whole organs and can be extensively used in biomedical studies.


Figures

Fig. 1
Fig. 1. Development of FDISCO by temperature and pH adjustments.
(A) Fluorescence images of recombinant EGFP dissolved in 30% THF during 24 hours of incubation under the indicated conditions. (B) Quantification of the normalized mean fluorescence intensity in (A) (n = 3). (C and D) Emission (C) and absorption (D) spectra of EGFP/THF solutions at 24 hours (n = 3). (E) Absorption spectra of recombinant EGFP treated by various solutions. GH, guanidine hydrochloride; HAc, acetic acid. (F and G) Confocal fluorescence images (F) and normalized mean fluorescence intensity quantification (G) of EGFP before and after clearing under the indicated conditions (n = 6). (H and I) The brain slices cleared under the “4°C/pH 9.0” condition were stored in DBE at 4° and 25°C. The images (H) and quantified normalized mean fluorescence (I) over time are shown (n = 6). All confocal images are maximum intensity projections (MIPs) of z stacks (40 to 60 μm thick) from the surface of brain slices. All values are means ± SD; statistical significance in (B), (G), and (I) (**P < 0.01 and ***P < 0.001) was assessed by an independent-sample t test and one-way analysis of variance (ANOVA), followed by Bonferroni or Dunnett’s T3 post hoc test.
Fig. 2
Fig. 2. Compatibility of FDISCO with multiple FPs and chemical fluorescent tracers.
(A and B) Fluorescence images of EYFP (Thy1-YFP-H mouse) (A) and tdTomato (Sst-IRES-Cre::Ai14 mouse) (B) in 1-mm-thick brain slices before and after FDISCO clearing compared with 3DISCO clearing. (C) Fluorescence preservation quantification of EYFP and tdTomato after the clearing shown in (A) and (B). (D and E) EYFP and tdTomato images of FDISCO-cleared brain slices over time (D) and quantification data (E). (F to H) Fluorescence images of the following chemical fluorescent tracers after the clearing and storage procedures for FDISCO and 3DISCO: LEL-Dylight649 (F), antibody conjugated to Cy5 (G), and PI (H). (I and J) Quantification of the fluorescence preservation after clearing (I) and 14-day storage (G). All confocal images are MIPs of z stacks (40 to 60 μm thick) from the surface of slices. All values are means ± SD (n = 6); statistical significance in (C), (I), and (J) (*P < 0.05, **P < 0.01, and ***P < 0.001) was assessed by an independent-sample t test.
Fig. 3
Fig. 3. Comparison of the whole-brain clearing performance of FDISCO and other clearing methods.
(A) Bright-field images of adult whole brains cleared with FDISCO, 3DISCO, uDISCO, FluoClearBABB, Ethanol-ECi, CUBIC, and PACT. (B) Whole-brain clearing protocol timeline. RIMS, refractive index matching solution. (C) Transmittance curves of the brain samples cleared with different clearing methods. (D) Linear expansion and shrinkage of whole brains during optical clearing. (E and F) Quantification of the fluorescence level in the cortex (E) and imaging depth of whole brains (F) cleared with different clearing methods, as assessed by LSFM imaging. All values are means ± SD (n = 5); the statistical significance in (D) to (F) (n.s., not significant, P > 0.05; **P < 0.01; and ***P < 0.001) was assessed by one-way ANOVA followed by Bonferroni or Dunnett’s T3 post hoc test. a.u., arbitrary units.
Fig. 4
Fig. 4. LSFM imaging of neural structures in the mouse brain and gastrocnemius muscle after FDISCO clearing.
(A) Image of the whole brain (Thy1-GFP-M) cleared by FDISCO. (B) Comparison of the high-magnification images of the cleared brains assessed immediately after FDISCO, 3DISCO, and uDISCO clearing. The white arrowheads mark the tiny nerve fibers detected. For different clearing methods, the same imaging parameters and image processing methods were used for the same regions. (C) Images of cortical neurons in the FDISCO-cleared brain taken at 0 and 150 days after clearing, respectively. The neurons (e.g., white arrowheads) could still be viewed well after 150 days. (D) Fluorescence level quantification of cleared brains over time after FDISCO, 3DISCO, and uDISCO clearing (n = 4, 3, and 3, respectively). (E) 3D reconstruction and segmentation of nerve branches (green) and motor endplates (red) of the gastrocnemius muscle (Thy1-YFP-16) cleared by FDISCO. (F) High-magnification images of the dashed boxed region in (E). The images in (A) to (C) are the MIPs of 100-μm-thick z stacks. Values are means ± SD; the statistical significance in (D) (***P < 0.001) was assessed by one-way ANOVA, followed by the Bonferroni post hoc test.
Fig. 5
Fig. 5. 3D visualization of the vasculature in the mouse brain and kidney after FDISCO clearing.
The vasculature was labeled by injection of CD31-A647 antibody. (A) 3D reconstruction of the vasculature in the whole brain after FDISCO clearing and LSFM imaging. (B to E) The details of blood vessels in the hippocampus (B) and cortex (C) are shown. High-magnification views of the dashed boxed regions in (B) and (C) are shown in (D) and (E), respectively. (F) 3D reconstruction of blood vessels and glomeruli in the kidney. The number of glomeruli was counted as 15,470 by Imaris software. (G) Images at gradient depth. The glomeruli were mainly distributed in the renal cortex. (H and I) High-magnification views of the dashed boxed regions in (G).
Fig. 6
Fig. 6. 3D visualization of the RV-labeled neurons projecting to the VTA through the whole brain by FDISCO clearing.
(A to C) Distribution of DsRed-positive cells in the whole brain [horizontal (A), sagittal (B), and coronal (C)]. The injection site in the VTA in the right hemisphere is marked in (A). Most regions projected to the VTA are marked in (B). (D to H) Several regions of RV-DsRed–positive cells are shown. Acb, accumbens nucleus; VP, ventral pallidum; SC, superior colliculus; BNST, bed nucleus of the stria terminalis; LDTg, laterodorsal tegmental nucleus; LH, lateral hypothalamic area; LHb/MHb, lateral/medial habenular nucleus; PPTg, pedunculopontine tegmental nucleus.

References

    1. Miyamichi K., Amat F., Moussavi F., Wang C., Wickersham I., Wall N. R., Taniguchi H., Tasic B., Huang Z. J., He Z., Callaway E. M., Horowitz M. A., Luo L., Cortical representations of olfactory input by trans-synaptic tracing. Nature 472, 191–196 (2011). - PMC - PubMed
    1. Zingg B., Hintiryan H., Gou L., Song M. Y., Bay M., Bienkowski M. S., Foster N. N., Yamashita S., Bowman I., Toga A. W., Dong H.-W., Neural networks of the mouse neocortex. Cell 156, 1096–1111 (2014). - PMC - PubMed
    1. Oh S. W., Harris J. A., Ng L., Winslow B., Cain N., Mihalas S., Wang Q., Lau C., Kuan L., Henry A. M., Mortrud M. T., Ouellette B., Nguyen T. N., Sorensen S. A., Slaughterbeck C. R., Wakeman W., Li Y., Feng D., Ho A., Nicholas E., Hirokawa K. E., Bohn P., Joines K. M., Peng H., Hawrylycz M. J., Phillips J. W., Hohmann J. G., Wohnoutka P., Gerfen C. R., Koch C., Bernard A., Dang C., Jones A. R., Zeng H., A mesoscale connectome of the mouse brain. Nature 508, 207–214 (2014). - PMC - PubMed
    1. Ragan T., Kadiri L. R., Venkataraju K. U., Bahlmann K., Sutin J., Taranda J., Arganda-Carreras I., Kim Y., Seung H. S., Osten P., Serial two-photon tomography for automated ex vivo mouse brain imaging. Nat. Methods 9, 255–258 (2012). - PMC - PubMed
    1. Kasthuri N., Hayworth K. J., Berger D. R., Schalek R. L., Conchello J. A., Knowles-Barley S., Lee D., Vázquez-Reina A., Kaynig V., Jones T. R., Roberts M., Morgan J. L., Tapia J. C., Seung H. S., Roncal W. G., Vogelstein J. T., Burns R., Sussman D. L., Priebe C. E., Pfister H., Lichtman J. W., Saturated reconstruction of a volume of neocortex. Cell 162, 648–661 (2015). - PubMed

Publication types

LinkOut - more resources