. 2019 Jan 3;3(2):446-467.
doi: 10.1210/js.2018-00219. eCollection 2019 Feb 1.

A Mitochondrial Progesterone Receptor Increases Cardiac Beta-Oxidation and Remodeling

Affiliations

A Mitochondrial Progesterone Receptor Increases Cardiac Beta-Oxidation and Remodeling

Qunsheng Dai et al. J Endocr Soc. .

Abstract

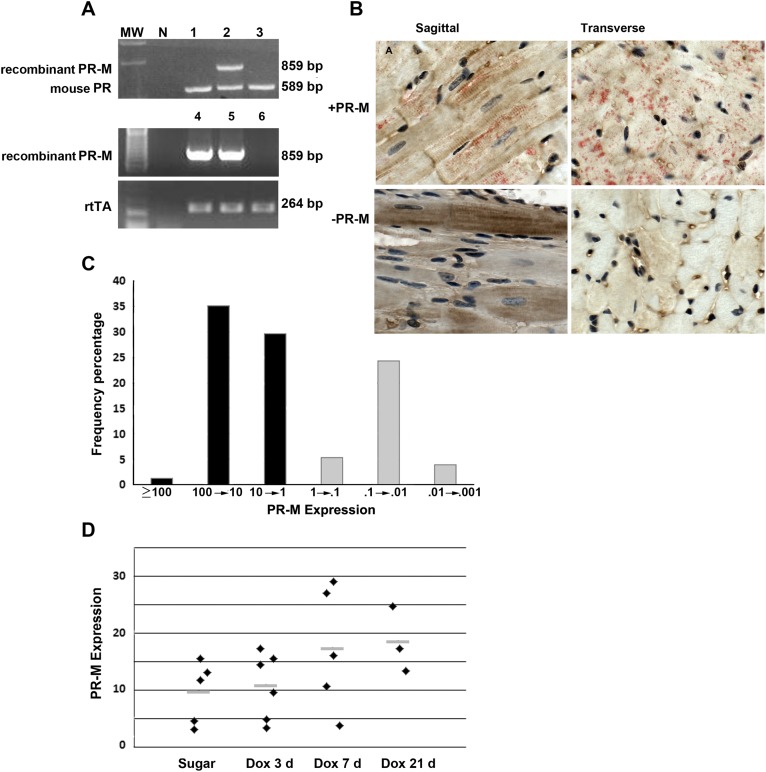
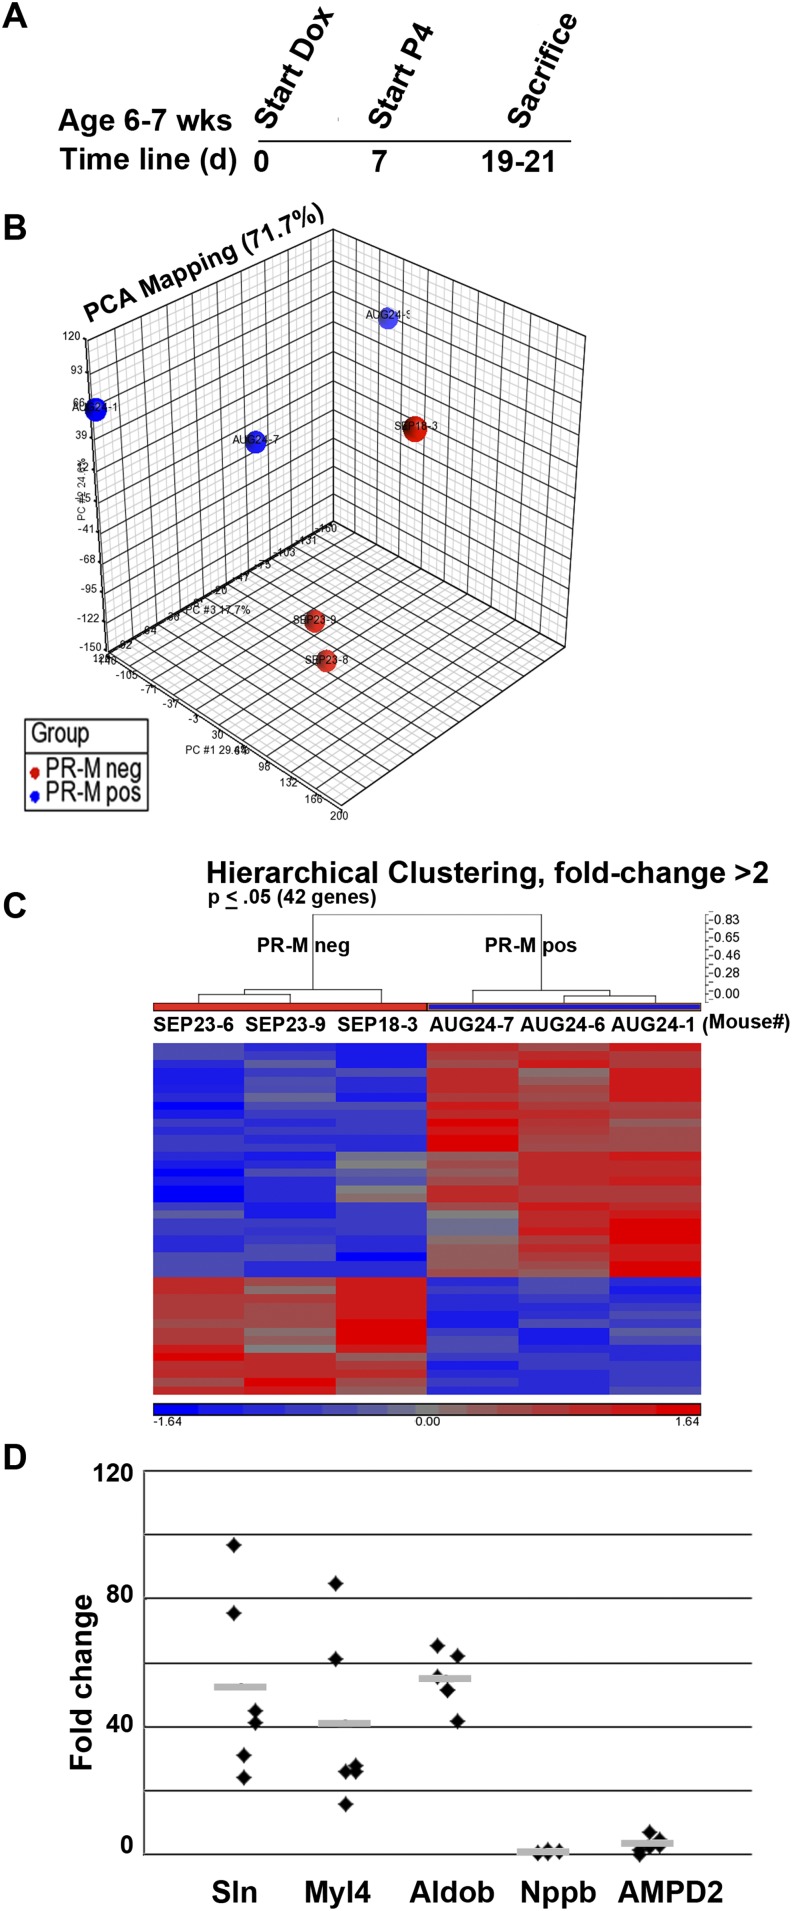
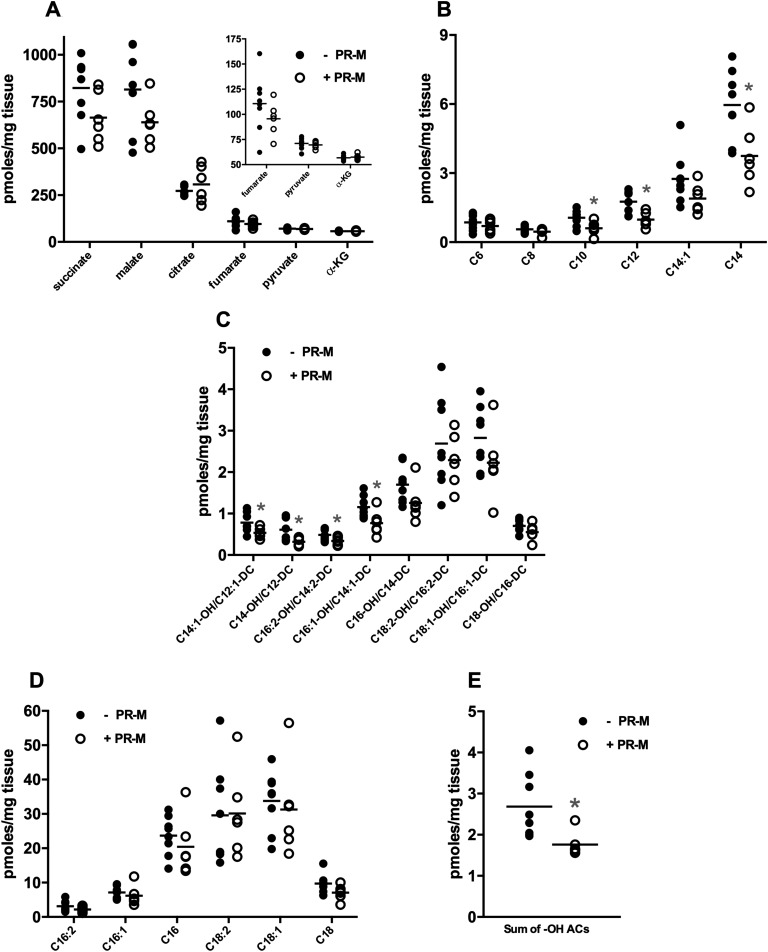
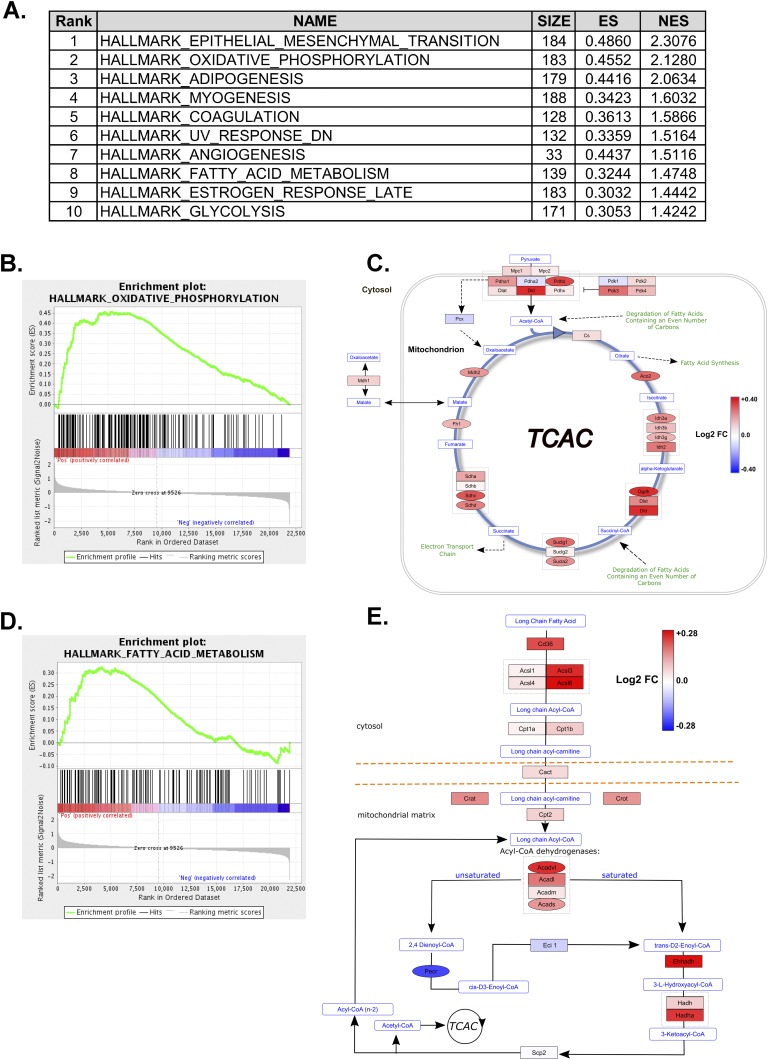
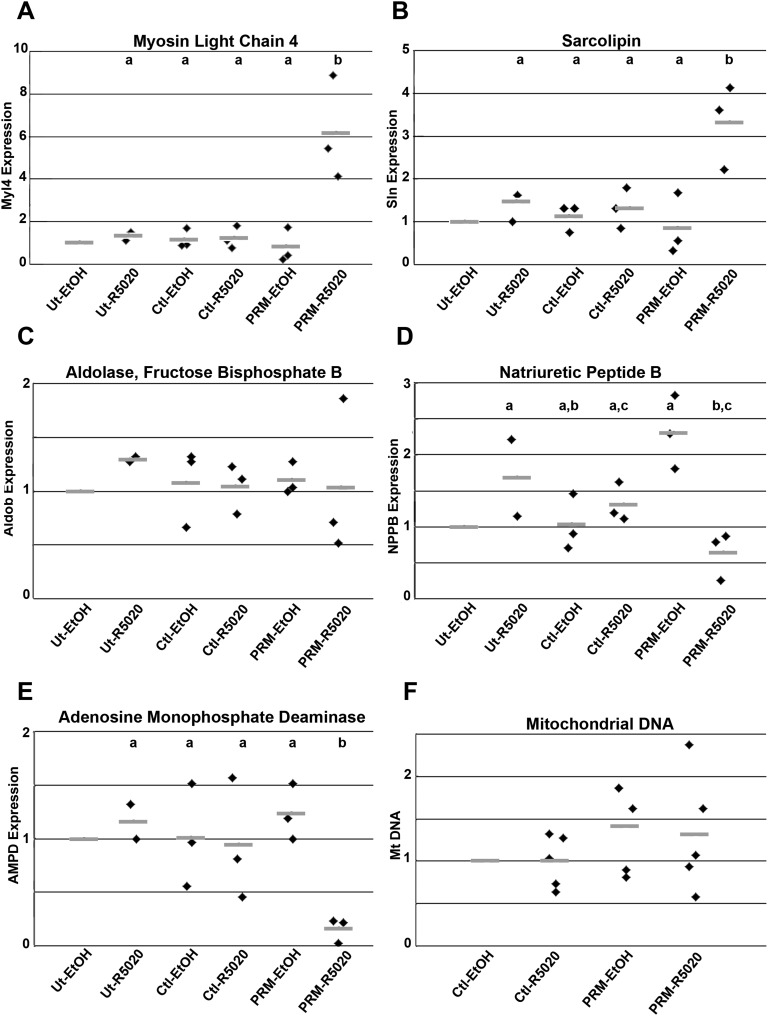
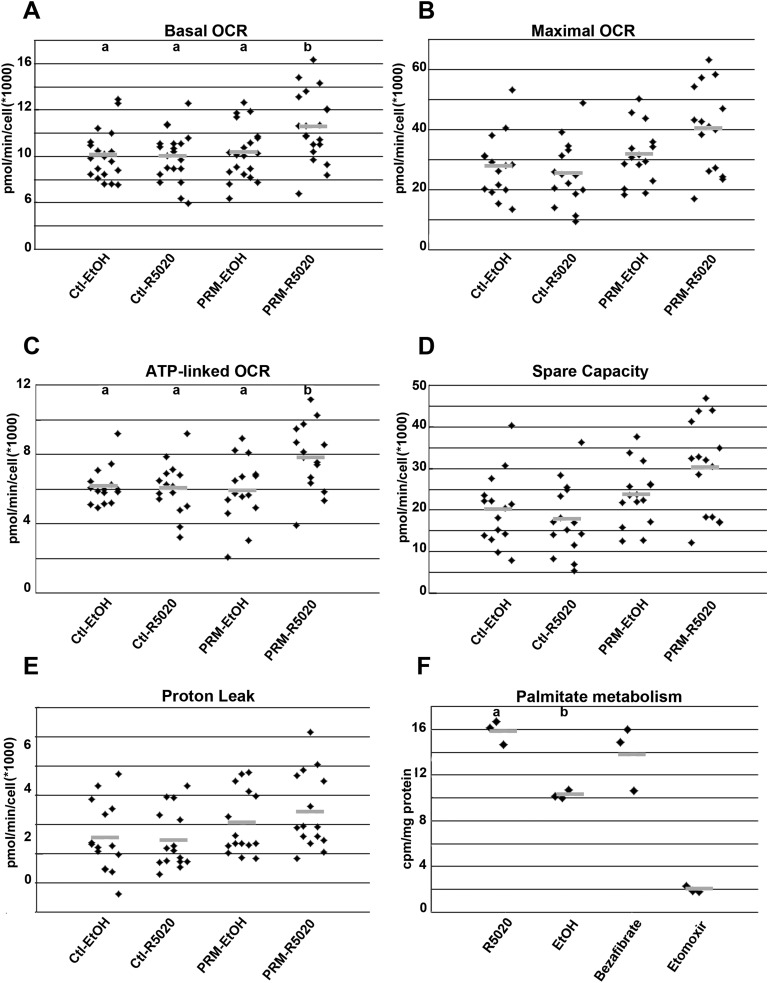
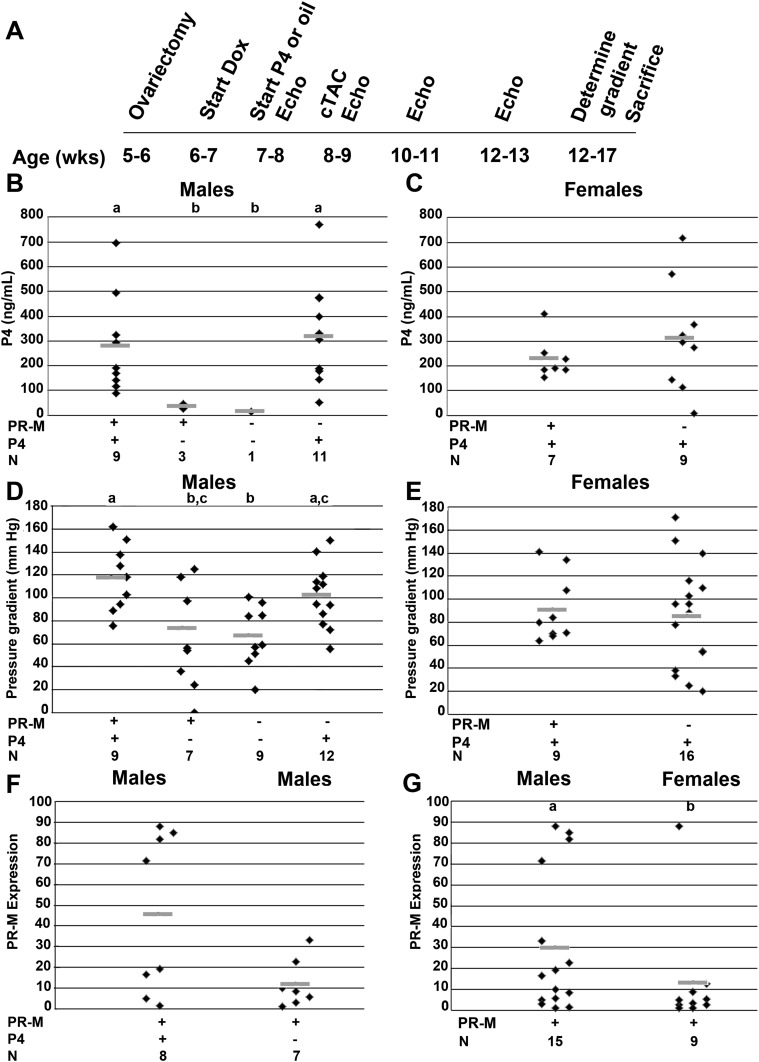
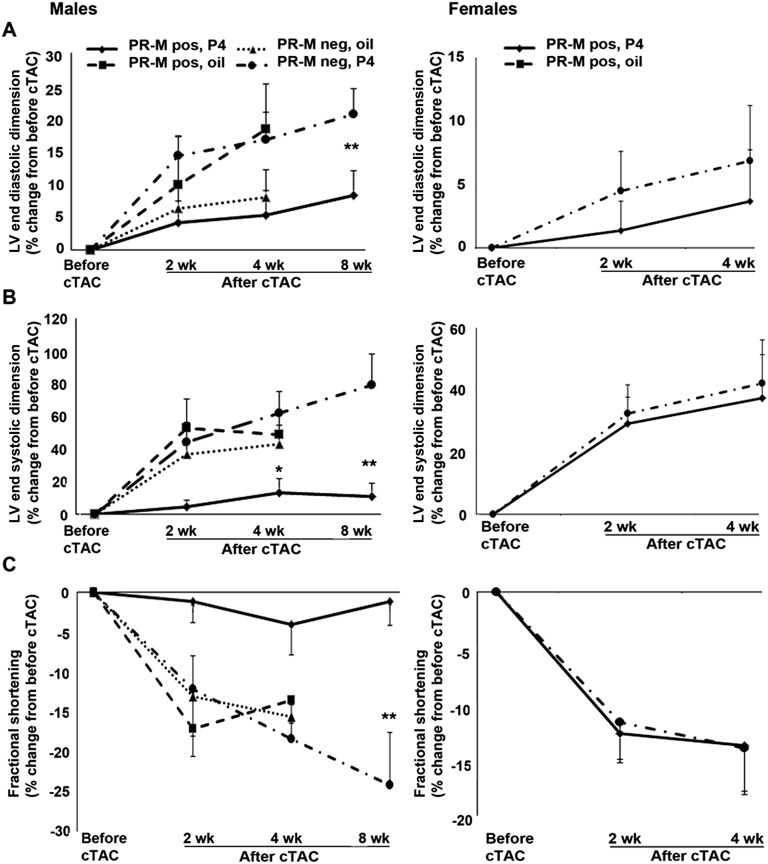
Progesterone is primarily a pregnancy-related hormone, produced in substantial quantities after ovulation and during gestation. Traditionally known to function via nuclear receptors for transcriptional regulation, there is also evidence of nonnuclear action. A previously identified mitochondrial progesterone receptor (PR-M) increases cellular respiration in cell models. In these studies, we demonstrated that expression of PR-M in rat H9c2 cardiomyocytes resulted in a ligand-dependent increase in oxidative cellular respiration and beta-oxidation. Cardiac expression in a TET-On transgenic mouse resulted in gene expression of myofibril proteins for remodeling and proteins involved in oxidative phosphorylation and fatty acid metabolism. In a model of increased afterload from constant transverse aortic constriction, mice expressing PR-M showed a ligand-dependent preservation of cardiac function. From these observations, we propose that PR-M is responsible for progesterone-induced increases in cellular energy production and cardiac remodeling to meet the physiological demands of pregnancy.

Keywords: beta-oxidation; mitochondria; pregnancy; progesterone; respiratory chain.


Figures

Figure 1.
Figure 1.
Expression of human PR-M. (A) Genotype results of PR-M–expressing mice prior to crossbreeding with rtTA mice (top). (B) IHC staining of cardiac tissue from a mouse expressing PR-M (+PR-M) and a mouse not expressing PR-M (−PR-M) showing red staining with the C19 PR antibody and brown with the mitochondrial protein antibody. (C) Cardiac PR-M expression as determined by SYBR Green real-time RT-PCR in all genotype double-positive mice. Positive expression was considered a value of >1. (D) Cardiac PR-M expression increased with exposure time to Dox, but the system was leaky with low levels of transcripts present without Dox exposure. No significant difference was seen among the four groups, but a significant difference was seen with pooling of the sugar and day 3 Dox compared with the pooled groups of day 7 and day 21 Dox groups (P = 0.012). Results are expressed as scatter plot with bar as mean. MW, molecular weight.
Figure 2.
Figure 2.
Microarray comparison of male mice expressing PR-M and mice not expressing PR-M treated with progesterone. (A) Shows the treatment protocol. (B) Shows separation of the two groups by principal component analysis (PCA). The hierarchical clustering heat map in (C) shows the majority of genes were upregulated in PR-M–expressing mice. (D) Expression of five genes (Mly4, Sln, Aldob, Nppb, and AMPD2) was verified with real-time RT-PCR. Only Ampd2 was discordant, showing a 2.4-fold downregulation on microarray but a 2.95-fold upregulation with real-time RT-PCR. Fold change values are mean ± SEM.
Figure 3.
Figure 3.
PR-M–expressing mouse hearts show diminished levels of medium- and hydroxylated long-chain acylcarnitines. Targeted metabolic profiling was conducted on flash-frozen ventricular tissue harvested from male mice. (A) Organic acids, (B) medium-chain acylcarnitines, (C) long-chain acylcarnitines, (D) hydroxylated acylcarnitines, and (E) sum of -OH acylcarnitines (ACs) chain length C8–C14. Results are expressed as scatter plot with bar as mean. N = 6–8 mice/genotype. *P < 0.05 vs PR-M–nonexpressing mice. α-KG, α-ketoglutarate.
Figure 4.
Figure 4.
PR-M expression enriches for genes involved in mitochondrial metabolism. GSEA was performed using GenePattern software and Hallmark Gene Sets from the Molecular Signatures Database. (A) Top 10 enriched gene sets enriched in PR-M–expressing mice. (B and D) Enrichment plots of oxidative phosphorylation and fatty acid metabolism gene sets. (C and E) Pathway visualization of microarray expression data overlaid onto Wikipathways metabolic maps. Coloring of nodes represents log twofold change according to the scales in each figure. Shape of nodes represents uncorrected feature P values <0.05 (ovals) or >0.05 (rectangles).
Figure 5.
Figure 5.
Mly4, Sln, Aldob, Nppb, and AMPD2 expression in H9c2 cells transfected with PR-M. Cells expressing PR-M treated with 10−6 M ligand R5020 (PRM-R5020) for 48 h showed increased expression of (A) Mly4 and (B) Sln compared with untransfected cells treated with R5020 (Ut-R5020), control plasmid–transfected cells treated with vehicle (Ctl-EtOH), control plasmid cells treated with R5020 (Ctl-R5020), and PRM-expressing plasmid treated with vehicle (PRM-EtOH). PRM-R5020 cells showed no difference in (C) Aldob expression, but decreased expression of (D) Nppb and (E) AMPD2. For ΔΔCt determination, rat GAPDH was used as the housekeeping gene and Ut-EtOH as the control condition. (F) With the same treatment, no change was seen in mitochondrial quantity as determined by mitochondrial DNA (Mt DNA) using SYBR Green PCR. Nuclear DNA amplification was used as the reference and Ctl-EtOH as the control condition. Results are expressed in scatter plots with bar as mean. Treatments with different lettered superscripts are statistically different.
Figure 6.
Figure 6.
OCR and fatty acid oxidation in H9c2 cells expressing PR-M. Cells expressing PR-M treated with 10−6 M ligand R5020 (PRM-R5020) for 48 h showed increased (A) basal OCR and (C) ATP-linked OCR, whereas (B) maximum OCR and (D) spare capacity approached significance (P = 0.06). (E) There was no difference in proton leak. (F) With the same treatment, cells expressing PR-M showed increased oxidation of tritiated palmitate, with a positive control of bezafibrate and a negative control of etomoxir. Comparison treatments included control plasmid–transfected cells treated with vehicle (Ctl-EtOH), control plasmid cells treated with R5020 (Ctl-R5020), and PRM-expressing plasmid treated with vehicle (PRM-EtOH). Results are expressed in scatter plots with bar as mean. Treatments with different lettered superscripts are statistically different. cpm, counts per min.
Figure 7.
Figure 7.
Study protocol for cTAC. (A) The timeline for male and female mice undergoing cTAC. (B and C) Blood progesterone levels in the treated male and female mice were supraphysiologic and not significantly different. (D and E) Transstenosis gradient was greater in the male mice expressing PR-M treated with progesterone compared with PR-M–expressing mice receiving vehicle (P = 0.039) and compared with nonexpressing mice receiving vehicle (P = 0.007). (F and G) PR-M expression levels were greater in male mice expressing PR-M treated with progesterone compared with male mice expressing PR-M treated with vehicle. PR-M expression levels trended higher in males compared with females (P = 0.07). Groups with different lettered superscripts are significantly different. N represents the number of animals analyzed in each group. Results are expressed in scatter plots with bar as mean. Echo, echocardiogram.
Figure 8.
Figure 8.
Percent change in echocardiographic parameters of (A) LVDd, (B) LVDs, and (C) %FS prior to and after cTAC. Male mice expressing PR-M treated with progesterone showed a lower LVDs at 4 wk after cTAC of borderline significance compared with nonexpressing mice treated with progesterone. A subset of male mice expressing PR-M treated with progesterone and nonexpressing mice treated with progesterone, observed at 8 wk after cTAC, showed more dramatic differences in parameters. No differences were seen in ovariectomized females expressing PR-M treated with progesterone compared with ovariectomized females not expressing PR-M treated with progesterone. Values are expressed as mean ± SEM. Number of mice are detailed in Supplemental Table 4 [9]. *P = 0.056; **LVDd, P = 0.042; LVDs, P = 0.007; and %FS, P = 0.008. LV, left ventricular.

References

    1. Ouzounian JG, Elkayam U. Physiologic changes during normal pregnancy and delivery. Cardiol Clin. 2012;30(3):317–329. - PubMed
    1. Foryst-Ludwig A, Kintscher U. Sex differences in exercise-induced cardiac hypertrophy. Pflugers Arch. 2013;465(5):731–737. - PubMed
    1. Melchiorre K, Sutherland GR, Liberati M, Thilaganathan B. Preeclampsia is associated with persistent postpartum cardiovascular impairment. Hypertension. 2011;58(4):709–715. - PubMed
    1. Demakis JG, Rahimtoola SH, Sutton GC, Meadows WR, Szanto PB, Tobin JR, Gunnar RM. Natural course of peripartum cardiomyopathy. Circulation. 1971;44(6):1053–1061. - PubMed
    1. Lopaschuk GD, Kelly DP. Signalling in cardiac metabolism. Cardiovasc Res. 2008;79(2):205–207. - PubMed