. 2019 Feb 12:8:e40811.
doi: 10.7554/eLife.40811.

Overriding FUS autoregulation in mice triggers gain-of-toxic dysfunctions in RNA metabolism and autophagy-lysosome axis

Affiliations

Overriding FUS autoregulation in mice triggers gain-of-toxic dysfunctions in RNA metabolism and autophagy-lysosome axis

Shuo-Chien Ling et al. Elife. .

Abstract

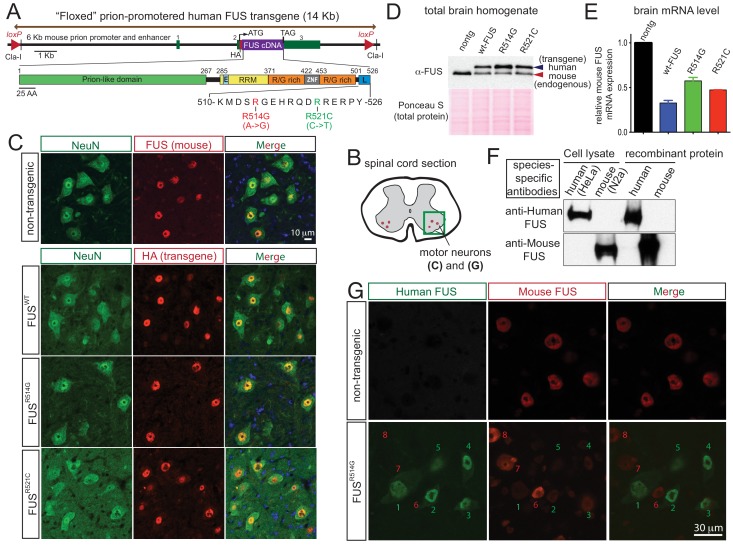
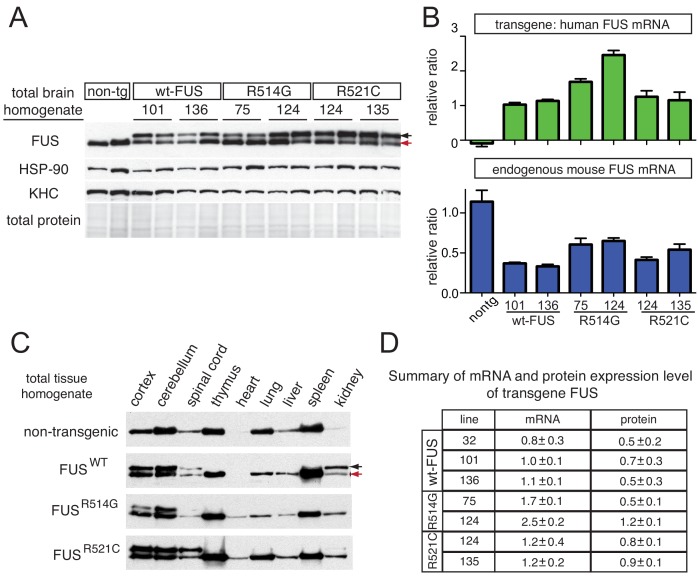
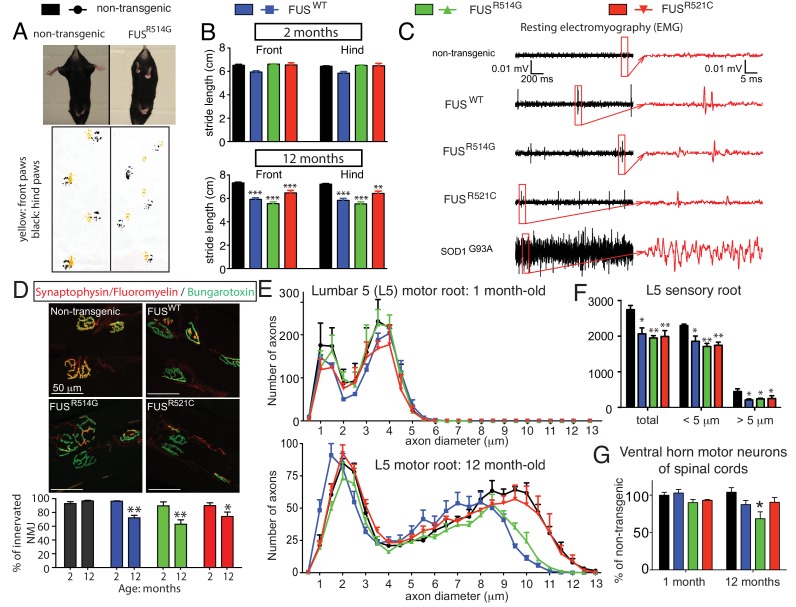
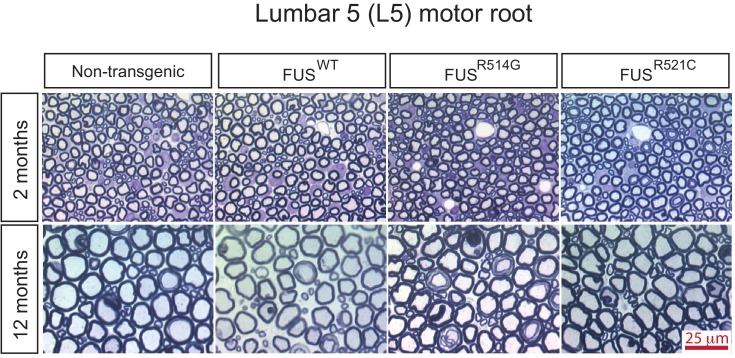
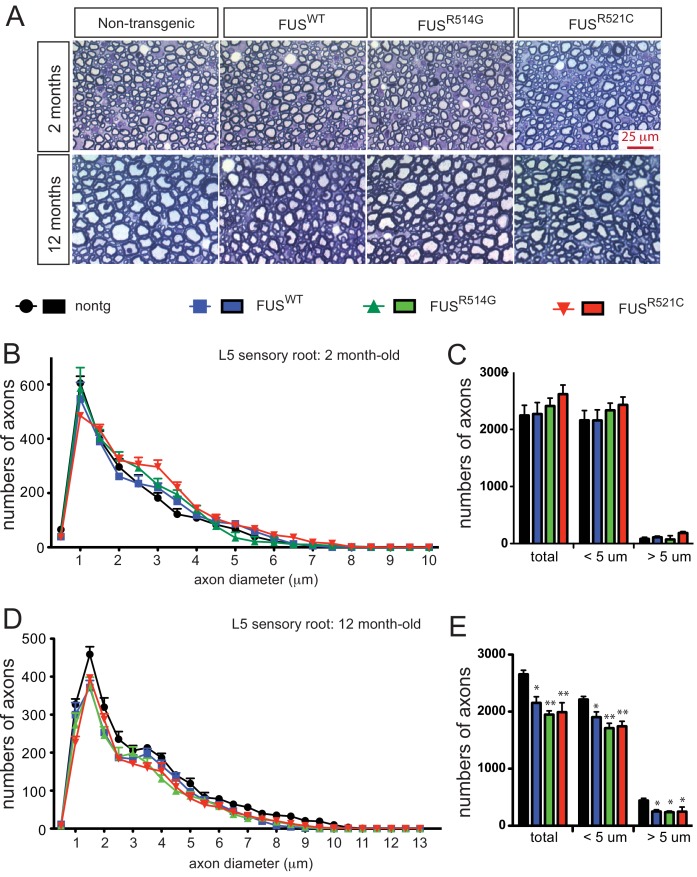
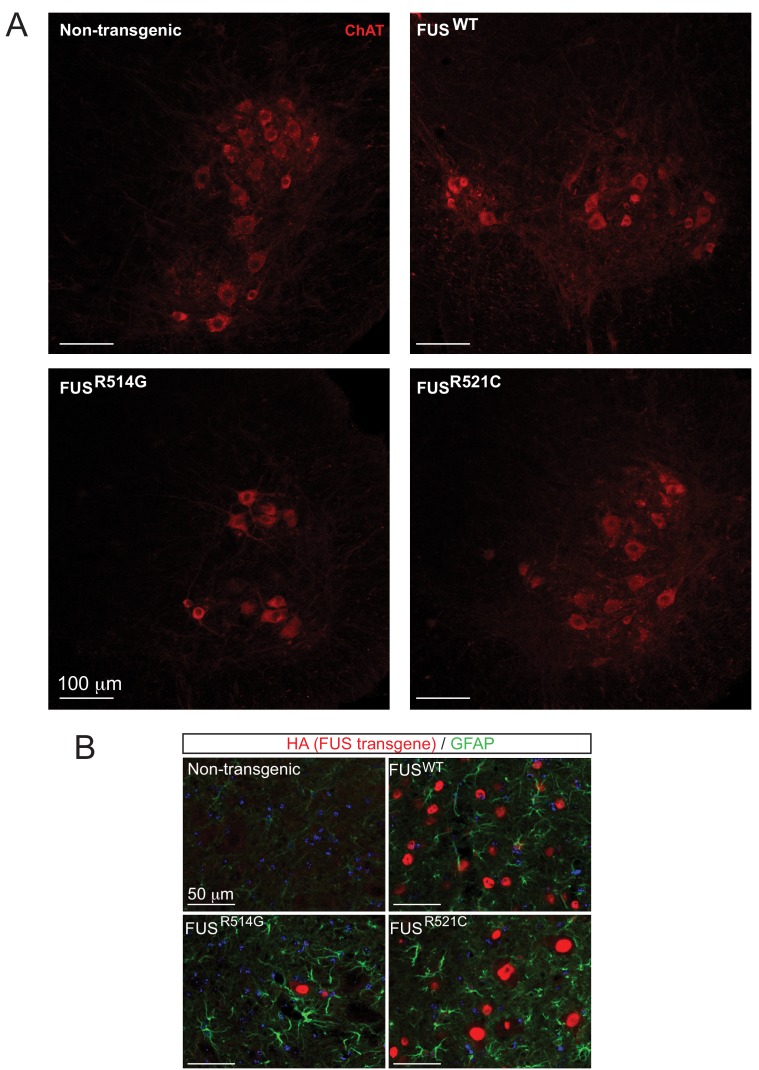
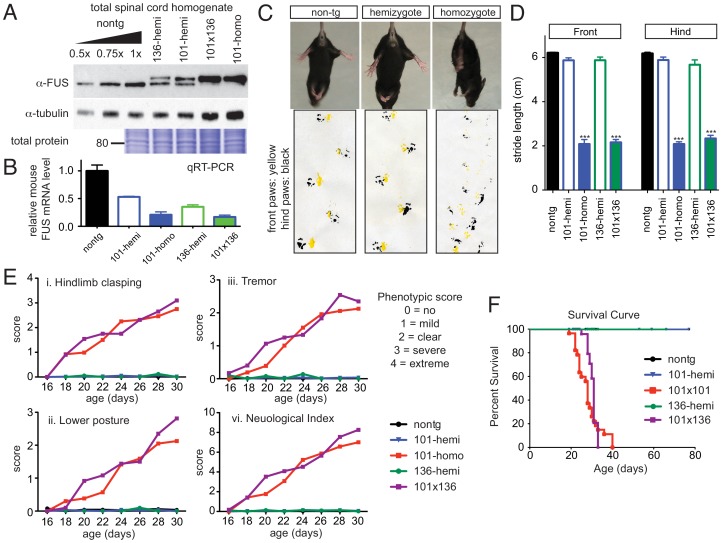
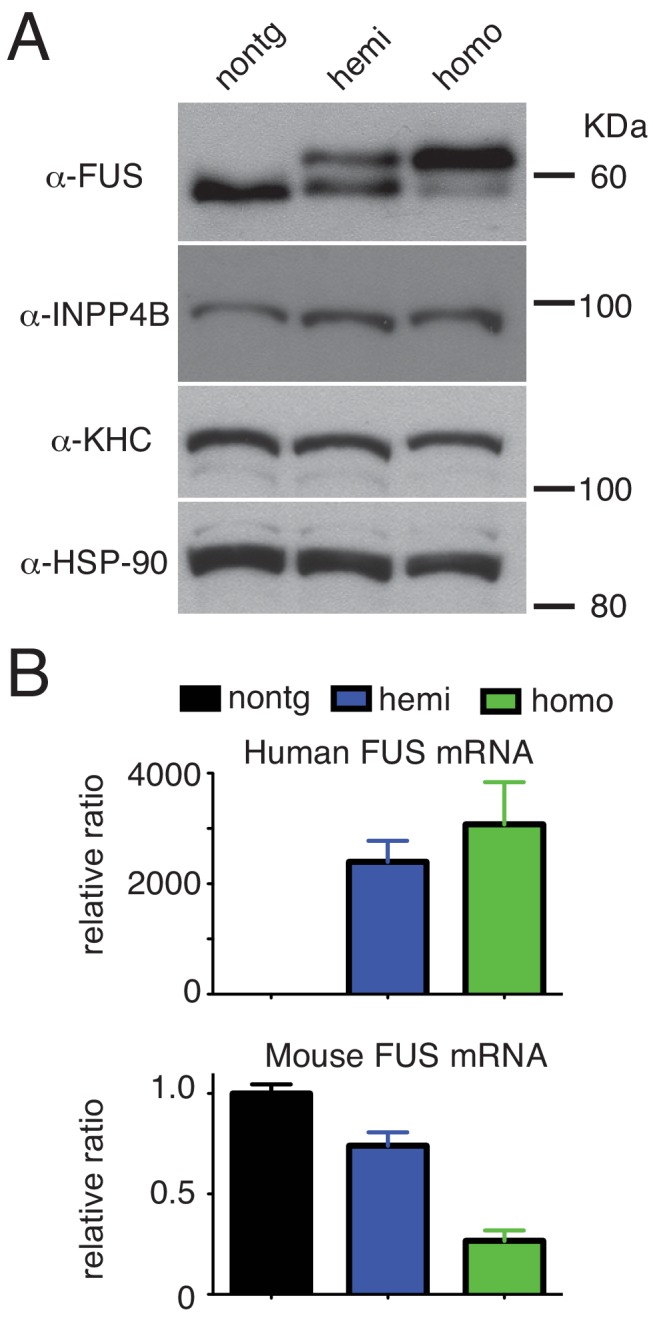
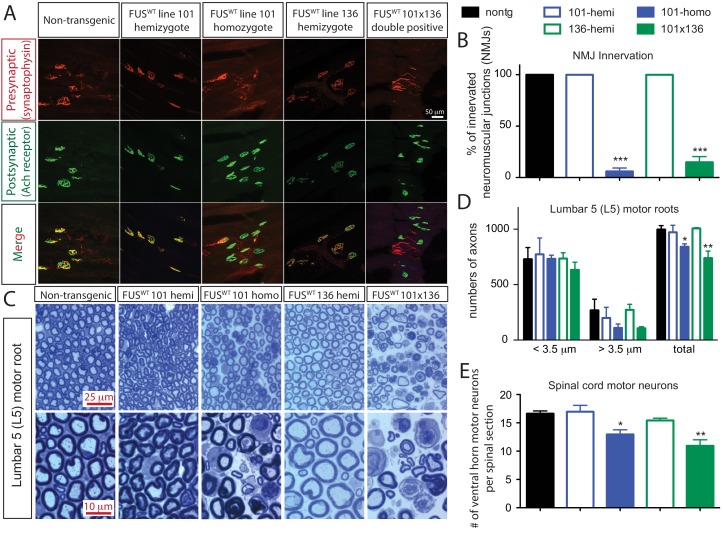
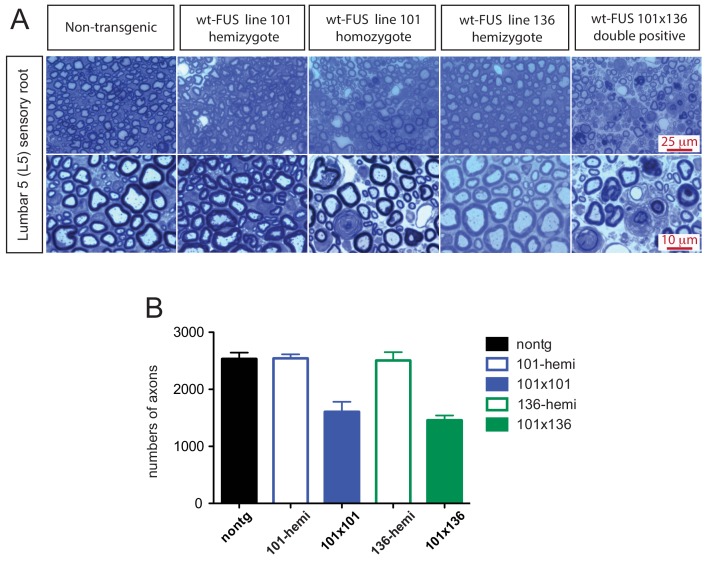
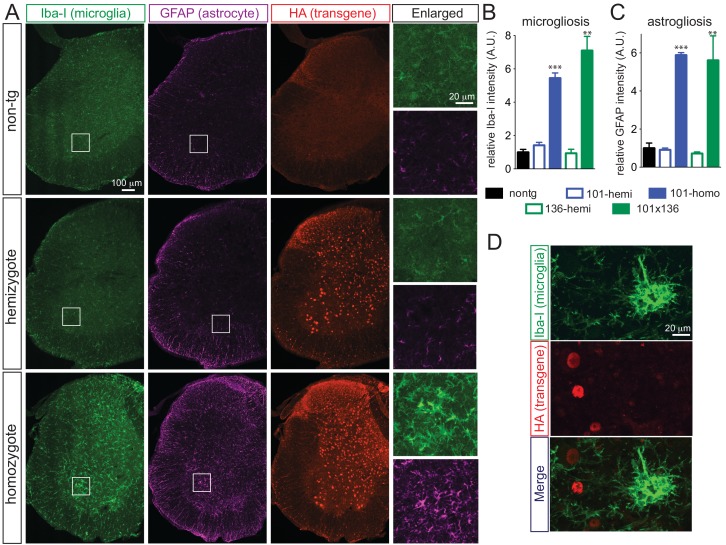
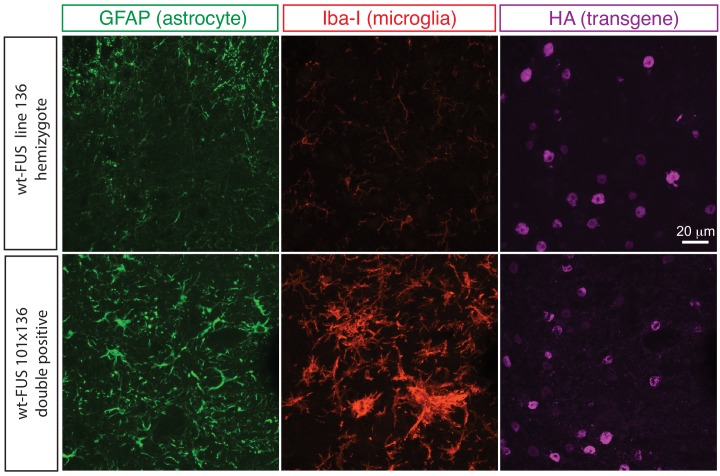
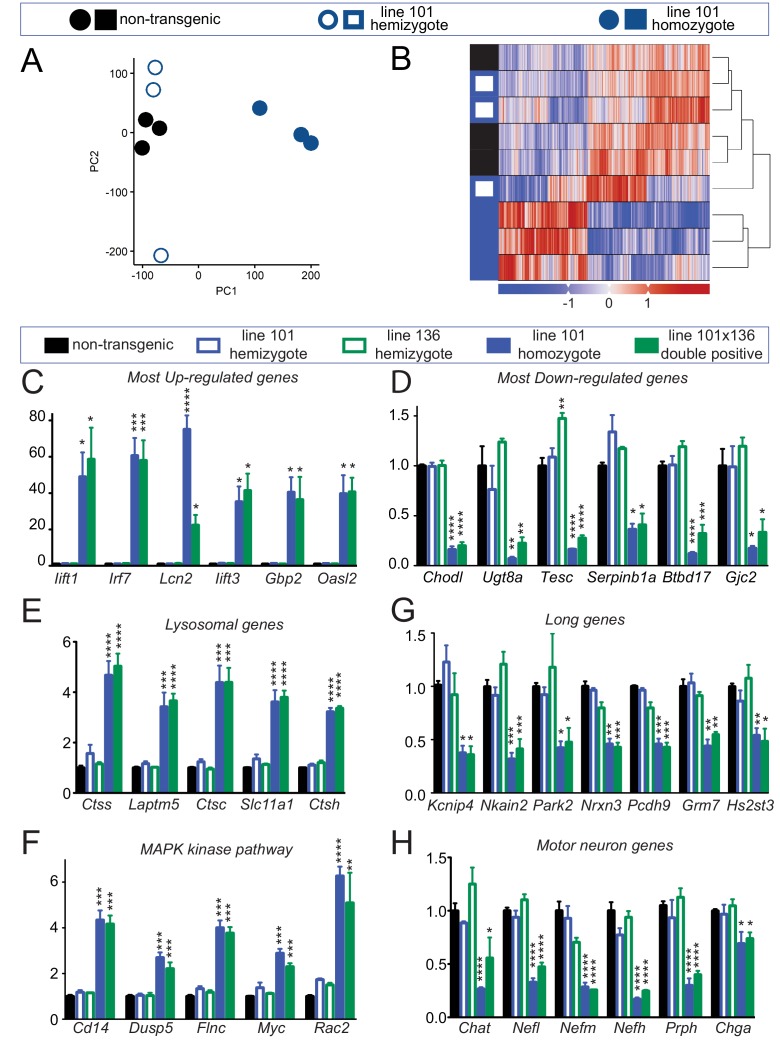
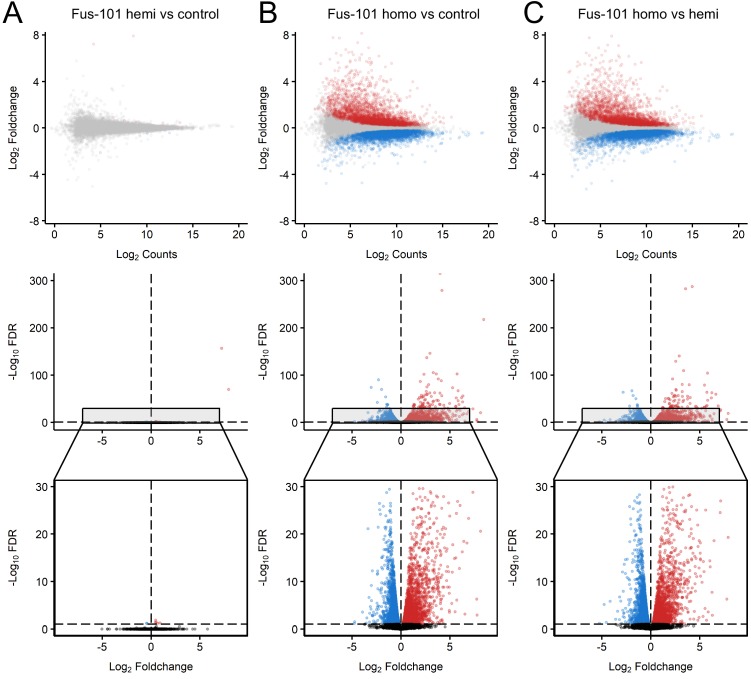
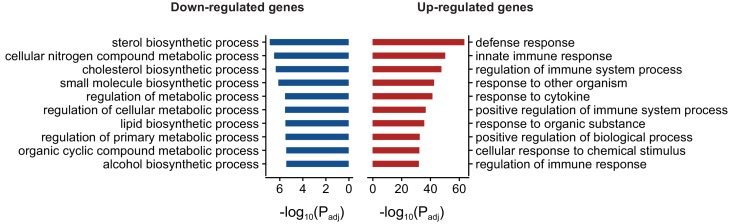
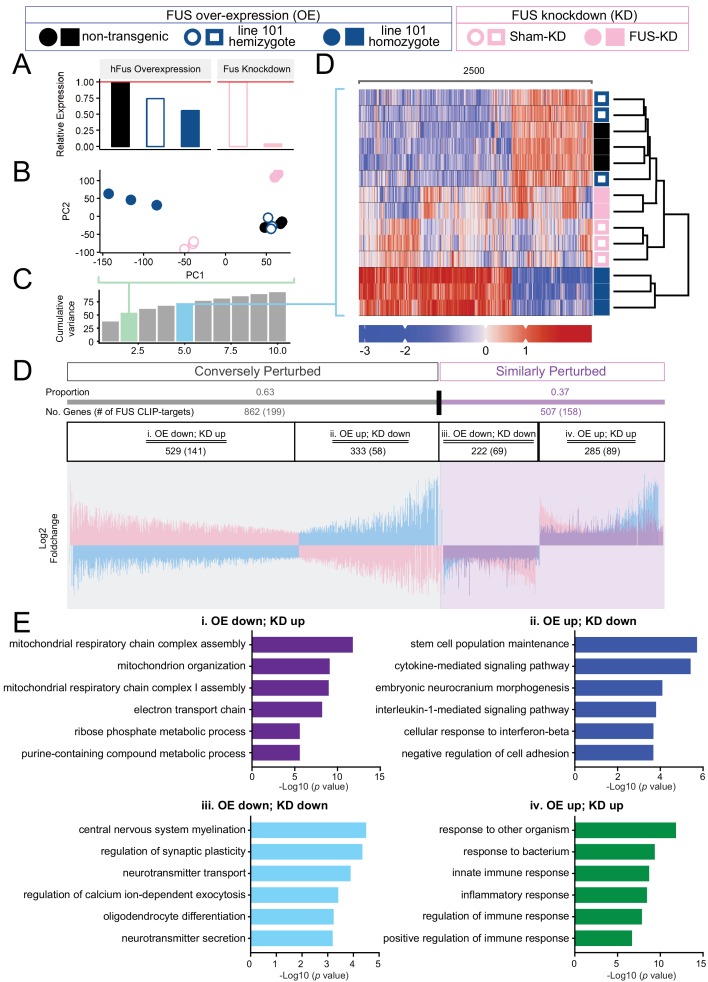
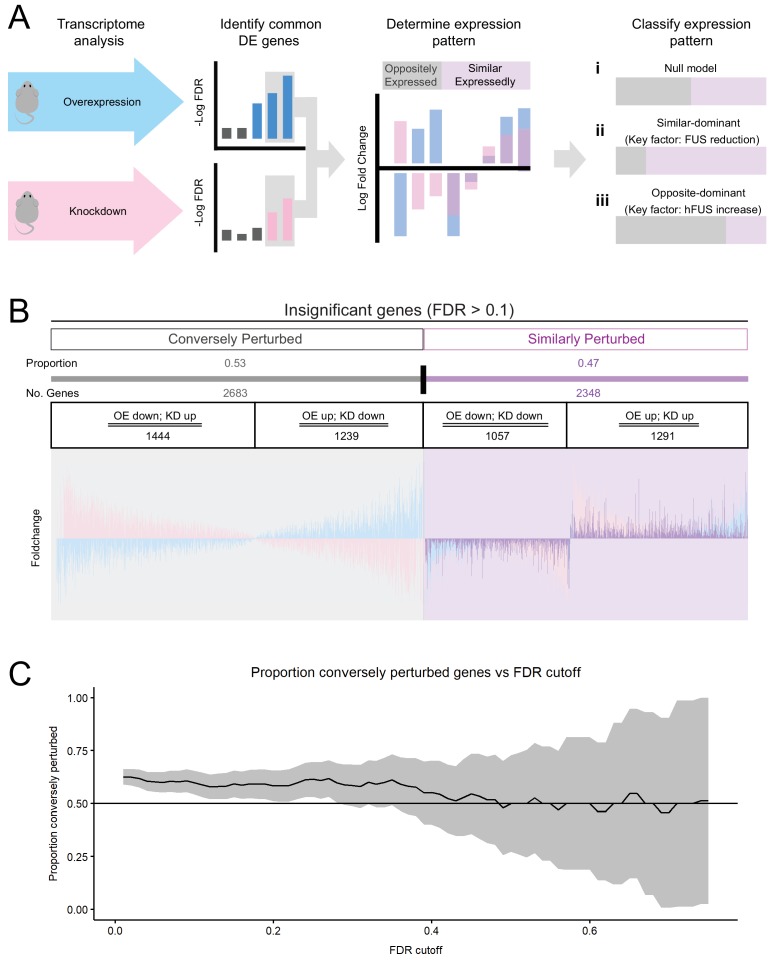
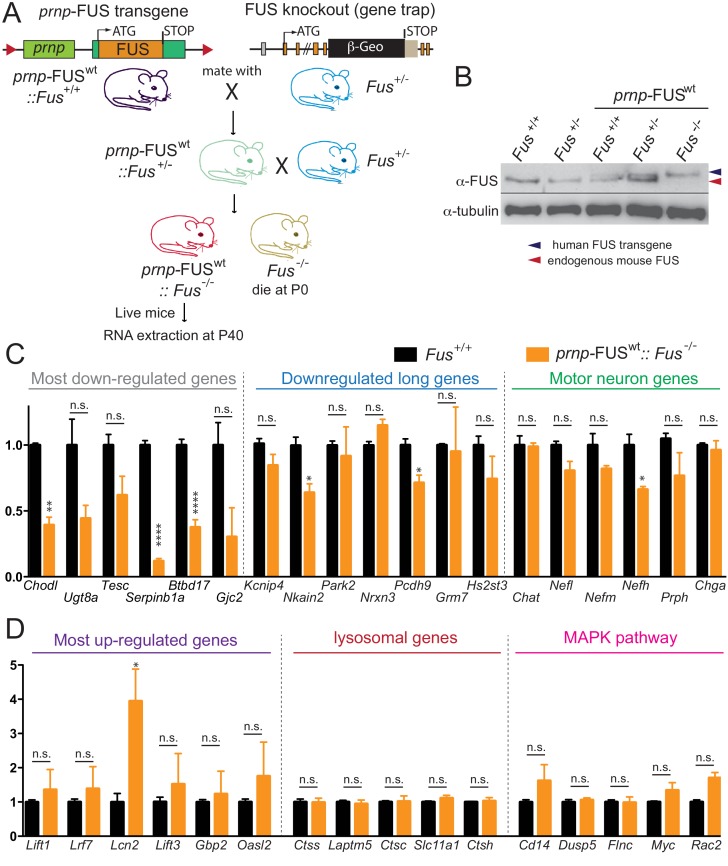
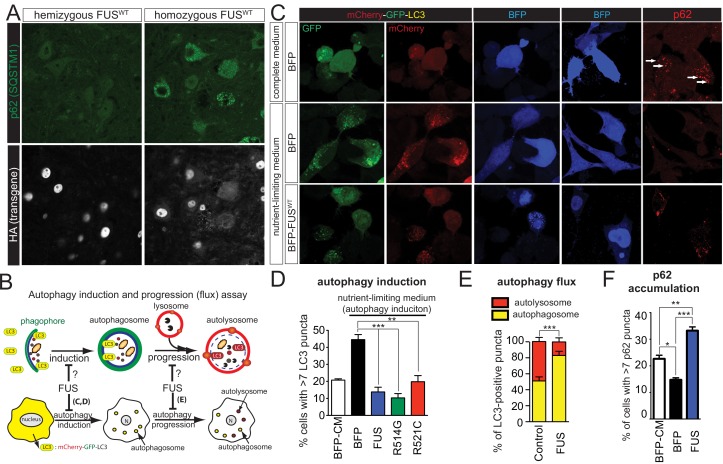
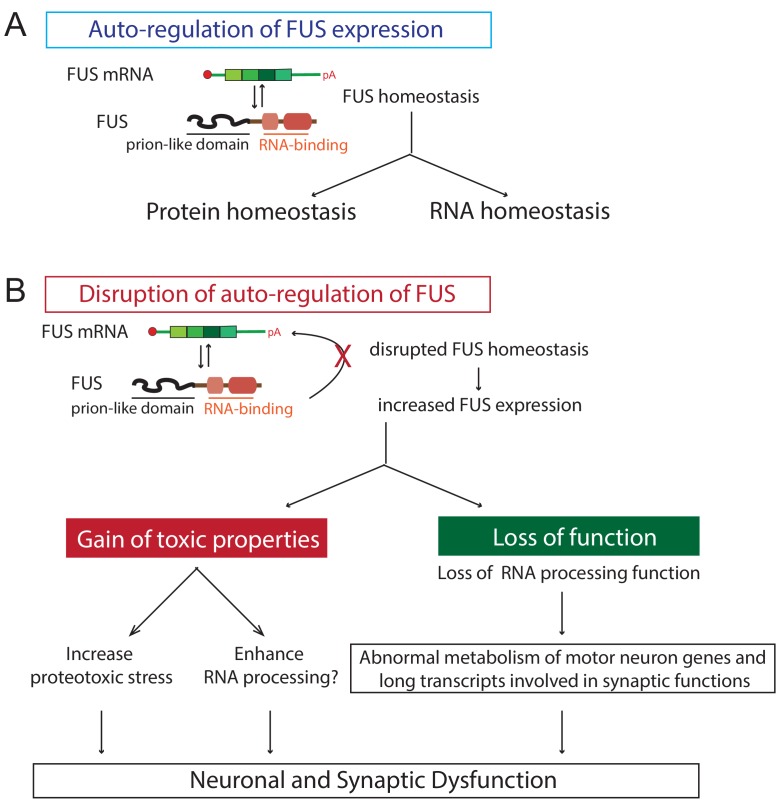
Mutations in coding and non-coding regions of FUS cause amyotrophic lateral sclerosis (ALS). The latter mutations may exert toxicity by increasing FUS accumulation. We show here that broad expression within the nervous system of wild-type or either of two ALS-linked mutants of human FUS in mice produces progressive motor phenotypes accompanied by characteristic ALS-like pathology. FUS levels are autoregulated by a mechanism in which human FUS downregulates endogenous FUS at mRNA and protein levels. Increasing wild-type human FUS expression achieved by saturating this autoregulatory mechanism produces a rapidly progressive phenotype and dose-dependent lethality. Transcriptome analysis reveals mis-regulation of genes that are largely not observed upon FUS reduction. Likely mechanisms for FUS neurotoxicity include autophagy inhibition and defective RNA metabolism. Thus, our results reveal that overriding FUS autoregulation will trigger gain-of-function toxicity via altered autophagy-lysosome pathway and RNA metabolism function, highlighting a role for protein and RNA dyshomeostasis in FUS-mediated toxicity.

Keywords: FUS; RNA metabolism; amyotrophic lateral sclerosis (ALS); autophagy-lysosome; frontotemporal degeneration (FTD); homeostasis; mouse; neuroscience.


Conflict of interest statement

SL, SD, ST, WH, KL, HI, PP, ST, TT, JC, OP, NB, AB, AV, SS, MM, JH, DS, KK, GY, LT, MM, CS, GT, AL, CL, SD No competing interests declared, DC Reviewing editor, eLife

Figures

Figure 1.
Figure 1.. Autoregulation of FUS level in adult mouse nervous system.
(A) Schematic representation of transgene constructs for wild type and mutant FUS using the murine prion promoter. Human cDNAs encoding wild type or R514G or R521C mutants of FUS were N-terminally fused to an HA tag and inserted between non-coding exons 2 and 3 of mouse prion gene. The mutations used in this study are within the nuclear localization signal as indicated. The constructs were flanked by the loxP sites of the same orientation. (B) Schematic of spinal cord sections indicates the ventral horn regions that were shown in (C) and (G). (C) Double immunostaining of spinal cord ventral horns of 2-month-old animals with an anti-FUS (red) or anti-HA antibody (red) and antibodies for markers of neurons (NeuN, green). Both endogenous mouse FUS and human FUS proteins are localized to the neuronal nucleus. (D) Immunoblots of total brain homogenates from the selected mouse lines expressing wild type and mutant FUS. Blue arrows denote the human FUS and the red arrows denote the endogenous mouse FUS. Total proteins stained with Ponceau S were used to show equal loading. (E) Relative mRNA levels of the endogenous FUS mRNA measured by RT-qPCR. Consistent with protein level, mRNA showed ~50% reduction of endogenous FUS. The data represent the average value from three animals per line ±SEM. (F) Immunoblots of species-specific antibodies for either human- or mouse-specific FUS. Cell lysates from human (HeLa) and mouse (Neuro2A) cell lines and purified recombinant human and mouse FUS were probed with either human or mouse-specific FUS antibodies. (G) Double immunostaining of spinal cord ventral horns of 2-month-old prnp-FUSR514G animals with an anti-HA antibody (green, transgene) and anti-mouse FUS (red, endogenous) antibody showed that the human transgenes were able to down-regulate the endogenous mouse FUS level.
Figure 1—figure supplement 1.
Figure 1—figure supplement 1.. Tissue expression pattern of endogenous FUS and human transgene in mice.
(A) Immunoblots of total brain homogenate showing that multiple lines expressing wild type and mutant FUS with various accumulation levels (two animals per line are represented). Blue arrows denote the human FUS and the red arrows denote the endogenous mouse FUS. Heat shock protein-90 KDa (HSP-90) was used as a loading control. (B) Relative mRNA levels of the transgene and endogenous FUS measured by RT-qPCR. Consistent with protein level, mRNA showed 1 ~ 2 fold increase in expression over endogenous. The data represent the average value from two animals per line ±SEM. (C) Immunoblots of total homogenates from different tissues using an anti-FUS antibody. Endogenous FUS is widely expressed in various tissues, whereas transgenes are selectively expressed in CNS. (D) Summary of the mRNA and protein expression level of different lines of FUS transgenic mice. Protein expression levels were normalized to HSP-90.
Figure 1—figure supplement 2.
Figure 1—figure supplement 2.. Expression pattern of FUS in mouse spinal cord.
(A) Double immunofluorescence labeling of endogenous FUS with astrocyte marker (GFAP) in the mouse spinal cord at 2 months of age. Enlarged region is shown at the upper right panel. The images indicate that astrocytes express FUS. Similarly, human FUS transgene under the mouse prion promoter also expresses in the astrocytes. (B) Double immunofluorescence labeling of endogenous FUS with oligodendrocyte marker (CC1) in the mouse spinal cord. Enlarged region is shown at the upper right panel. The images indicate that oligodendrocytes express FUS. Similarly, human FUS transgene under the mouse prion promoter also expresses in the oligodendrocytes.
Figure 1—figure supplement 3.
Figure 1—figure supplement 3.. Human FUS transgenes are expressed in most regions of the brain including the cerebellum, cortex, hippocampus and striatum of transgenic mice at 2 months of age.
Human FUS was immunostained on sagittal brain sections using an anti-HA antibody (scale bar 200 µm). Higher power images of the cerebellum, cortex, hippocampus and striatum from left panels are showing double-immunostaining with HA and NeuN antibodies (scale bar 100 µm).
Figure 2.
Figure 2.. Age-dependent, mutant-enhanced toxicity in prnp-FUS transgenic mice.
(A) Representative images of an 8-month-old FUSR514G transgenic mice and a littermate control revealing reduced hindlimb spread and clasping in the mutant mouse. Representative trace of footprint analysis for testing gait abnormality is shown in the lower panel. The front and hind paws were coated with yellow and black paint, respectively. (B) Statistical analysis of front and hind-limb stride length in FUS transgenic mice. The data represent an average of at least four animals ± SEM (***: p<0.001, **: p<0.01). (C) Resting EMG recording from the gastrocnemius muscle in isoflurane-anesthetized animals in the absence of any stimulus. (D) Double staining of neuromuscular junctions in the gastrocnemius of 12-month-old animals using anti-synaptophysin (red), Fluoromyelin red (red) and α-Bungarotoxin Alexa 488 (green) (top panel). Quantification of the percentage of innervated neuromuscular junctions in the gastrocnemius of FUS transgenic animals and their control littermates (see counting criteria in Materials and methods). The data represent the average of at least three animals ± SEM. (**: p<0.01, *: p<0.05). (E) Distributions of axonal diameters in motor axons of the L5 lumbar motor root in 1- (top panel) or 12- (lower panel) month-old animals. Data points represent the averaged distribution of axon diameters from the entire root of at least three mice for each genotype and age group. (F) Quantification of the average number of sensory axons: total, below or above 5 µm caliber diameter, in 12-month-old animals. The data represent the average of at least three animals ± SEM. (G) Quantification of the number of ChAT positive neurons in the ventral horn of spinal cords from FUS transgenic animals and their control littermates (n ≥ 3).
Figure 2—figure supplement 1.
Figure 2—figure supplement 1.. Progressive degeneration of L5 motor roots in prnp-FUS mice.
Representative images of toluidine blue staining of lumbar 5 (L5) motor roots in 2- and 12-month-old mice.
Figure 2—figure supplement 2.
Figure 2—figure supplement 2.. Progressive loss of L5 sensory roots in prnp-FUS mice.
(A) Representative images of toluidine blue staining of lumbar 5 (L5) sensory roots in 2- and 12-month-old mice. (B–E) Quantification of of L5 sensory roots at 2- and 12 months of age. (B, D) Distribution of diameters of L5 sensory roots at 2- and 12 months of age. (C, E) Numbers and distribution of sensory axon diameter in 2- and 12-month-old animals. Analysis represents the average from at least three animals per genotype. Numbers of sensory axons are reduced in all prnp-FUS mice.
Figure 2—figure supplement 3.
Figure 2—figure supplement 3.. Expression of hFUS causes astrogliosis and a reduction in the number of ChAT neurons in the ventral horn of lumbar spinal cord.
(A) High magnification images of the ventral horn of spinal cords from 12-month-old animals stained with anti-ChAT antibody (red). (B) GFAP immunofluorescence in the spinal cords of transgenic animals (FUSWT, FUSR514G, FUSR521C) at 12 months of age.
Figure 3.
Figure 3.. Acute sensitivity to FUS level.
(A) Immunoblots of total whole spinal cord homogenate from non-transgenic, singly transgenic (line 101 or line 136), doubly transgenic (line 101 and line 136), and homozygous (line 101) of FUSWT mice. Dilutions of homogenates from non-transgenic animals were used to assess the reduction of endogenous FUS. Both tubulin immunoblot and Coomassie blue staining of total proteins were examined to ensure equal loading. (B) Relative mRNA levels of the endogenous FUS mRNA measured by RT-qPCR. Consistent with protein level, mRNA showed inverse reduction of endogenous FUS with increasing human FUS transgene. The data represent the average value from three animals per line ±SEM. (C) Hindlimb clasping phenotypes (upper panel) and footprint-gait analysis (lower panel) of littermates from non-transgenic, transgene hemizygote (line 101), and transgene homozygote (line 101) of FUSWT mice. (D) Quantifications of footprint analysis showed significant reduction in the stride length in doubly transgenic (line 101 and line 136) and transgene homozygote (line 101), but not in non-transgenic and singly transgenic animals. (E) Progressive neurological phenotype in FUS over-expressing mice. Hindlimb clasping, lower posture and tremor phenotypes were scored based on the severity of the phenotype from postnatal day 16 onward (n > 5 per data point). Additions of all three measurements were plotted as neurological index. Only FUS overexpressing (doubly transgenic and transgene homozygote) mice develop progressive phenotypes. (F) Survival curve of non-transgenic, singly transgenic (line 101 or line 136), doubly transgenic (line 101 and line 136), and homozygous (line 101) of FUSWT mice. None of the FUS-overexpressing mice survived more than 40 days.
Figure 3—figure supplement 1.
Figure 3—figure supplement 1.. Dose-dependent down-regulation of FUS expression.
(A) Immunoblots of total brain homogenate probed with FUS, INPP4B, KHC (kinesin heavy chain), and HSP-90. (B) qRT-PCR of human and mouse FUS mRNA levels in 30-day-old non-transgenic, heterozygote and homozygote FUSWT transgenic mice.
Figure 4.
Figure 4.. Acute sensitivity to FUS level in lower motor neuron circuit.
(A) These representative images of the fluorescent staining of neuromuscular junctions (NMJs) in the gastrocnemius of 30-day-old animals with anti-synaptophysin (red), Fluoromyelin red (red) and α-Bungarotoxin Alexa 488 (green). (B) Quantification of NMJ innervation. The data represent the average of at least three animals ± SEM. (***: p<0.001, **: p<0.01, *: p<0.05). (C) Toluidine blue staining of lumbar 5 (L5) motor roots in 30-day-old animals. (D) Quantification of L5 motor roots in illustrated in (C). The data represent the average of at least three animals ± SEM. (**: p<0.01, *: p<0.05). (E) Quantification of ventral ChAT positive motor neurons in spinal cords of 30-day-old animals. The data represent the average of at least three animals ± SEM. (**: p<0.01, *: p<0.05).
Figure 4—figure supplement 1.
Figure 4—figure supplement 1.. Sensory root degeneration in prnp-FUS mice.
(A) Toluidine blue staining of lumbar 5 (L5) sensory roots in 30 day old animals showing degeneration signs in the FUS over-expressing mice. (B) Quantification of L5 sensory roots. The data represent the average of at least three animals ± SEM.
Figure 5.
Figure 5.. Prominent glial activation in prnp-FUS transgenic mice.
(A) Representative images of lumbar spinal cord sections from non-transgenic, FUSWT hemizygote and homozygote transgenic animals stained with Iba-I for microglia (green), GFAP for astrocyte (magenta) and HA for the transgene (red). (B) and (C) are the quantification of relative intensity of Iba-I and GFAP immunofluorescence signals. Signals of homozygote mice were set at 100%. (D) Double labeling of transgene FUSWT (HA) and microglia (Iba-I). (D) Double labeling of transgene (HA) and microglia (Iba-I) in the spinal cords of homozygote FUSWT transgenic mice showed that microglia do not express FUS.
Figure 5—figure supplement 1.
Figure 5—figure supplement 1.. Elevated astrogliosis and microgliosis in prnp-FUS mice.
Representative images of lumbar spinal cord sections from transgene heterozygote (line 136) and doubly transgene (line 101 and line 136) animals stained with Iba-I for microglia (green), GFAP for astrocyte (magenta) and HA for the transgene (red).
Figure 6.
Figure 6.. Altered RNA processing function in mice overexpression FUS.
(A) Principal Component Analysis (PCA) of differentially expressed genes in spinal cords from 30-day-old non-transgenic, hemizygous and homozygous FUSWT mice. PCA of count data across all three conditions shows a clear separation of homozygous FUS mice separately from both non-transgenic and hemizygous FUS mice across the first two principal components. (B) Hierarchical clustering of gene-centered count data cleanly categorizes the data, clustering homozygous FUS mice separately from both non-transgenic and hemizygous FUS mice. (C–H) qRT-PCR validation of selective genes identified by RNA-seq: most up-regulated genes (C), most down-regulated genes (D), genes involved in lysosome function (E), genes involved in MAPK kinase pathway (F), genes with exceptional long introns (G), motor neurons genes (H). The data represent the average of at least three animals per genotype ±SEM. The changes are specific to doubly transgenics and transgene homozygotes, but not other genotypes.
Figure 6—figure supplement 1.
Figure 6—figure supplement 1.. Distinct expression profiles in mice overexpression FUS.
MA and volcano plots of pairwise contrasts of non-transgenic, hemizygous FUS and homozygous FUSWT mice transcriptomes reveal patterns of differential expression (FDR < 0.1, effect size > √ 2, Red: upregulated; Blue: downregulated) between homozygous FUS and non-transgenic/hemizygous FUS conditions. (B, C), but not between non-transgenic and heterozygous FUS conditions (A). in MA plots, x and y-axis indicate Log-scaled Sleuth normalized observed counts and Log2 foldchange respectively. In volcano plots x and y-axis indicate -Log10 FDR and -Log2 Foldchange respectively.
Figure 6—figure supplement 2.
Figure 6—figure supplement 2.. Gene ontology enrichment (Biological process) of differentially expressed genes in FUS overexpressing mice.
Red and blue bars represent up and down-regulated genes respectively and the X-axis represents the log-scaled FDR-corrected p-value. Up-regulated genes were enriched for immune-related terms such as defense response, innate immune response and regulation of immune system process. Down-regulated genes were enriched in metabolism-related terms such as steroid biosynthesis process, cellular nitrogen compound metabolic process and cholesterol biosynthetic process.
Figure 6—figure supplement 3.
Figure 6—figure supplement 3.. No apparent gene expression changes in pre-symptomatic FUS over-expressing mice.
(A–F) qRT-PCR validation of selective genes identified by RNA-seq in 14 day old spinal cord mice: most up-regulated genes (A), most down-regulated genes (B), genes involved in lysosome function (C), genes involved in MAPK kinase pathway (D), genes with exceptional long introns (E), motor neurons genes (F). The data represent the average of at least three animals per genotype ±SEM.
Figure 7.
Figure 7.. Distinct expression profiles between FUS over-expression and knockdown within the CNS of mice.
(A) FUS overexpression (OE) in the CNS of mice results in a dose-dependent reduction in endogenous FUS. The reduction was noted to be of a lower extent when compared to samples with antisense-oligonucleotide (ASO) knockdown (KD) against mouse FUS. The relative RNA expression data were based on RNA-seq results. (B) Batch-corrected Principal Components (PCs) Analysis. (C) Cumulative explained variance across the first 10 principal components. The two PCs for the PCA and the five PCs for the heatmap are highlighted in green and blue, respectively. (D) Biclustered heatmap of log-scaled gene TPM values shows a clear separation of the OE and KD samples. (E) Proportional expression plot of genes below the 0.1 FDR cutoff shows a clear opposite dominant pattern with an OE proportion of 0.629 ± 0.017 (95% confidence interval). Blue, pink and purple represent the line-101 homozygote, FUS-ASO-KD, and similar expression overlap regions respectively. (F) Gene ontology enrichment (biological process) of DEGs in FUS overexpressing (OE) and knockdown (KD) conditions. Total of four categories of gene expression patterns are classified: (i) OE-down/KD-up, (ii) OE-down/KD-up, (iii) OE down/KD down, and (iv) OE up/KD up. Enriched GO terms are: (i) in the OE-down/KD-up group, mitochondrial respiratory chain and ribose phosphate metabolic process are affected; (ii) in the OE-down/KD-up group, stem cell population maintenance and cytokine-mediated signaling pathway are affected; (iii) in the OE down/KD down group, central nervous system myelination, regulation of synaptic plasticity are affected; and (iv) in the OE up/KD up, innate immune response and inflammatory response are affected. The X-axis represents the log-scaled FDR-corrected p-value.
Figure 7—figure supplement 1.
Figure 7—figure supplement 1.. Transcriptomic perturbations from FUS over-expression are distinct from endogenous FUS knockdown.
(A) Overview schematic of the proportional analysis performed on overexpression (OE) and knockdown (KD) datasets. (B) Proportional expression plots show a strong pattern of conversely perturbed genes passing our cutoff (FDR < 0.1, effect_size > √ 2, (A) but a weak pattern in genes above cutoff. 95% Confidence estimates for the proportion of conversely perturbed genes in cutoff-passing and cutoff failing genes were 0.629 ± 0.017 and 0.533 ± 0.014 respectively. Blue, pink and purple bars represent the line-101 homozygote, ASO-KD, and homozygote-KD expression overlaps, respectively. (C) The proportion of conversely perturbed genes in the gene set trended towards that of the Null Model as the FDR cutoff value was raised. X axis and Y axis represent the FDR cutoff used and the proportion of conversely perturbed genes observed respectively.
Figure 8.
Figure 8.. Rescue of FUS-null lethality by FUS expression in the CNS.
(A) Breeding scheme to generate prnp-FUSWT:: Fus-/- mice. Fus-/- is generated through a gene-trap strategy. (B) Immunoblots of FUS in various genotypes: Fus+/+, Fus+/-, prnp-FUSWT:: Fus+/+, prnp-FUSWT:: Fus+/-, prnp-FUSWT:: Fus-/-. Blue and red arrowheads indicate human FUS transgene and endogenous FUS, respectively. (C–D) qRT-PCR analysis of validated genes in 40-day-old non-transgenic and prnp-FUSWT:: Fus-/- mice. The data represent the average of 3 animals ± SEM. (**: p<0.01, *: p<0.05). qRT-PCR analysis of validated genes in Figure 6 showed that expression levels of genes with exceptionally long introns, motor neurons genes, lysosomal gens and MAPK pathway genes and the majority of most up-regulated genes could be rescued to the levels of non-transgenic animals. The majority of most down-regulated genes were not able to be rescued, suggesting that these genes may be extremely sensitive to FUS level.
Figure 9.
Figure 9.. Gain of protein toxicity via autophagy inhibition in prnp-FUS transgenic mice.
(A) Representative images of lumbar spinal cord sections from hemizygote and transgene homozygote FUSWT transgenic animals stained with p62 (SQSTM1) (green) and HA for human FUS transgene (grey). Scale bar is 20 μm. Cytoplasmic accumulations of p62 were visible in the ventral horn motor neurons of the spinal cord in transgene homozygous mice, but not other genotypes. (B) Schematics of autophagy induction and progression (flux) assay. Double-tagged LC3 (mCherry-GFP-LC3) were used to visualize the induction and progression of autophagy. Upon autophagy induction, LC3 is post-translationally modified with a lipid group and localize to autophagosome. Autophagosomes progress to autolysosomes by fusing with lysosome. Fluorescent signal of GFP is pH-sensitive and is quenched in autolysosome. (C) Representative images of Neuro2A cells co-transfected with BFP (blue fluorescent protein) or BFP-tagged wild type FUS with mCherry-GFP-LC3 (left panel) or immuno-stained with p62 (right panel). Nutrient-limiting medium was used to induce autophagy. (D) Quantification of autophagy induction under nutrient-limiting medium conditions. Over-expression of wild type and ALS-linked mutants (R514G and R521C) in FUS inhibit autophagy induction. (E) Quantification of autophagy flux based on the numbers of autophagosome and autolysosome. Overexpression of FUS inhibits autophagy flux. (F) Quantification of p62 accumulation in cells transfected with BFP or BFP-tagged FUS.
Figure 10.
Figure 10.. Proposed model of FUS-mediated neurodegeneration.
FUS homeostasis is essential for maintaining both protein and RNA homeostasis. The level of FUS is maintained possibly through nonsense-mediated decay and/or miRNA-mediated mechanisms (see text for references). Elevated FUS level produces both gain-of-toxic properties by either increasing proteotoxic stress or expression of stress genes and loss-of RNA-processing function in which genes involved in long transcripts and synaptic functions are selectively affected. Together they cause neuronal and synaptic dysfunction and eventual neuronal death.

Comment in

References

    1. Arai T, Hasegawa M, Akiyama H, Ikeda K, Nonaka T, Mori H, Mann D, Tsuchiya K, Yoshida M, Hashizume Y, Oda T. TDP-43 is a component of ubiquitin-positive tau-negative inclusions in frontotemporal lobar degeneration and amyotrophic lateral sclerosis. Biochemical and Biophysical Research Communications. 2006;351:602–611. doi: 10.1016/j.bbrc.2006.10.093. - DOI - PubMed
    1. Arnold ES, Ling SC, Huelga SC, Lagier-Tourenne C, Polymenidou M, Ditsworth D, Kordasiewicz HB, McAlonis-Downes M, Platoshyn O, Parone PA, Da Cruz S, Clutario KM, Swing D, Tessarollo L, Marsala M, Shaw CE, Yeo GW, Cleveland DW. ALS-linked TDP-43 mutations produce aberrant RNA splicing and adult-onset motor neuron disease without aggregation or loss of nuclear TDP-43. PNAS. 2013;110:E736–E745. doi: 10.1073/pnas.1222809110. - DOI - PMC - PubMed
    1. Barter RL, Yu B. Superheat: an R package for creating beautiful and extendable heatmaps for visualizing complex data. Journal of Computational and Graphical Statistics. 2018;27:910–922. doi: 10.1080/10618600.2018.1473780. - DOI - PMC - PubMed
    1. Bindea G, Mlecnik B, Hackl H, Charoentong P, Tosolini M, Kirilovsky A, Fridman WH, Pagès F, Trajanoski Z, Galon J. ClueGO: a cytoscape plug-in to decipher functionally grouped gene ontology and pathway annotation networks. Bioinformatics. 2009;25:1091–1093. doi: 10.1093/bioinformatics/btp101. - DOI - PMC - PubMed
    1. Boillée S, Yamanaka K, Lobsiger CS, Copeland NG, Jenkins NA, Kassiotis G, Kollias G, Cleveland DW. Onset and progression in inherited ALS determined by motor neurons and microglia. Science. 2006;312:1389–1392. doi: 10.1126/science.1123511. - DOI - PubMed

Publication types