

Measures of Listening Effort Are Multidimensional
- PMID: 30747742
- PMCID: PMC7664710
- DOI: 10.1097/AUD.0000000000000697
Measures of Listening Effort Are Multidimensional
Abstract
Objectives: Listening effort can be defined as the cognitive resources required to perform a listening task. The literature on listening effort is as confusing as it is voluminous: measures of listening effort rarely correlate with each other and sometimes result in contradictory findings. Here, we directly compared simultaneously recorded multimodal measures of listening effort. After establishing the reliability of the measures, we investigated validity by quantifying correlations between measures and then grouping-related measures through factor analysis.
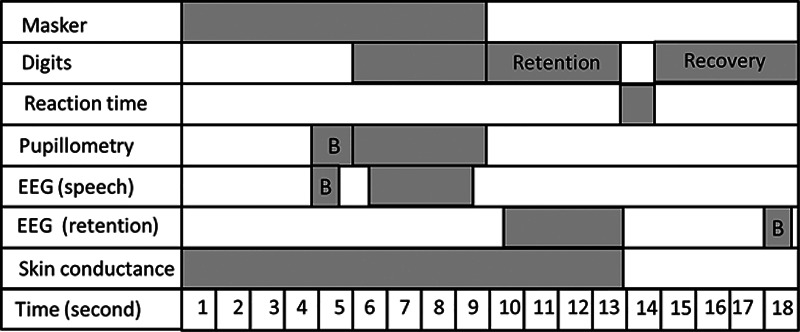
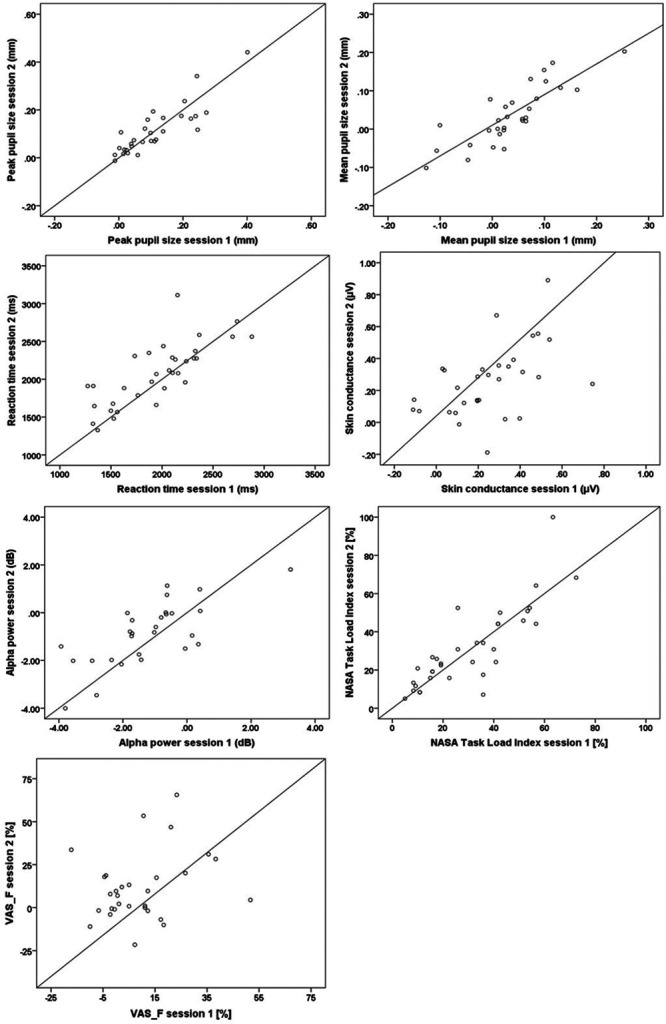
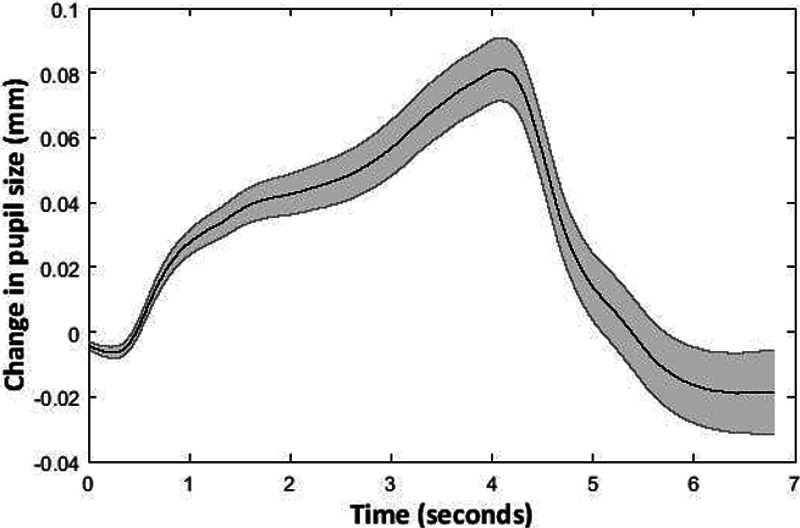
Design: One hundred and sixteen participants with audiometric thresholds ranging from normal to severe hearing loss took part in the study (age range: 55 to 85 years old, 50.3% male). We simultaneously measured pupil size, electroencephalographic alpha power, skin conductance, and self-report listening effort. One self-report measure of fatigue was also included. The signal to noise ratio (SNR) was adjusted at 71% criterion performance using sequences of 3 digits. The main listening task involved correct recall of a random digit from a sequence of six presented at a SNR where performance was around 82 to 93%. Test-retest reliability of the measures was established by retesting 30 participants 7 days after the initial session.
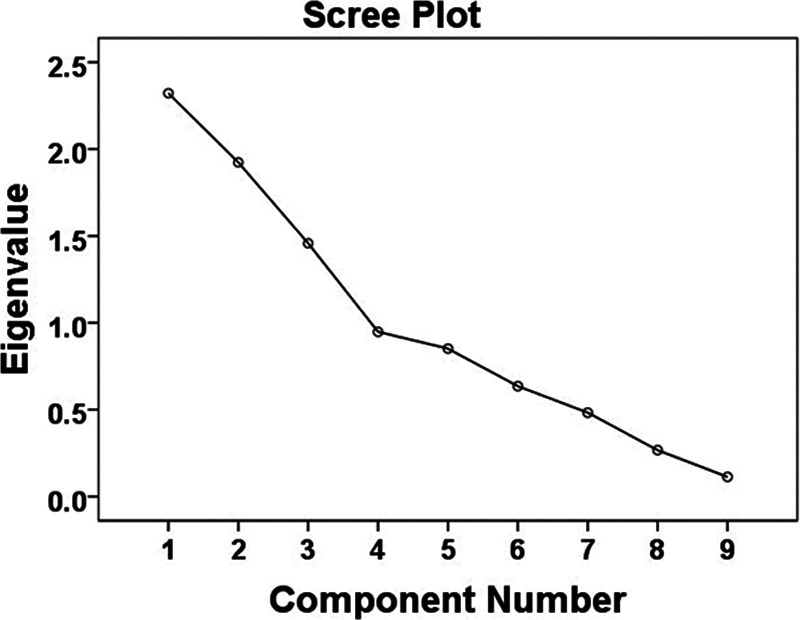
Results: With the exception of skin conductance and the self-report measure of fatigue, interclass correlation coefficients (ICC) revealed good test-retest reliability (minimum ICC: 0.71). Weak or nonsignificant correlations were identified between measures. Factor analysis, using only the reliable measures, revealed four underlying dimensions: factor 1 included SNR, hearing level, baseline alpha power, and performance accuracy; factor 2 included pupillometry; factor 3 included alpha power (during speech presentation and during retention); factor 4 included self-reported listening effort and baseline alpha power.
Conclusions: The good ICC suggests that poor test reliability is not the reason for the lack of correlation between measures. We have demonstrated that measures traditionally used as indicators of listening effort tap into multiple underlying dimensions. We therefore propose that there is no "gold standard" measure of listening effort and that different measures of listening effort should not be used interchangeably. When choosing method(s) to measure listening effort, the nature of the task and aspects of increased listening demands that are of interest should be taken into account. The findings of this study provide a framework for understanding and interpreting listening effort measures.
Conflict of interest statement
The authors have no conflicts of interest to disclose.
Figures
References
-
- Alhanbali S., Dawes P., Lloyd S., et al. Self-reported listening-related effort and fatigue in hearing-impaired adults. Ear Hear, 2017). 38, e39–e48. - PubMed
-
- Alhanbali S., Dawes P., Lloyd S., et al. Hearing handicap and speech recognition correlate with self-reported listening effort and fatigue. Ear Hear, 2018). 39, 470–474. - PubMed
-
- Cicchetti D. V. Guidelines, criteria, and rules of thumb for evaluating normed and standardized assessment instruments in psychology. Psychol Assess, 1994). 6, 284–290.
-
- Cohen M. X. Analyzing Neural Time Series Data: Theory and Practice. 2014). London: MIT Press.
Publication types
MeSH terms
LinkOut - more resources
Full Text Sources
Medical
Miscellaneous
