. 2019 Feb;566(7745):543-547.
doi: 10.1038/s41586-019-0903-2. Epub 2019 Jan 23.

Altered human oligodendrocyte heterogeneity in multiple sclerosis

Affiliations

Altered human oligodendrocyte heterogeneity in multiple sclerosis

Sarah Jäkel et al. Nature. 2019 Feb.

Abstract

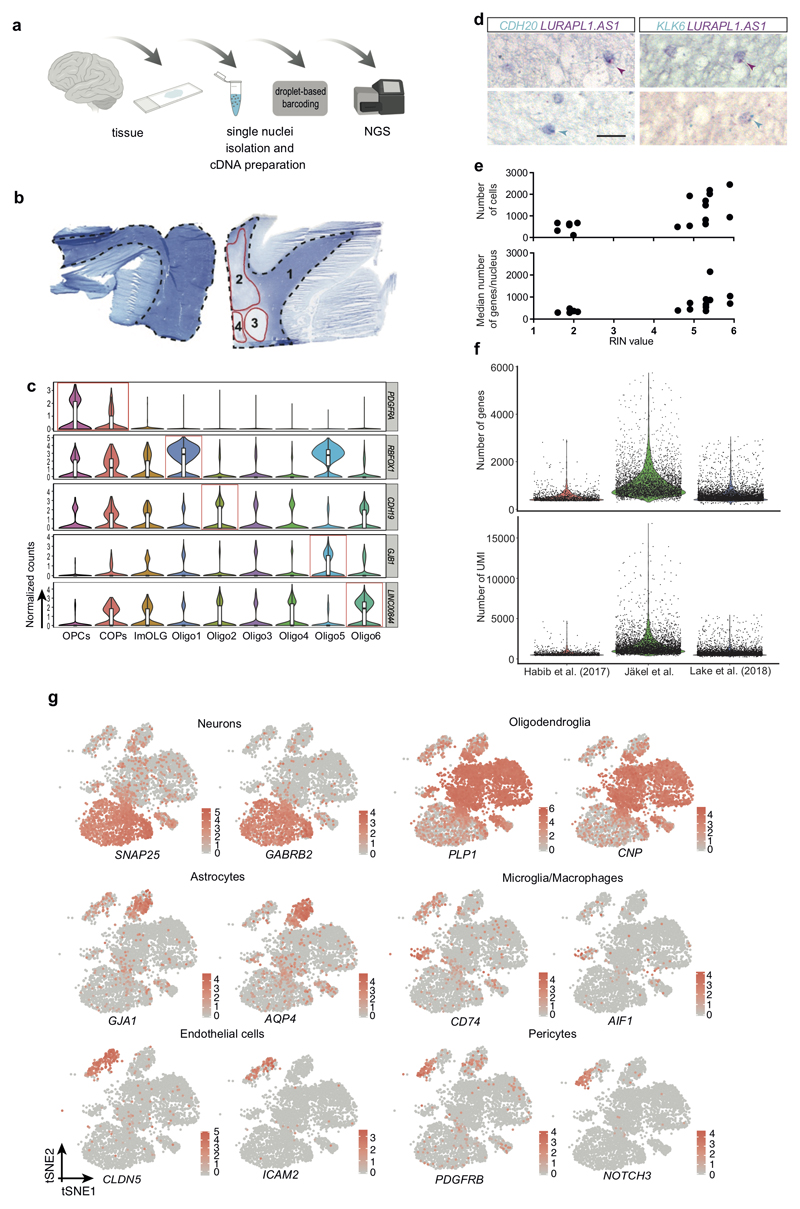
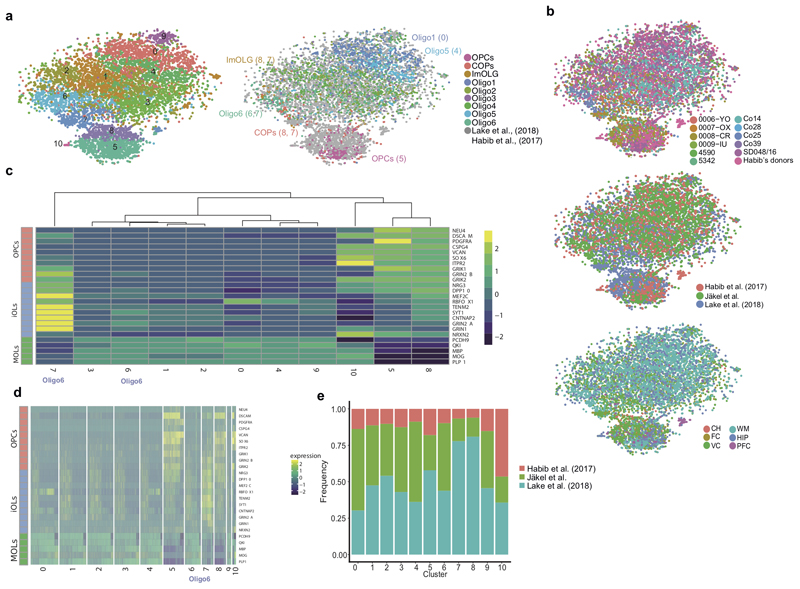
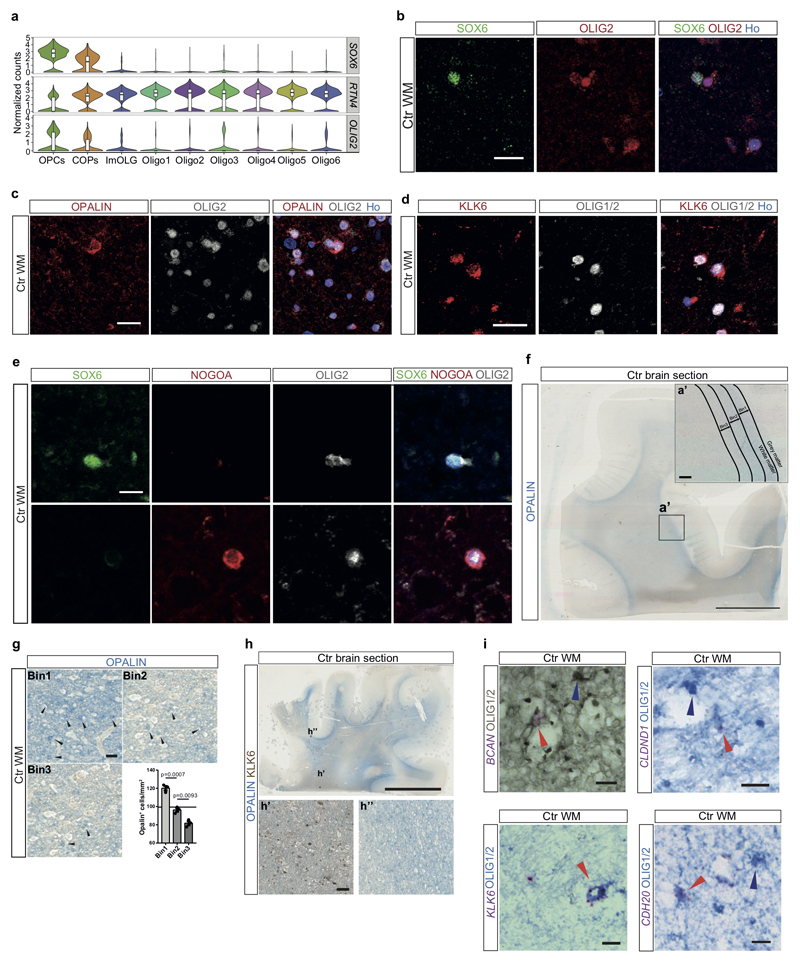
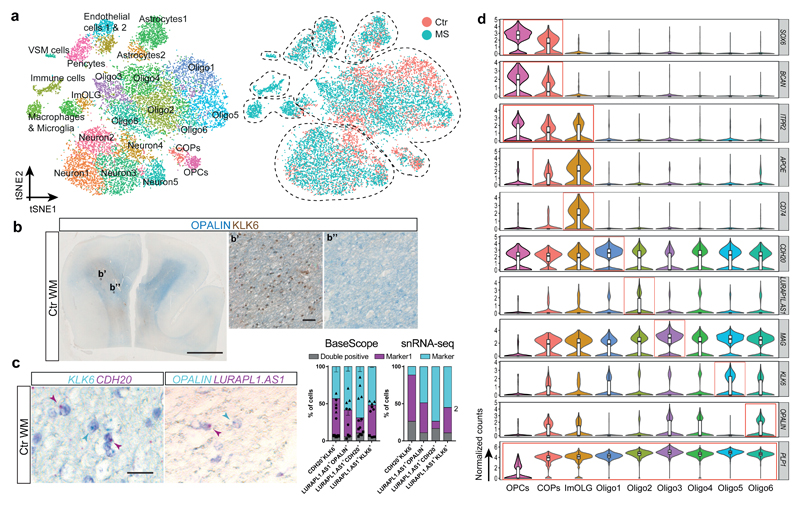
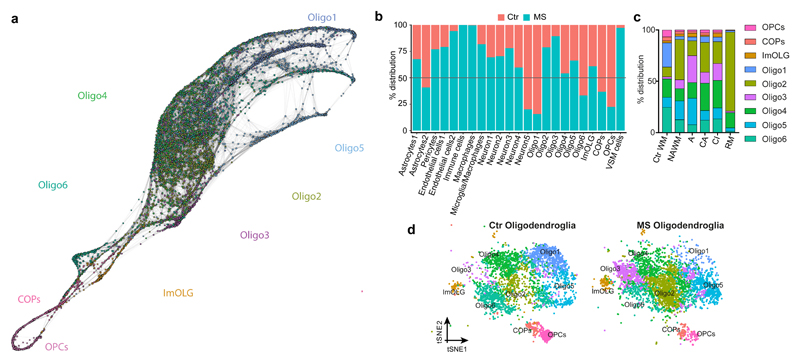
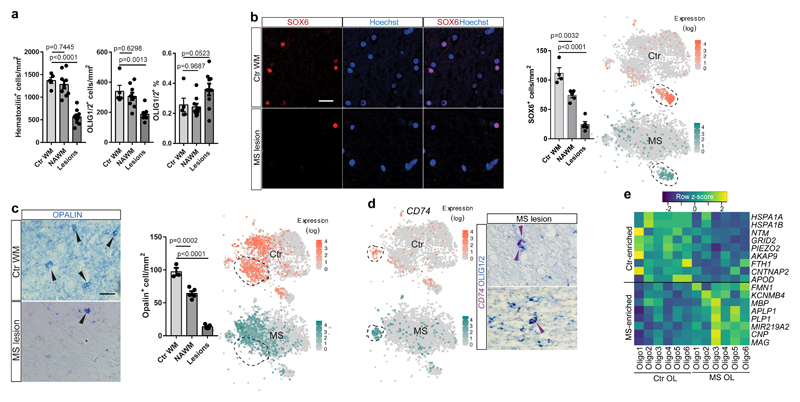
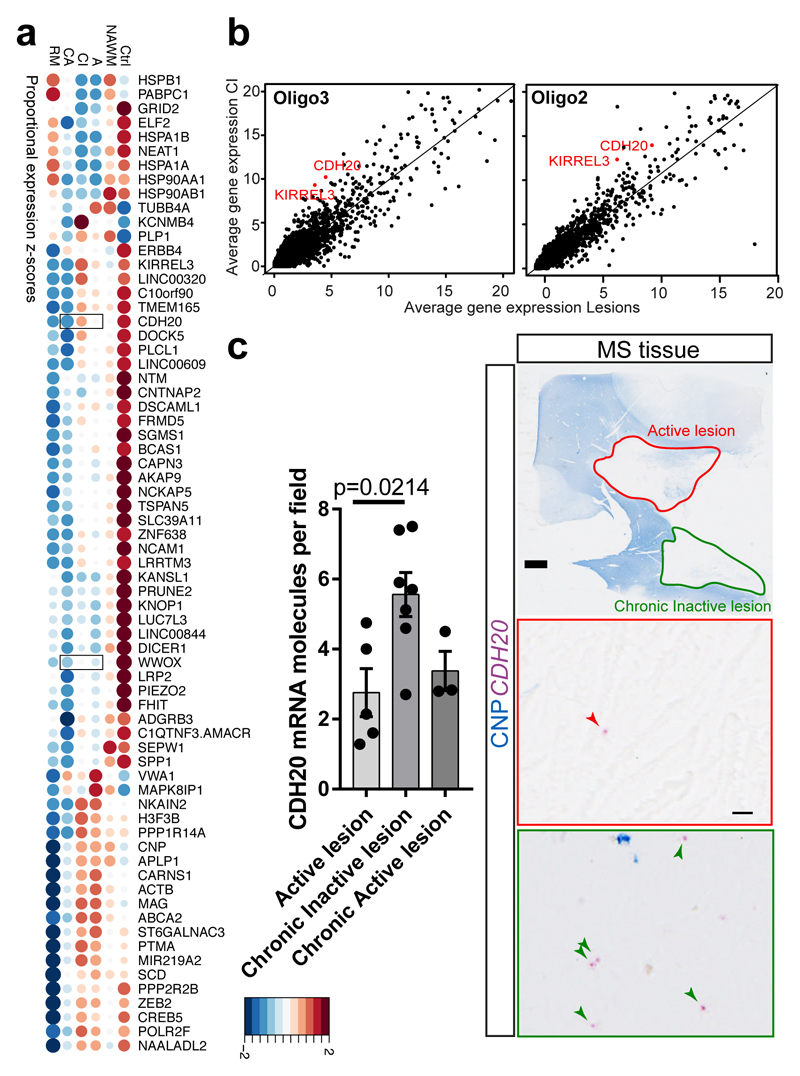
Oligodendrocyte pathology is increasingly implicated in neurodegenerative diseases as oligodendrocytes both myelinate and provide metabolic support to axons. In multiple sclerosis (MS), demyelination in the central nervous system thus leads to neurodegeneration, but the severity of MS between patients is very variable. Disability does not correlate well with the extent of demyelination1, which suggests that other factors contribute to this variability. One such factor may be oligodendrocyte heterogeneity. Not all oligodendrocytes are the same-those from the mouse spinal cord inherently produce longer myelin sheaths than those from the cortex2, and single-cell analysis of the mouse central nervous system identified further differences3,4. However, the extent of human oligodendrocyte heterogeneity and its possible contribution to MS pathology remain unknown. Here we performed single-nucleus RNA sequencing from white matter areas of post-mortem human brain from patients with MS and from unaffected controls. We identified subclusters of oligodendroglia in control human white matter, some with similarities to mouse, and defined new markers for these cell states. Notably, some subclusters were underrepresented in MS tissue, whereas others were more prevalent. These differences in mature oligodendrocyte subclusters may indicate different functional states of oligodendrocytes in MS lesions. We found similar changes in normal-appearing white matter, showing that MS is a more diffuse disease than its focal demyelination suggests. Our findings of an altered oligodendroglial heterogeneity in MS may be important for understanding disease progression and developing therapeutic approaches.


Conflict of interest statement

The authors declare competing financial interests. DM and IK are employees at F. Hoffmann – La Roche, Ltd.

Figures

Extended Figure1
Extended Figure1. Single nuclei RNA-seq of human post-mortem brain tissue
a, Schematic overview of the methodology and workflow used to isolate single nuclei from human white matter and RNA-seq using Chromium 10x Genomics and Illumina NGS (scheme was created with BioRender). b, Luxol Fast Blue (LFB) staining of human control (Ctr, left) and Multiple Sclerosis (MS, right) brain sections used for the experiment; WM is outlined with a dotted line. MS brains were divided into normal appearing white matter (NAWM) (1) and different lesion types (2-4). c, Violin Plots of additional markers enriched in specific OL subpopulations showing normalized gene expression (nOPC=352, nCOP=242, ImOLG=207, nOligo1=1129, nOligo2=1839, nOligo3=775, nOligo4=1579, nOligo5=1167, nOligo6=1484). Violin plots are centered around the median with interquartile ranges, with shape representing cell distribution. d, Double in-situ hybridization (ISH, BaseScope) of human Ctr WM counterstained with Hematoxylin. e, Correlation between RIN values and number of genes per nucleus or number of cells recovered in individual samples. f, Quality control parameters of different human brain OLs snRNA-seq datasets showing the individual number of genes (top) and number of UMI (bottom) per cell (n=1161 cells from Habib et al 2017, n=3998 Ctr nuclei from this dataset and n=4873 nuclei from Lake et al. 2018). g, tSNE projections of known cellular markers for the identification of all brain cell clusters in Ctr samples (n=6591 nuclei).
Extended Figure2
Extended Figure2. Quality control of snRNA-seq dataset reveals similar depth to previous datasets, and combination with other human brain snRNA-seq datasets identifies Oligo6 as an intermediate OL state.
a, tSNEs representing OL lineage clusters when performing clustering analysis with the combination of the three datasets (left) and assigning cell identity according to the clusters identified in Fig.1 (right, in brackets, the numerical cluster identity with the dataset combination, as indicated in the left tSNE) (n= number of nuclei, nCluster0=1445, nCluster1=1406, nCluster2=1355, nCluster3=1299, nCluster4=1150, nCluster5=1068, nCluster6=828, nCluster7=605, nCluster8=59, nCluster9=250, nCluster10=28). b, tSNEs indicating the cell origin when combining the current snRNA-seq dataset with Habib et al., 2017 and Lake et al., 2018 snRNA-seq datasets sorted by different individuals (top), different datasets (middle) and different regions (bottom) (n=9493 nuclei). c-d, Heatmaps representing expression of genes associated with intermediate states across the oligodendroglial lineage (as defined by Lake et al., 2018) at a cluster (c) and individual cell (d) level. e, Frequency distribution of identified oligodendroglia between different datasets.
Extended Figure3
Extended Figure3. Seurat2 CCA clustering of snRNA-seq dataset at different clustering resolutions.
Seurat clustering at a lower (a) and higher resolution (b) than the clustering resolution in Fig.1 (n=17799 nuclei derived from 5 Ctr and 4 MS patients).
Extended Figure4
Extended Figure4. Validation of novel OL sub-cluster markers and regional OL subpopulation distribution in human Ctr brain.
a, Violin plots showing SOX6, RTN4 (NOGOA) and OLIG2 normalized expression counts in different OL subpopulations (n=number of nuclei in Ctr nOPC=273, nCOP=153, ImOLG=81, nOligo1=952, nOligo2=388, nOligo3=82, nOligo4=724, nOligo5=393, nOligo6=991). Violin plots are centered around the median with interquartile ranges, with shape representing cell distribution. b, Colocalization of SOX6 and OLIG2 as a marker for OPCs (scale bar: 20µm). c, Colocalization of OPALIN and OLIG2 as a marker for Oligo6 (scale bar: 20µm). d, Colocalization of KLK6 and OLIG1/2 as a marker for Oligo5. e, Colocalization of SOX6, NOGOA and OLIG2. SOX6+OLIG2+NOGOA- cells (upper panel) are OPCs, NOGOA+OLIG2+SOX6- cells are mature OL (scale bar: 10µm). f, OPALIN staining of a Ctr brain section (scale bars: 5mm, inlay: 300µm). g, OPALIN+ Oligo6 in different bins of 300µm increments from the GM/WM border (scale bar:50µm, n=3 different Ctr and MS individuals with NAWM and lesions, ANOVA, data are displayed as mean ± SEM). h, Combined OPALIN and KLK6 staining of another human Ctr brain block (scale bar: 5mm, inlays: 50µm). In b-e experiments were independently performed in 2 batches. i, Validation of novel OL mRNA markers in combination with OLIG1/2 IHC. BCAN (top left), CLDND1 (top right), KLK6 (bottom left) and CDH20 (bottom right). Red arrowheads: marker+/OLIG1/2+ OL, blue arrowhead: marker-/OLIG1/2+ OL (scale bars: 10µm).
Extended Figure5
Extended Figure5. Comparison of human Ctr and MS OL snRNA-seq and mouse EAE oligodendroglia scRNA-seq datasets shows similarities and differences in OL heterogeneity.
Heatmap of the mean AUROC values (see methods), from the unsupervised classification, of cell type to cell type comparison between human (current dataset) and mouse oligodendroglia (Falcao et al, 2018).
Extended Figure6
Extended Figure6. Gene Ontology analysis reveals functional differences between human OL sub-clusters.
The most significantly differentially expressed genes from the snRNA-seq experiment of each OL sub-cluster were selected and Gene Ontology and pathway analysis was performed with the ClueGO plug-in in Cytoscape on each individual cluster. Individual donut charts present the percentage of found genes associated with the term and depict the most significant biological categories.
Extended Figure7
Extended Figure7. Clustering of snRNA-seq dataset by different origins.
a, tSNEs representing human Ctr and MS WM nuclei after dimensionality reduction with principal component analysis (PCA) at different resolutions. b-d, Clustering of snRNA-seq datasets by sample after dimensionality reduction with PCA (left) and canonical component analysis (CCA, right), highlighting Ctr/MS individual and lesion type combined (b), Ctr/MS individual (c) and lesion type (d) separately. e, Frequency distributions of OL sub-clusters by Ctr (left) and MS (right) individuals. (n=17799 cells derived from 5 Ctr and 4 MS patients).
Extended Figure8
Extended Figure8. Validation of skewed MS heterogeneity and OL gene expression profiling in Ctr and NAWM.
a, Validation of BCAN-expressing OPCs in combination with OLIG1/2 IHC. Red arrowhead: BCAN+/OLIG1/2+ OPC, blue arrowhead: BCAN-/OLIG1/2+ OL (scale bar: 20µm) and tSNE overlay of BCAN expression in the snRNA-seq dataset in Ctr and MS, (scale bar: 20µm, data displayed as mean±SEM, n=4 samples from different control individuals, n=6 NAWM samples and n=5 MS lesion samples from different MS patients, ANOVA. b, KLK6-expressing OL in Ctr WM, NAWM and MS lesions (scale bar: 50µm, data displayed as mean±SEM, n=4 samples from different Ctr individuals and n=5 different MS individuals, ANOVA) and tSNE overlay of KLK6 expression in the Ctr and MS snRNA-seq dataset. c, Violin plots showing the normalized expression counts of genes enriched in ImOLG in the snRNA-seq dataset (nOPC=352, nCOP=242, nImOLG=207, nOligo1=1129, nOligo2=1839, nOligo3=775, nOligo4=1579, nOligo5=1167, nOligo6=1484). Violin plots are centered around the median with interquartile ranges, with shape representing cell distribution. d, MRF IHC in Ctr WM, NAWM and MS lesions (scale bar: 50µm, data displayed as mean±SEM, n=6 samples from different control individuals, and n=7 different MS patients, ANOVA) and tSNE overlay of MYRF expression in the snRNA-seq dataset. e, tSNE overlay of MBP expression in the Ctr and the MS snRNA-seq dataset (n=4037 OL in Ctr and n=4737 OL in MS). f, Western blot of the MYRF antibody on human brain lysate to validate the specificity of the antibody. For gel source data, see Supporting Fig.1 g, Combination of MYRF mRNA and protein labeling to confirm the specificity of the MYRF antibody in Ctr WM (scale bar: 10µm). h, Heatmaps representing the average gene expression of a subset of genes, including myelin-related genes, in Ctr vs. MS samples in OPCs (Ctr.vs. MS and Ctr. vs. NAWM) and mature OLs (Ctr vs. NAWM). a-b,d: each experiment was performed in 2 (3 for d) independent batches and p-values are only displayed compared to Ctr.; f,g: each experiment was performed twice on independent samples.
Extended Figure9
Extended Figure9. Validations of altered OL heterogeneity in MS and mRNA expression differences in lesions.
a, Quantification of BaseScope in-situ hybridization of CDH20 (mRNA) in individual MS patients (corresponds to Fig. 4c) shows an enrichment in chronic inactive lesions in each individual (n= individual number of quantified fields per patient (n=7): MS235: n=10 for A and CI lesions, MS200: n=4 for A, CI and CA lesions, MS249: n=4 for A and n=8 for CI lesions, MS361: n=7 for A and n=10 for CI lesions, MS106: n=11 for CA and CI lesions, MS161: n=6 for CA and n=10 for CI lesions, MS300: n=7 for A and n=10 for CI lesions, data displayed as mean ± SEM). b-c, BaseScope in-situ hybridization of WWOX (mRNA) shows depletion of detected mRNA in CA lesions on average (b) and in individual MS patients (c) (scale bars: 2mm, 20µm, b: n=2 for active lesions and n=4 for chronic inactive and chronic active lesions, data displayed as mean ± SEM, ANOVA, c: dots display the individual number of quantified fields per patient (n=5), MS245: n=8 for A, n=10 for CI and n=9 for CA lesions, MS361: n=6 for A and n=10 for CI lesions, MS101: n=6 for CI and n=11 for CA lesions, MS161: n=10 for CI and n=7 for CA lesions, MS296: n=11 for CA and n=6 for CI lesions, data displayed as mean ± SEM). d, Dotplot of the total normalized RNA UMI counts found within the lesions, NAWM and controls, where both size and color indicate z-scores blue and large: low; red and large: high; small: intermediate). e, Density histograms showing the difference in distribution of normalized counts observed between control and remyelinated lesions.
Figure1
Figure1. Single nuclei RNA-seq reveals oligodendroglia heterogeneity in the human brain.
a, tSNE projection of all recovered cell clusters, sorted by cell population (left) or disease condition (right) (n=17799 nuclei from 5 Ctr and 4 MS patients). b, Combined OPALIN and KLK6 staining of human Ctr WM (scale bar: 5mm, inlays: 50µm). c, Double in-situ hybridization (ISH, BaseScope) of human Ctr WM counterstained with hematoxylin; quantification of double-positive OL determined by ISH (left) and the snRNA-seq dataset (right), (left graph: n=4 for LURAP1L.AS1+CDH20+, n=3 for other combinations. Experiments were performed in 3 independent batches; data displayed as mean ± SEM, rectangles, circles and triangles display individual values of double positive, marker1 and marker2, respectively. Right graph: Percentage of nuclei positive for marker 1, marker 2 and double. Positive = average expression >0. Total n (individual nuclei) for each combination: CDH20+KLK6+ n=5902, LUAP1L.AS1+OPALIN+ n=2980, nLUAP1L.AS1+CDH20+=5782, nLUAP1L.AS1+KLK6+=3395. d, Violin plots of markers enriched in specific OL subpopulations showing normalized gene expression (nOPC=352, nCOP=242, ImOLG=207, nOligo1=1129, nOligo2=1839, nOligo3=775, nOligo4=1579, nOligo5=1167, nOligo6=1484). Violin plots are centered around the median with interquartile ranges, with the shape representing cell distribution. ImOLG: immune oligodendroglia, VSM cells: vascular smooth muscle cells, COPs, committed oligodendrocyte progenitor cells, OPCs: oligodendrocyte precursor cells.
Figure2
Figure2. Altered oligodendroglia heterogeneity in human MS brain.
a, SCN3E pseudotime analysis of the human OL lineage in Ctr and MS white matter (WM). b, Frequency distribution of all clusters between Ctr (red) and MS (turquoise) nuclei. c, Frequency distribution of OL clusters between Ctr and different MS lesions. d, tSNE projections of OL sub-clusters in Ctr and MS tissue (n=4037 OL in Ctr and n=4737 OL in MS).
Figure3
Figure3. Depletion of specific OL sub-clusters and increased expression of myelination genes in mature OLs in human MS brain.
a, Total cellular and OL densities in Ctr WM, NAWM and MS lesions (data displayed as mean ± SEM, n=5 Ctr individuals, n=9 MS individuals, ANOVA). b, SOX6-expressing OPCs in Ctr WM, NAWM and MS lesions (scale bars 50µm, data displayed as mean ± SEM, n=4 Ctr individuals, n=5 MS individuals, ANOVA) and tSNE overlay of SOX6 expression in the Ctr and MS snRNA-seq dataset. c, OPALIN-expressing OL in Ctr WM, NAWM and MS lesions (scale bar: 50µm, data displayed as mean±SEM, n=3 Ctr individuals, n=5 MS individuals, ANOVA) and tSNE overlay of OPALIN expression in the Ctr and MS snRNA-seq dataset. d, CD74 expression in the Ctr and the MS snRNA-seq dataset and BaseScope in-situ validation of presence of CD74 combined with IHC staining for Olig1/2+ OLs (n=2 different MS patients, experiments were performed in 2 independent batches). e, Heatmap representing the average gene expression of a subset of genes, including myelin-related genes, in mature OL in Ctr vs. MS samples). For tSNEs and heatmap, n=4037 OL in Ctr and n=4737 OL in MS for all t-SNE projections). a-c: only p-values compared to Ctr are displayed.
Figure4
Figure4. Differential gene expression analysis of MS lesions reveals potential specific markers.
a, Dotplot illustrating the top differentially expressed genes (in terms of percentage of cells expressing these genes per sample) between lesions, NAWM and control; both size and color indicate z-scores (blue and large: low; red and large: high; small: intermediate). Validated genes CDH20 and WWOX are highlighted with squares. b, Average gene expression across Oligo2 (left) and Oligo3 (right) in chronic inactive (CI) lesions compared to the average expression in the rest of the lesions. In red: examples of genes significantly differentially expressed and upregulated in CI lesions (Bonferroni corrected Wilcoxon Rank Sum two-sided test, adjusted p-val <0.05). c, BaseScope in-situ validation of CDH20 expression in different lesion types (scale bars: 2mm, 10µm, data displayed as mean±SEM, n=5 active lesions, n=7 chronic inactive and n=3 chronic active lesions derived from n=7 different MS patients, ANOVA, only significant p-values are displayed). Abbreviations: NAWM (normal appearing white matter), active (A), chronic active (CA), chronic inactive (CI) and remyelinated (RM).

Comment in

References

    1. Bodini B, et al. Dynamic Imaging of Individual Remyelination Profiles in Multiple Sclerosis. Ann Neurol. 2016;79:726–738. doi: 10.1002/ana.24620. - DOI - PMC - PubMed
    1. Bechler ME, Byrne L, Ffrench-Constant C. CNS Myelin Sheath Lengths Are an Intrinsic Property of Oligodendrocytes. Curr Biol. 2015;25:2411–2416. doi: 10.1016/j.cub.2015.07.056. - DOI - PMC - PubMed
    1. Marques S, et al. Oligodendrocyte heterogeneity in the mouse juvenile and adult central nervous system. Science. 2016;352:1326–1329. doi: 10.1126/science.aaf6463. - DOI - PMC - PubMed
    1. Falcão AM, et al. Disease-specific oligodendrocyte lineage cells arise in multiple sclerosis. Nature Medicine. 2018 doi: 10.1038/s41591-018-0236-y. - DOI - PMC - PubMed
    1. Zheng GX, et al. Massively parallel digital transcriptional profiling of single cells. Nat Commun. 2017;8:14049. doi: 10.1038/ncomms14049. - DOI - PMC - PubMed

Publication types

MeSH terms