. 2019 Jun;105(6):1209-1224.
doi: 10.1002/JLB.1VMA0818-320R. Epub 2019 Feb 12.

The trafficking protein JFC1 regulates Rac1-GTP localization at the uropod controlling neutrophil chemotaxis and in vivo migration

Affiliations

The trafficking protein JFC1 regulates Rac1-GTP localization at the uropod controlling neutrophil chemotaxis and in vivo migration

Mahalakshmi Ramadass et al. J Leukoc Biol. 2019 Jun.

Abstract

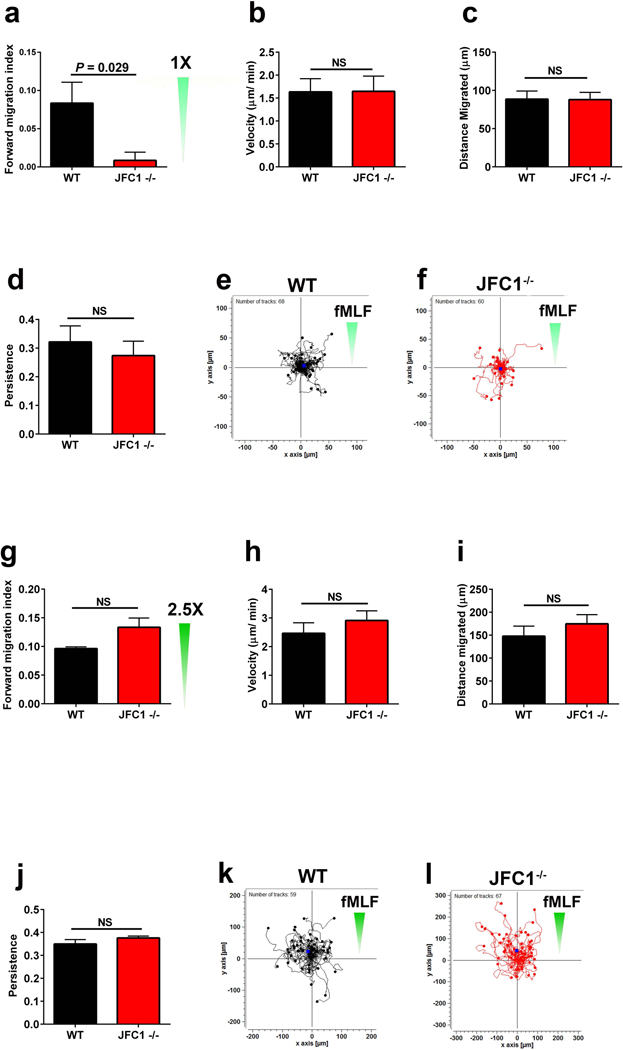
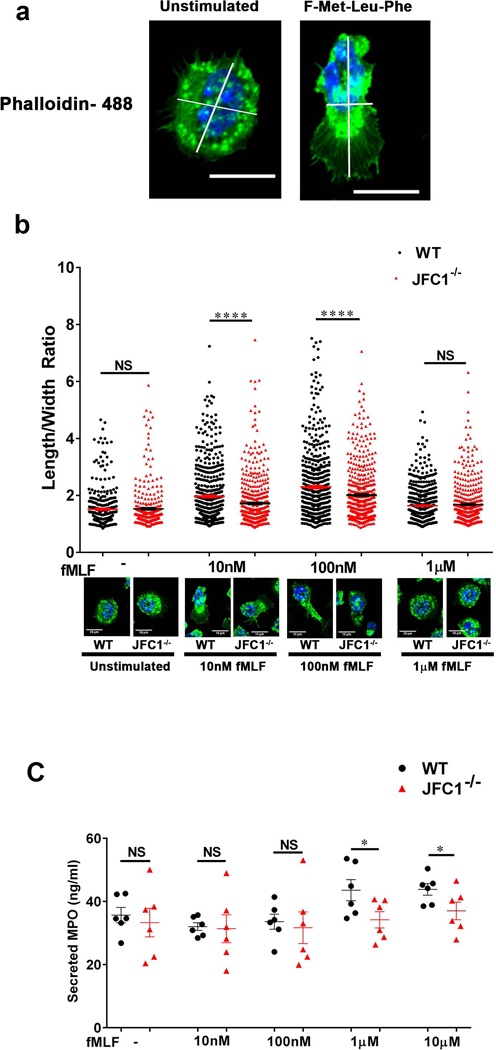
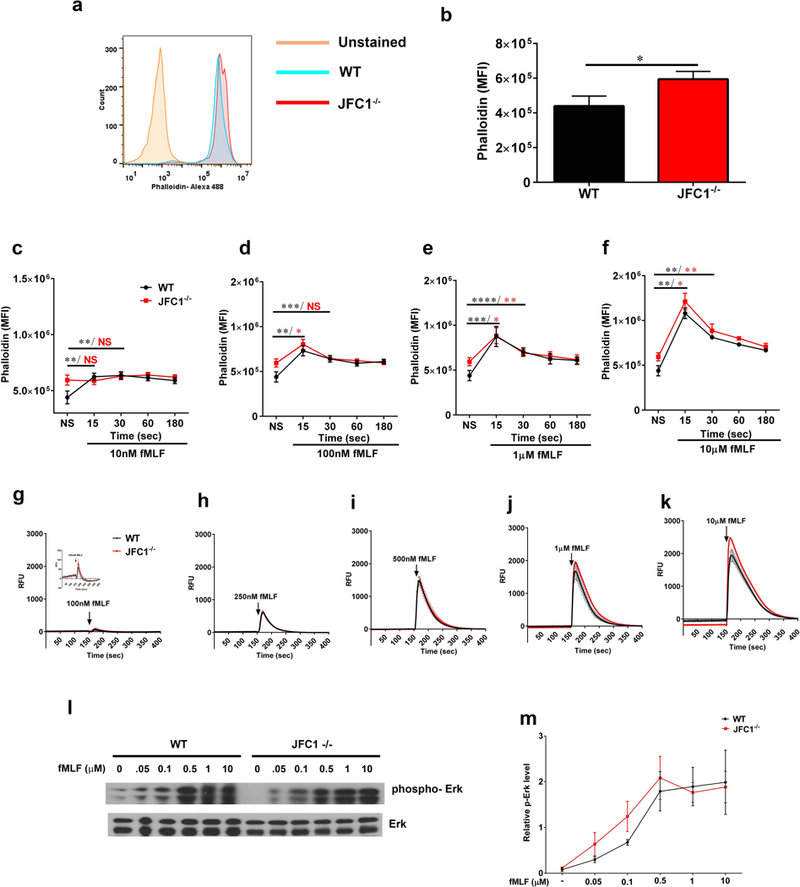
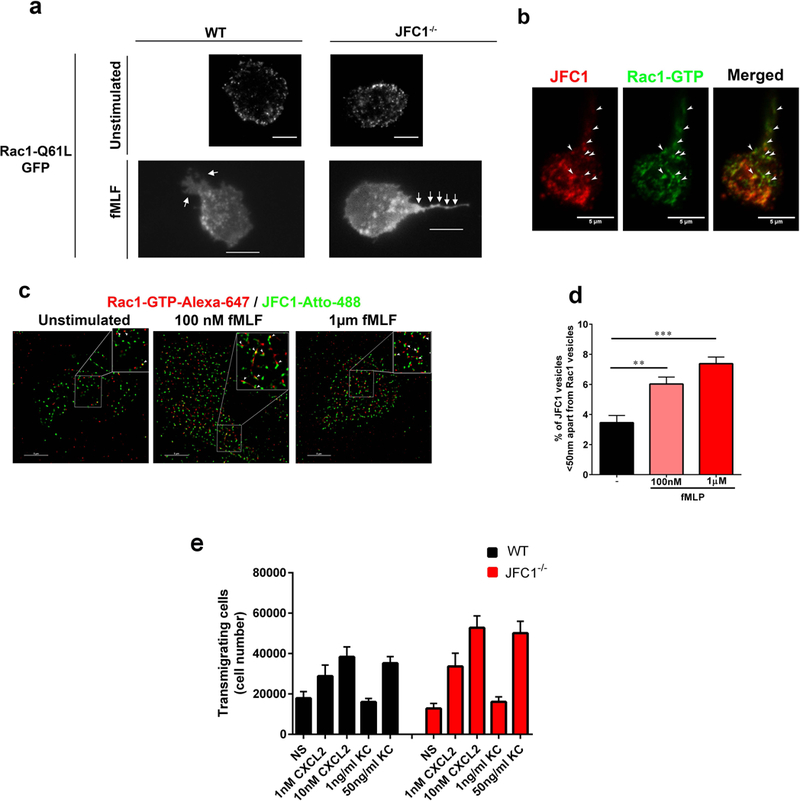
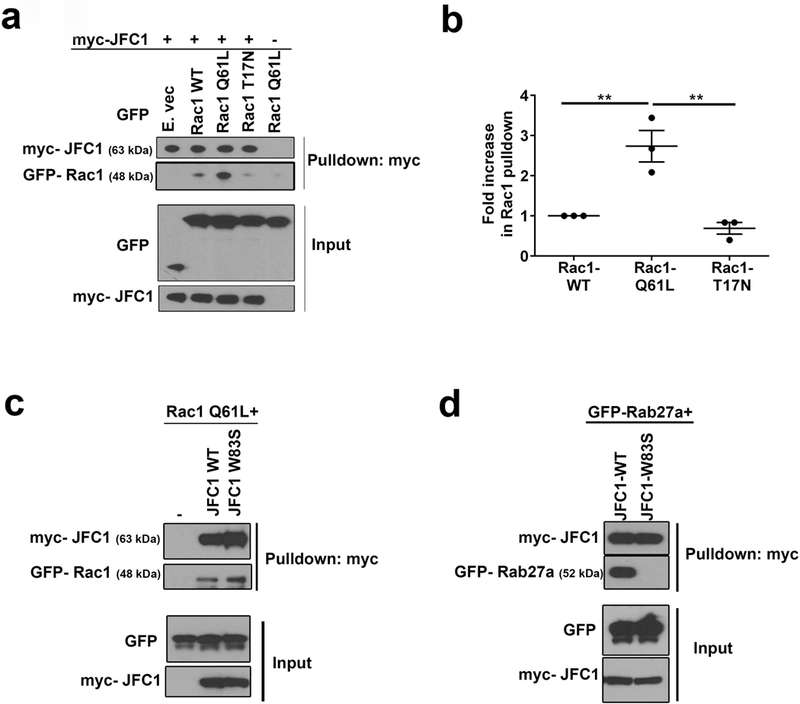
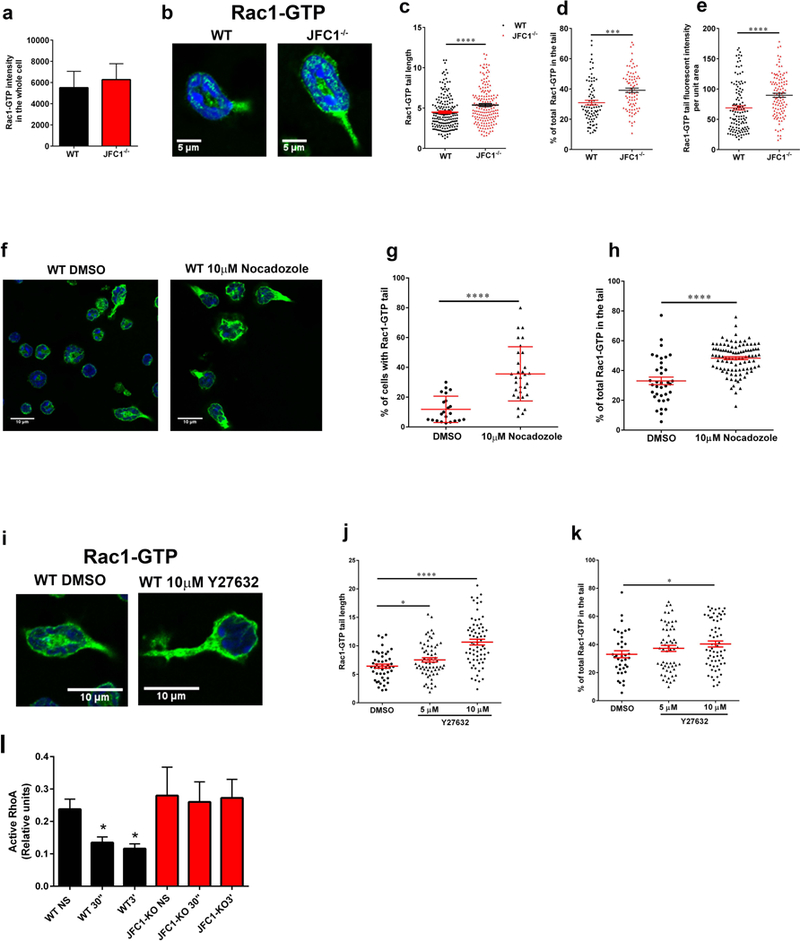
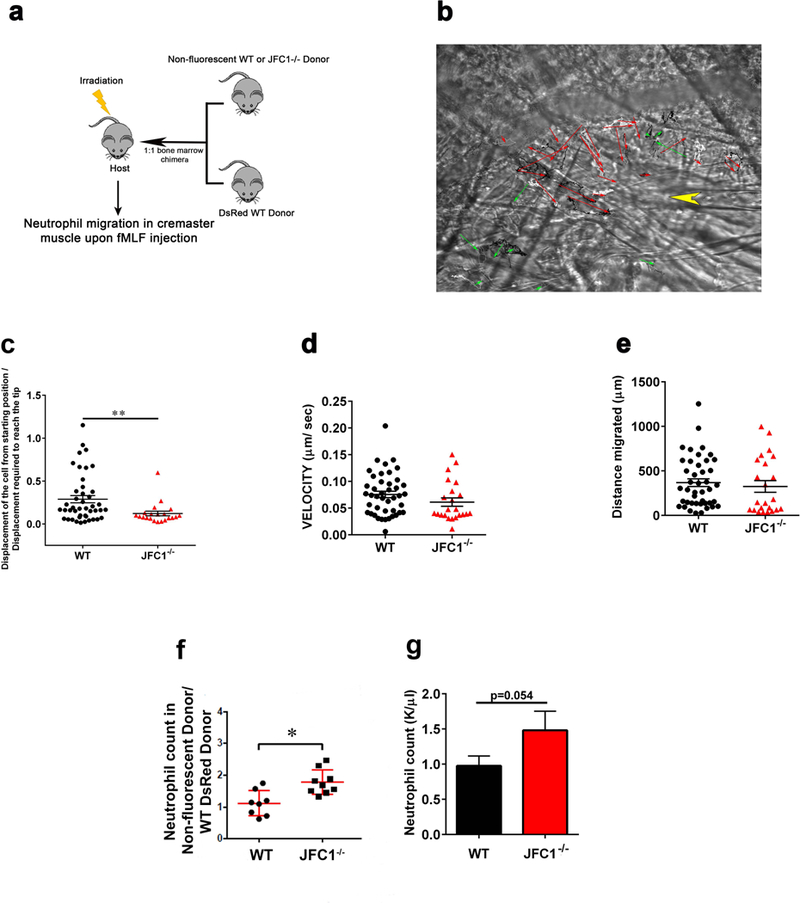
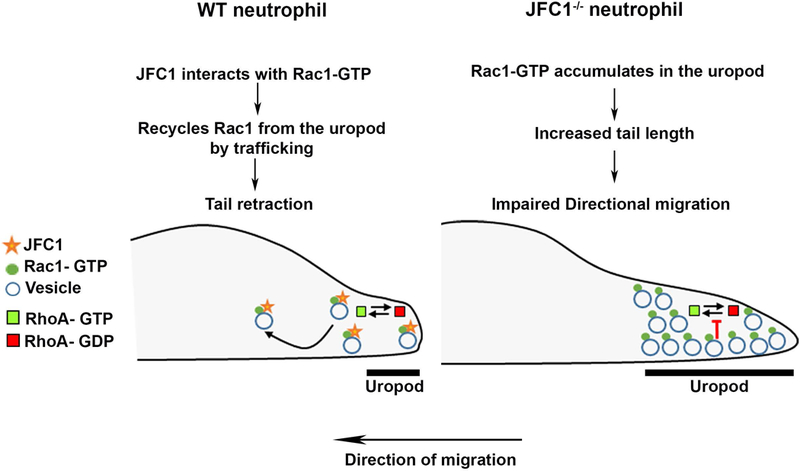
Neutrophil chemotaxis is essential in responses to infection and underlies inflammation. In neutrophils, the small GTPase Rac1 has discrete functions at both the leading edge and in the retraction of the trailing structure at the cell's rear (uropod), but how Rac1 is regulated at the uropod is unknown. Here, we identified a mechanism mediated by the trafficking protein synaptotagmin-like 1 (SYTL1 or JFC1) that controls Rac1-GTP recycling from the uropod and promotes directional migration of neutrophils. JFC1-null neutrophils displayed defective polarization and impaired directional migration to N-formyl-methionine-leucyl-phenylalanine in vitro, but chemoattractant-induced actin remodeling, calcium signaling and Erk activation were normal in these cells. Defective chemotaxis was not explained by impaired azurophilic granule exocytosis associated with JFC1 deficiency. Mechanistically, we show that active Rac1 localizes at dynamic vesicles where endogenous JFC1 colocalizes with Rac1-GTP. Super-resolution microscopy (STORM) analysis shows adjacent distribution of JFC1 and Rac1-GTP, which increases upon activation. JFC1 interacts with Rac1-GTP in a Rab27a-independent manner to regulate Rac1-GTP trafficking. JFC1-null cells exhibited Rac1-GTP accumulation at the uropod and increased tail length, and Rac1-GTP uropod accumulation was recapitulated by inhibition of ROCK or by interference with microtubule remodeling. In vivo, neutrophil dynamic studies in mixed bone marrow chimeric mice show that JFC1-/- neutrophils are unable to move directionally toward the source of the chemoattractant, supporting the notion that JFC1 deficiency results in defective neutrophil migration. Our results suggest that defective Rac1-GTP recycling from the uropod affects directionality and highlight JFC1-mediated Rac1 trafficking as a potential target to regulate chemotaxis in inflammation and immunity.

Keywords: JFC1; Rac1; chemotaxis; neutrophils; vesicular trafficking.


Conflict of interest statement

Competing financial interests: The authors declare that they have no conflicts of interest with the contents of this article.

Figures

FIGURE 1:
FIGURE 1:. Directional migration is defective in JFC1−/− neutrophils.
(a-l) WT or JFC1−/− mouse bone marrow neutrophils were analyzed in chemotaxis using collagen-coated ibidi μ-slide chemotaxis chambers. Gradients were generated using 10 μM fMLF (a-f) or 25 μM fMLF (g-l) at the chemoattractant reservoir, which produces 0 to 10 or 25 μM fMLF gradients at 30 minutes (see methods and results sections). Cell movement was recorded at 2 min intervals for 1 hour and tracks for the cells were mapped using the Manual Tracking plug-in of ImageJ software. The forward migration index (efficiency of directed cell migration) (a and g), mean velocity (b and h), distance migrated (c and i) and persistence (d and j) were calculated using the Chemotaxis and Migration Tool software (Ibidi). The results are expressed as mean ± SEM from at least 3 independent experiments (n=6 for a-d and n=3 for g-j), *p<0.05; NS, not significant. (e, f, k and l) Data showing tracks of cell migration from one representative experiment. Distance from the origin is indicated on x and y axes in μm. The direction of the chemotactic gradient is indicated with green triangles.
FIGURE 2:
FIGURE 2:. JFC1−/− neutrophils exhibit decreased polarization index upon fMLF stimulation and the defect is independent of impaired exocytosis.
Mouse bone marrow neutrophils from WT and JFC1−/− mice were left unstimulated or stimulated with either 10nM, 100nM or 1μM fMLF for 10 min at 37° C, followed by fixation and staining with phalloidin-488. The length to width ratio of the cells were quantified using ImageJ software. (a) Representative images of unstimulated cells or cells stimulated with 100nM fMLF for 10 min. The scale bar represents 10μm. (Larger fields are shown in Supplementary Fig. S2a). (b) The elongation index of WT vs JFC1−/− cells calculated as the length to width ratio of the cell is indicated as mean ± SEM and was determined from 6 WT and 6 JFC1−/− mice. A minimum of 50 cells were measured from each mouse. A representative cell for WT and JFC1−/− neutrophils for each condition is shown. Larger fields can be seen in supplementary figure 2. **** p< 0.0001; NS, not significant. (c) Mouse bone marrow neutrophils from WT (shown in black) or JFC1−/− (shown in red) neutrophils were isolated and stimulated with the either 10nM, 100nM, 1μM or 10μM fMLF for 10 min at 37 °C, and myeloperoxidase (MPO) in the cell supernatants was determined by ELISA. Data are represented as mean ± SEM, (n=6). Each symbol represents an individual mouse. *p<0.05; NS, not significant.
Figure 3:
Figure 3:. F-actin dynamics and calcium release upon fMLF stimulation are unaffected in JFC1−/− neutrophils.
(a-f) Quantitative analysis of actin remodeling. Mouse bone marrow neutrophils from WT or JFC1−/− mice were left unstimulated (a, b) or were stimulated with either 10nM (c), 100nM (d), 1μM (e) or 10μM (f) fMLF for the indicated times at 37° C. The cells were then fixed, actin stained using Phalloidin-488 and the cells were analyzed by flow cytometry. The mean fluorescence intensity was calculated using FlowJo software. a. Representative histogram showing the basal F-actin levels in WT and JFC1−/− neutrophils. b. Quantitative analysis of the basal F-actin levels in WT vs JFC1−/− neutrophils. Mean ± SEM from 8 mice, * p<0.05. (c-f) Time course of actin polymerization at the indicated fMLF concentration. Data are indicated as mean ± SEM from 3 WT (shown in black) and 3 JFC1−/− (shown in red) mice. * p<0.05, ** p<0.01, *** p<0.001, **** p< 0.0001. (g-k) Quantitative analysis of calcium flux. Mouse bone marrow neutrophils were seeded onto poly D-lysine coated plates and loaded with Fluo8, a fluorescent calcium sensitive indicator for 30 min. Calcium levels were measured by monitoring the fluorescence intensity at Ex/Em = 490/525 nm using the FLIPR-384 system over time. fMLF was added at the 150 sec time point after beginning the read. Mean ± SEM from 3 WT (shown in black) and 3 JFC1−/− (shown in red) mice. (l) Western blot analysis of neutrophil signaling in response to fMLF activation. Mouse bone marrow neutrophils from WT or JFC1−/− mice were left unstimulated or were stimulated with either 50 nM, 100 nM, 500 nM, 1 μM or 10 μM fMLF for 2 minutes at 37° C. Immunoblots are representative of four independent experiments. (m) Quantification of Erk phosphorylation was performed by densitometry. The intensity of phosphorylated Erk was normalized to that of total Erk to calculate relative p-Erk levels. Data are represented as mean ± SEM from an n=4 mice.
FIGURE 4:
FIGURE 4:. Active Rac1 colocalizes with JFC1 in a fMLF-dependent manner
(a) The distribution of Rac1-Q61L transfected into primary WT or JFC1−/− neutrophils was analyzed by TIRF microscopy. Upper panels, representative images of unstimulated neutrophils are shown and representative dynamic studies are presented in supplementary movies S5 and S6. Lower panels, representative images of fMLF-stimulated neutrophils are shown. The white arrows point to the uropods of these cells showing accumulation of Rac1-Q61L-GFP in JFC1−/− but not in wild type neutrophils. Scale bars: 5 μm. (b) Immunofluorescence analysis of endogenous JFC1 (red) and Rac1-GTP (green) in neutrophilic-differentiated HL60 cells. Arrowheads indicate examples of vesicles that are positive for both JFC1 and Rac1 at the uropod and back body. Scale bar, 5 μm. (c) Super-resolution microscopy analysis (STORM) of the localization of endogenous JFC1 and Rac1-GTP in neutrophilic-differentialted HL60 cells. JFC1 and Rac1-GTP are detected adjacent to each other (arrowheads <50 nm apart) compatible with putative, in situ, protein-protein interaction; Scale bar, 5 μm. (d) Quantification of the super-resolution microscopy analysis showing the distance between JFC1 and Rac1-GTP centroids was performed as described under “Materials and Methods” and results are expressed as a percentage of total pairs at <50nm distance for each cell. A total of at least 10,000 JFC1 and Rac1-GTP pairs were analyzed from at least 4 individual cells. Mean ± S.E.M, **, p < 0.01, ***, p<0.001.(e) Chemotactic responses of wild type (WT, black bars) or JFC1−/− (red bars) neutrophils in response to the CXC chemokines CXCL2 and KC. Mean ± SEM, n=6 mice analyzed independently in two independent experiments. NS, non-stimulated.
FIGURE 5:
FIGURE 5:. JFC1 interacts with active Rac1 in a Rab27a-independent manner
(a) Coimmunoprecipitation analysis of the JFC1-Rac1 interaction. Cells were transfected with myc-JFC1 and with either WT Rac1-GFP, the constitutively active Rac1 Q61L-GFP or the dominant negative Rac1 T17N-GFP. Cell lysates were used in pulldown assays, carried out using anti-myc antibodies and magnetic beads. Western blots are representative of at least three experiments with similar results. (b) Densitometric quantification of the immunoprecipitated bands from 3 independent experiments using the ImageJ software. The data is represented as mean ± SEM. ** p< 0.01. (c) Pulldown experiments were performed in cells transfected with GFP-Rac1Q61L with either wild type myc-JFC1 or with the point mutant myc-JFC1-W83S, which lacks binding to Rab27a. (d) Pulldown experiments were performed in cells transfected with EGFP-Rab27a with either myc-JFC1 WT or with the myc-JFC1-W83S mutant.
FIGURE 6:
FIGURE 6:. JFC1−/− neutrophils show increased Rac1-GTP tail length and accumulation of Rac1-GTP at the uropod.
(a-e) Comparative quantitative analysis of the localization of endogenous active Rac1 in stimulated wild type and JFC1−/− neutrophils. (a) Quantitative analysis of total Rac1-GTP in neutrophils isolated from WT and JFC1−/− mice after stimulation with 100nM fMLF for 10 min at 37 °C. Active Rac1 was quantified using an antibody specific for the GTP bound form of Rac1 as described under “Material and Methods” and Rac1-GTP fluorescence intensity in the whole cell was analyzed using ImageJ. The data is indicated as mean± SEM of the arbitrary fluorescent units from an n=3 mice. (b) Representative images of WT and JFC1−/− cells showing Rac1-GTP accumulation in the tail upon fMLF stimulation for 10 min. (c) The length of Rac1-GTP uropods was analyzed using the ImageJ software. The data is expressed as mean ± SEM from a total of 180 cells from 3 independent experiments. (d) The % of total Rac1-GTP accumulated in the tail for each cell was calculated from the fluorescent intensity of Rac1-GTP in the uropod relative to the whole cell, measured using the ImageJ software. (e) The tail area was measured and Rac1 tail intensity per unit area was calculated using ImageJ. (c-e). WT (black circles); JFC1−/− (red triangles). Data are represented as mean ± SEM and were obtained from an n=4 mice. *** p<0.001, **** p<0.0001. (f-k) Effects of microtubule disruption (f-h) or ROCK inhibition (i-k) on the distribution of endogenous active Rac1 in WT neutrophils. Isolated neutrophils were seeded onto glass coverslips for 30 min, treated with the indicated inhibitors and stimulated with 100nM fMLF for 10 min at 37 °C. Active Rac1 was quantitatively analyzed by confocal microscopy as described above. (f) Representative image of WT and JFC1−/− cells showing Rac1-GTP accumulation in the tail upon treatment with 10μM Nocadozole followed by fMLF stimulation. (g) Percentage of total cells expressing Rac1-GTP-positive tails. (h) % of total (whole cell) Rac1-GTP accumulated in the tail for each Nocodazole- or vehicle-treated cell. (i) Representative images of WT and JFC1−/− cells showing Rac1-GTP accumulation in the tail upon treatment with 10μM Y27632 prior to fMLF stimulation. (j) The length of the Rac1-GTP tails in vehicle vs Y27632-treated cells. The data is expressed as mean ± SEM obtained from 3 independent experiments. (k) Percentage of total Rac1-GTP accumulated at the uropods of Y27632 or vehicle treated cells. n=3 mice. Mean ± SEM. (l) Quantitative analysis of RhoA activity in wild type (WT) and JFC1−/− neutrophils that have been left untreated (NS) or stimulated with fMLF for 30 seconds (30”) or for 3 minutes (3’). Mean ± SEM, n=3. *, p<0.05.
Figure 7:
Figure 7:. In vivo directional migration is defective in JFC1−/−chimeric mice
(a) Schematic depiction showing the technique used for the generation of the mixed bone-marrow chimera mice. Bone marrow chimera mice with 1:1 ratio of DsRed labeled wild type and either non-fluorescent WT or JFC1−/− bone marrow were prepared. The host CD45.1 male mice were irradiated and then retro-orbitally injected with 1:1 mixture of wild type and knock out bone marrow isolated under sterile conditions from leg bones of CD45.2 male donor mice. To compare the fMLF induced chemotaxis of wild type and JFC1−/− neutrophils, cremaster muscle imaging was performed on the chimera mice. At about 50 μm distance from a venule 1 μl of 10 μM fMLF was microinjected into the muscle with a glass canule. WT and JFC1−/− leukocytes were imaged using far red oblique illumination and RFP epifluorescence imaging was used to identify the wild type neutrophils. Cell tracks were traced using the Manual Tracking plugin in ImageJ. (b) Representative image showing the migration vectors of the WT cells in red arrows and the JFC1−/− cells in green arrows. The point of fMLF injection is indicated by the yellow arrowhead (movie S7) (c) The ratio of the displacement of the cell from the starting position to the displacement required to reach the glass canule tip where the fMLF was injected is shown. The velocity of migration (d) and distance migrated (e) were calculated using the Chemotaxis and Migration Tool software (Ibidi). Each symbol represents an individual cell and the data was obtained from 2 independent experiments. All values are expressed as mean ± SEM. (f) Neutrophil counts in the chimeric mice were measured by FACS analysis. The data is expressed as mean ± SEM from an n of at least 8 mice. (g) Peripheral blood was collected from WT and JFC1−/− mice in EDTA-coated capillary tubes. Complete blood cell counts were obtained using a Hemavet Hematology analyzer. Blood neutrophil counts are expressed as mean ± SEM from 7 WT and 7 JFC1−/− mice.
Figure 8:
Figure 8:. Model for JFC1-mediated control of neutrophil chemotaxis through the regulation of Rac1-GTP trafficking.
A schematic representation showing a proposed model for the sequence of events in a WT vs a JFC1−/− neutrophil. In a WT neutrophil the interaction of JFC1 with Rac1-GTP allows trafficking of Rac1-GTP, thus preventing its accumulation in the uropod and allowing for RhoA cyclic activation and subsequent tail retraction (left panel). In contrast, in a JFC1−/− neutrophil, Rac1-GTP, a proposed negative regulator of RhoA (52) but also suggested to positively regulate uropod-localized RhoA activity (13), accumulates in the uropod, affecting RhoA-activation-deactivation cycling, and causing increased uropod length and thus impaired directional migration (right panel).

Similar articles

Cited by

References

    1. Wang F (2009) The signaling mechanisms underlying cell polarity and chemotaxis. Cold Spring Harbor perspectives in biology 1, a002980. - PMC - PubMed
    1. Pertz O (2010) Spatio-temporal Rho GTPase signaling - where are we now? J Cell Sci 123, 1841–1850 - PubMed
    1. Wong CH, Heit B, and Kubes P (2010) Molecular regulators of leucocyte chemotaxis during inflammation. Cardiovascular research 86, 183–191 - PubMed
    1. Lakschevitz FS, Visser MB, Sun C, and Glogauer M (2015) Neutrophil transcriptional profile changes during transit from bone marrow to sites of inflammation. Cell Mol Immunol 12, 53–65 - PMC - PubMed
    1. Sun R, Iribarren P, Zhang N, Zhou Y, Gong W, Cho EH, Lockett S, Chertov O, Bednar F, Rogers TJ, Oppenheim JJ, and Wang JM (2004) Identification of neutrophil granule protein cathepsin G as a novel chemotactic agonist for the G protein-coupled formyl peptide receptor. J Immunol 173, 428–436 - PubMed

Publication types

MeSH terms