

Geographic disparities in liver supply/demand ratio within fixed-distance and fixed-population circles
- PMID: 30748095
- PMCID: PMC6591030
- DOI: 10.1111/ajt.15297
Geographic disparities in liver supply/demand ratio within fixed-distance and fixed-population circles
Abstract
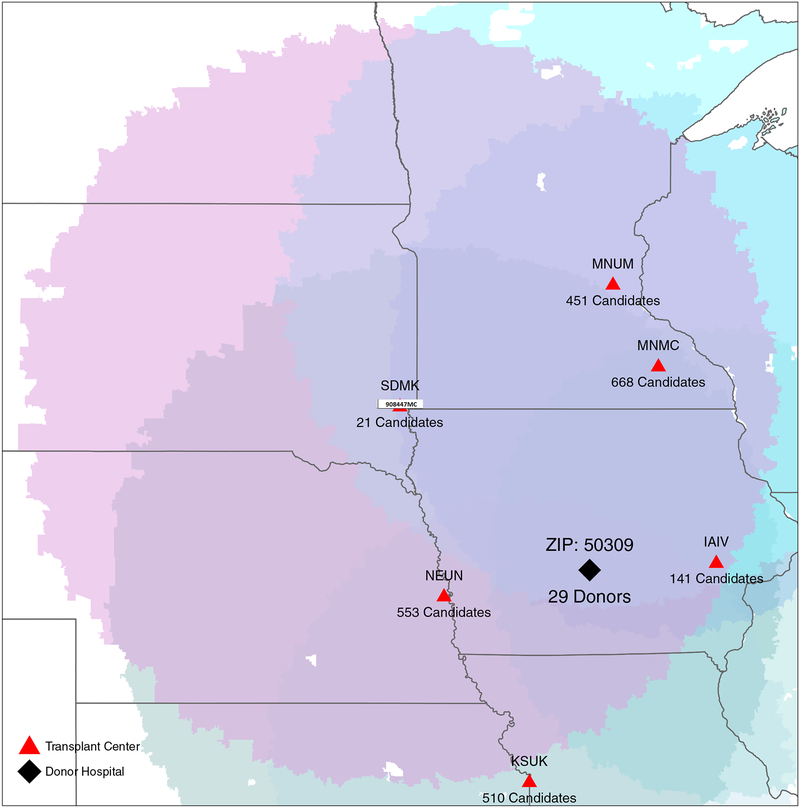
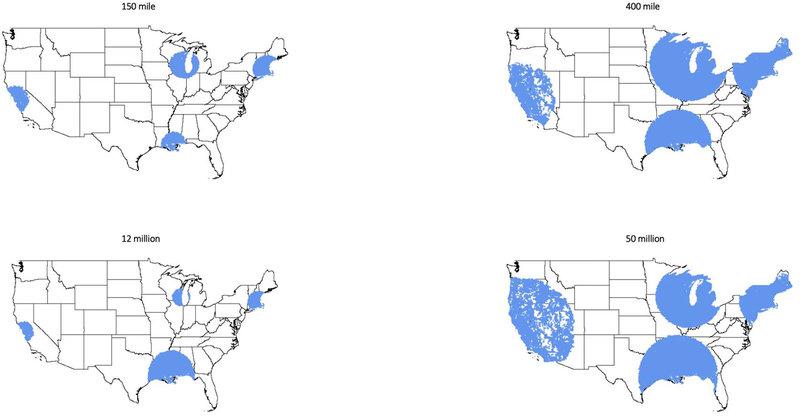
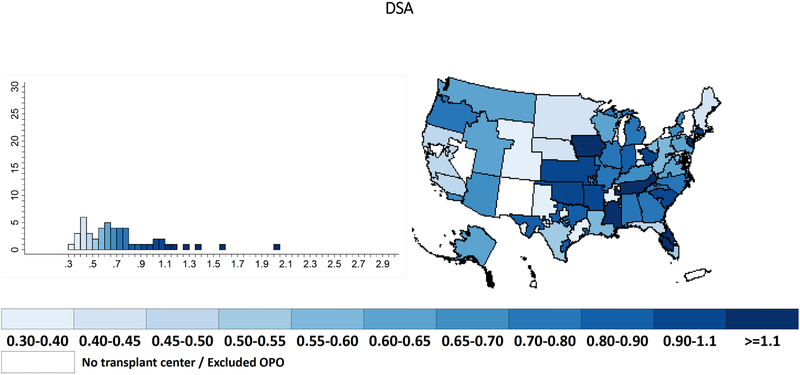
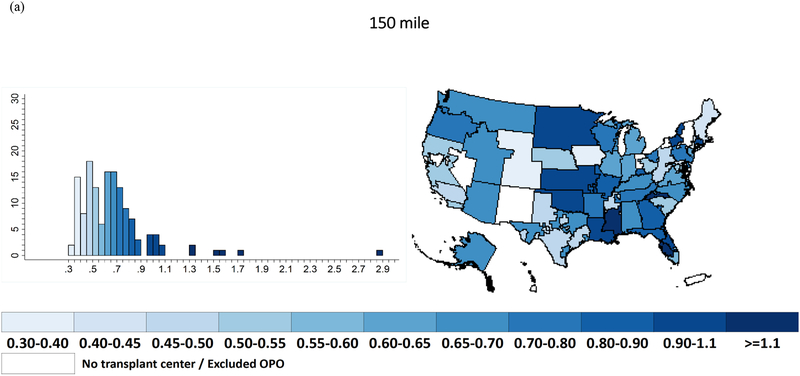
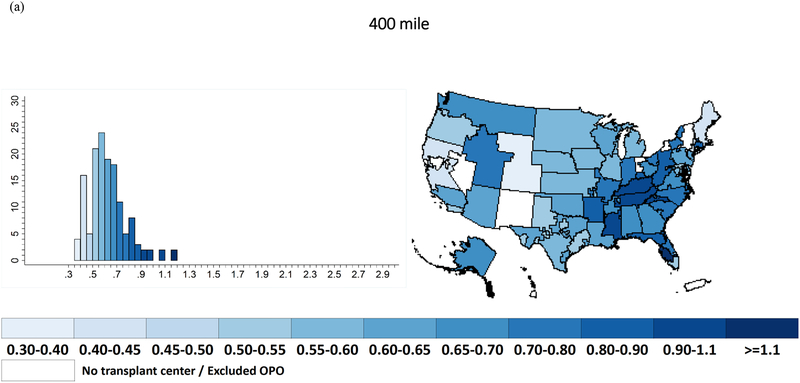
Recent OPTN proposals to address geographic disparity in liver allocation have involved circular boundaries: the policy selected 12/17 allocated to 150-mile circles in addition to DSAs/regions, and the policy selected 12/18 allocated to 150-mile circles eliminating DSA/region boundaries. However, methods to reduce geographic disparity remain controversial, within the OPTN and the transplant community. To inform ongoing discussions, we studied center-level supply/demand ratios using SRTR data (07/2013-06/2017) for 27 334 transplanted deceased donor livers and 44 652 incident waitlist candidates. Supply was the number of donors from an allocation unit (DSA or circle), allocated proportionally (by waitlist size) to the centers drawing on these donors. We measured geographic disparity as variance in log-transformed supply/demand ratio, comparing allocation based on DSAs, fixed-distance circles (150- or 400-mile radius), and fixed-population (12- or 50-million) circles. The recently proposed 150-mile radius circles (variance = 0.11, P = .9) or 12-million-population circles (variance = 0.08, P = .1) did not reduce the geographic disparity compared to DSA-based allocation (variance = 0.11). However, geographic disparity decreased substantially to 0.02 in both larger fixed-distance (400-mile, P < .001) and larger fixed-population (50-million, P < .001) circles (P = .9 comparing fixed distance and fixed population). For allocation circles to reduce geographic disparities, they must be larger than a 150-mile radius; additionally, fixed-population circles are not superior to fixed-distance circles.
Keywords: Organ Procurement and Transplantation Network (OPTN); clinical research/practice; donors and donation: deceased; liver transplantation/hepatology; organ allocation.
© 2019 The American Society of Transplantation and the American Society of Transplant Surgeons.
Conflict of interest statement
Disclosure
Authors have no conflict of interest to report as described by
Figures
References
-
- Croome KP, Lee DD, Burns JM, Keaveny AP, Taner CB. Intraregional model for end-stage liver disease score variation in liver transplantation: Disparity in our own backyard. Liver transplantation: official publication of the American Association for the Study of Liver Diseases and the International Liver Transplantation Society 2018;24(4):488–496. - PubMed
-
- Dzebisashvili N, Massie AB, Lentine KL, Schnitzler MA, Segev D, Tuttle-Newhall J et al. Following the organ supply: assessing the benefit of inter-DSA travel in liver transplantation. Transplantation 2013;95(2):361–371. - PubMed
Publication types
MeSH terms
Grants and funding
LinkOut - more resources
Full Text Sources
Medical
