. 2019 Mar 21;4(6):e123672.
doi: 10.1172/jci.insight.123672.

Systematic testing and specificity mapping of alloantigen-specific chimeric antigen receptors in regulatory T cells

Affiliations

Systematic testing and specificity mapping of alloantigen-specific chimeric antigen receptors in regulatory T cells

Nicholas Aj Dawson et al. JCI Insight. .

Abstract

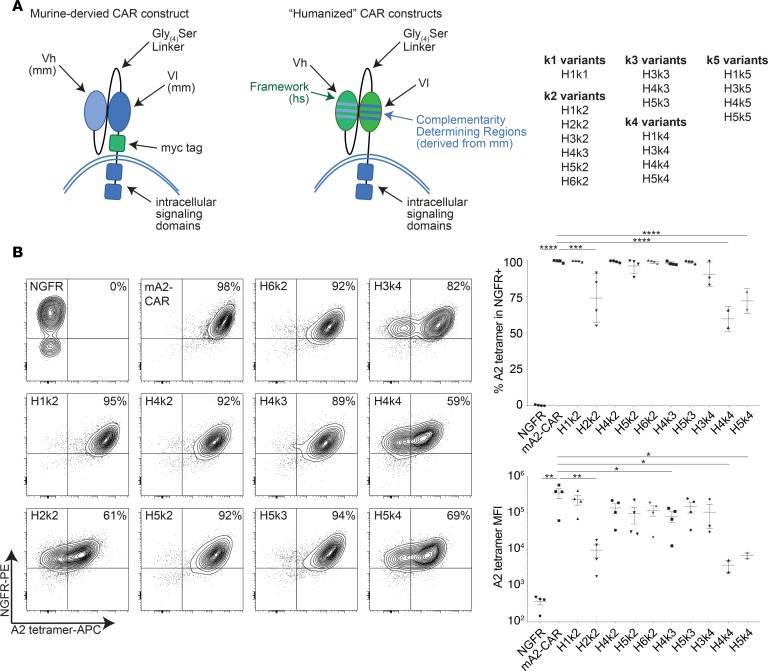
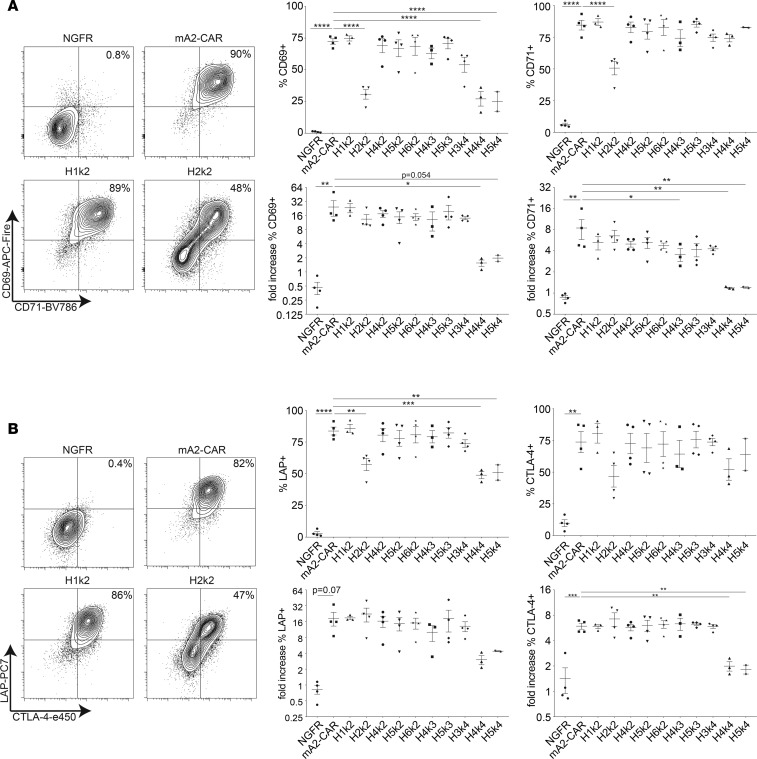
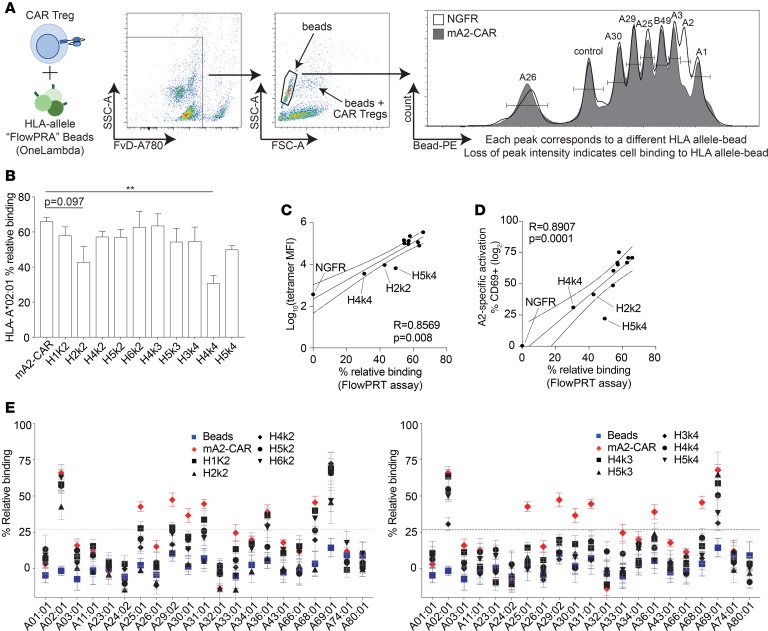
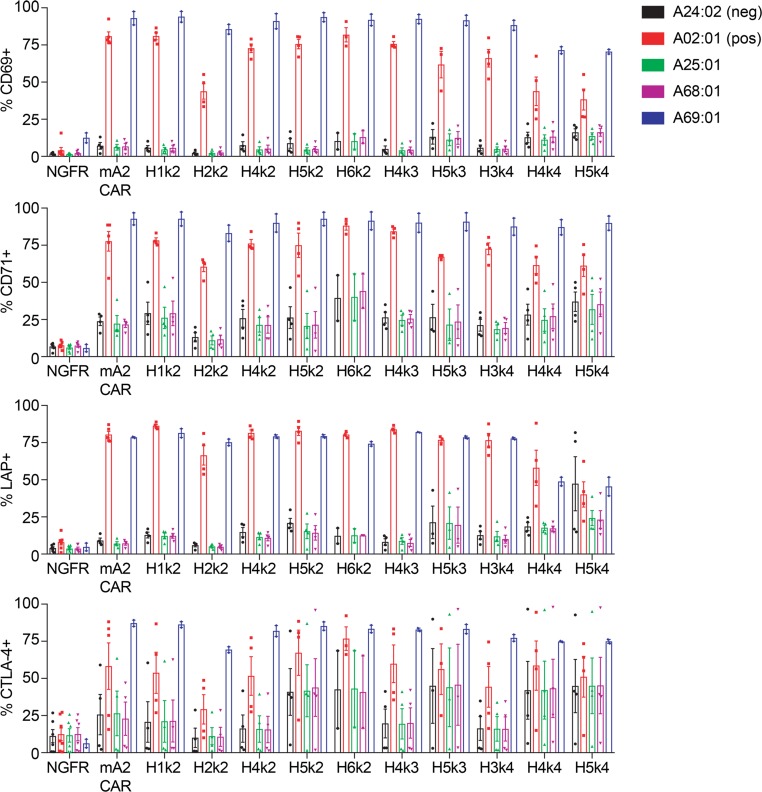
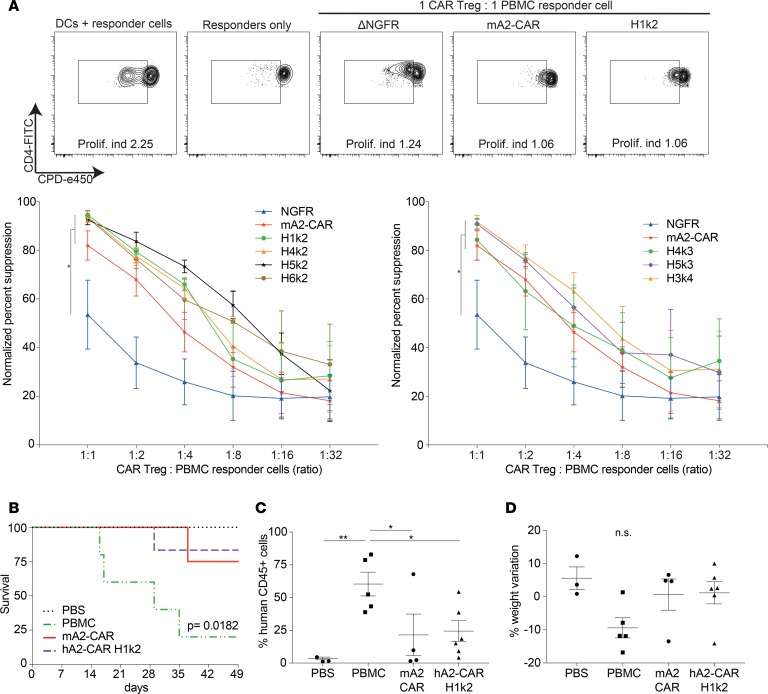
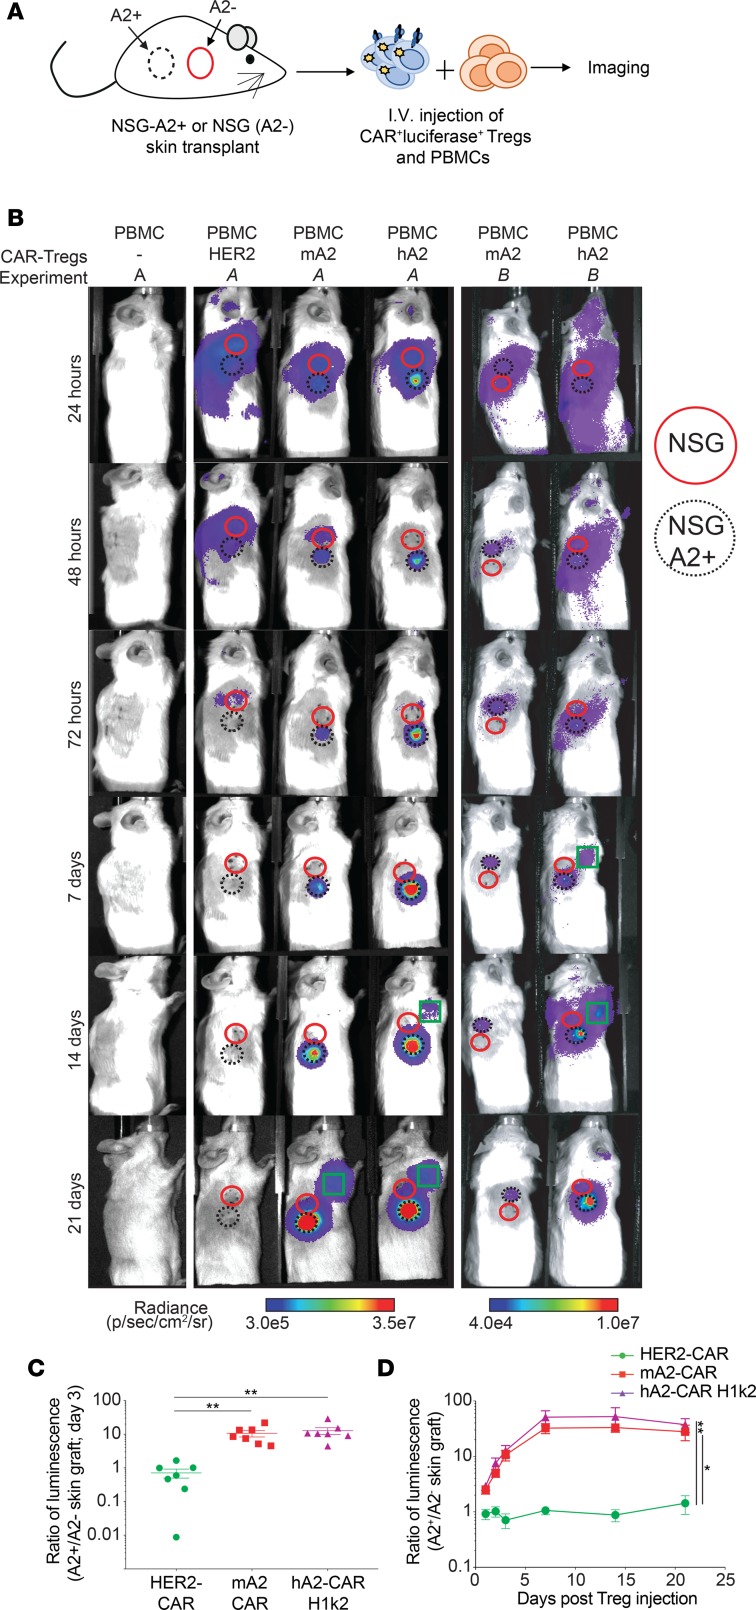
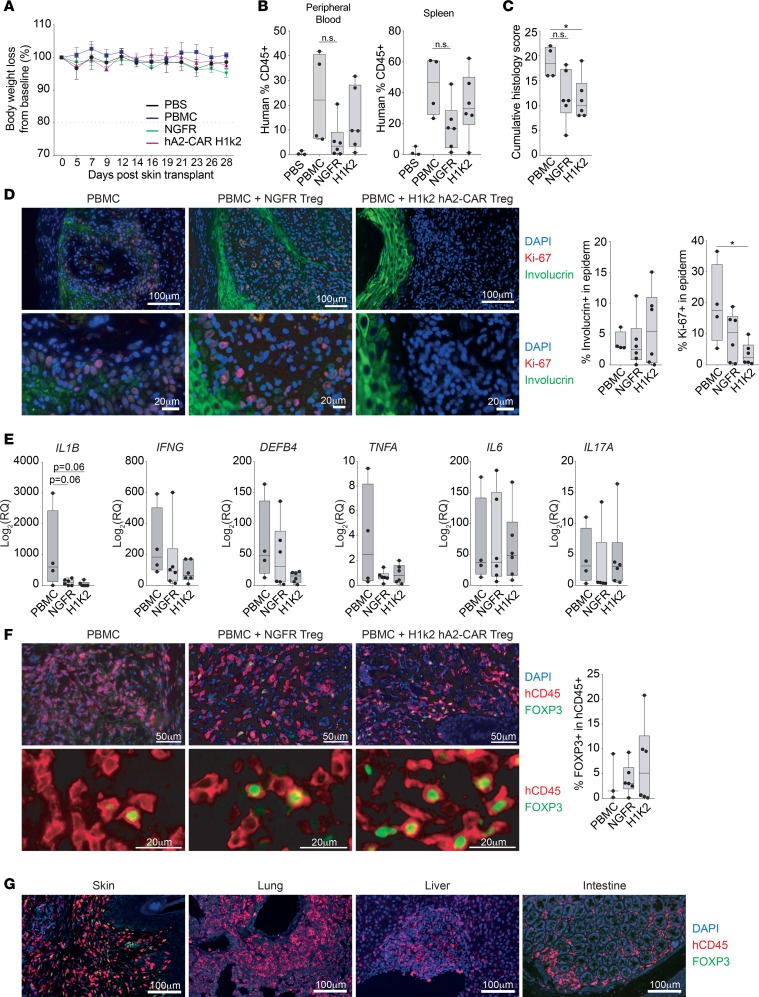
Chimeric antigen receptor (CAR) technology can be used to engineer the antigen specificity of regulatory T cells (Tregs) and improve their potency as an adoptive cell therapy in multiple disease models. As synthetic receptors, CARs carry the risk of immunogenicity, particularly when derived from nonhuman antibodies. Using an HLA-A*02:01-specific CAR (A2-CAR) encoding a single-chain variable fragment (Fv) derived from a mouse antibody, we developed a panel of 20 humanized A2-CARs (hA2-CARs). Systematic testing demonstrated variations in expression, and ability to bind HLA-A*02:01 and stimulate human Treg suppression in vitro. In addition, we developed a new method to comprehensively map the alloantigen specificity of CARs, revealing that humanization reduced HLA-A cross-reactivity. In vivo bioluminescence imaging showed rapid trafficking and persistence of hA2-CAR Tregs in A2-expressing allografts, with eventual migration to draining lymph nodes. Adoptive transfer of hA2-CAR Tregs suppressed HLA-A2+ cell-mediated xenogeneic graft-versus-host disease and diminished rejection of human HLA-A2+ skin allografts. These data provide a platform for systematic development and specificity testing of humanized alloantigen-specific CARs that can be used to engineer specificity and homing of therapeutic Tregs.

Keywords: Immunology; Immunotherapy; Organ transplantation; Tolerance; Transplantation.


Conflict of interest statement

Conflict of interest: The authors of this manuscript have received research funding from TxCell SA to partially support this work. Patents based on this work have been filed (PCT/CA2018/051167 and PCT/CA2018/051174).

Figures

Figure 1
Figure 1. Expression of a panel of hA2-CARs on human Tregs.
(A) Schematic representation of CAR humanization. CDRs from the BB7.2-derived scFv were determined using Kabat or Chothia definitions for each heavy and light chain and grafted onto suitable human framework sequences. mm, Mus musculus; hs, Homo sapiens. (B) Human Tregs were transduced with lentivirus encoding the indicated constructs. After 7 days of expansion, the ability of ΔNGFR+ cells to bind to HLA-A*02:01 tetramers was measured by flow cytometry. Left: Representative flow cytometry plots. Right: Summarized data of percent or MFI of A*02:01-tetramer binding. Data represent n = 2–4 for each construct pooled from at least 2 independent experiments. Mean ± SEM. *P < 0.05, **P < 0.01, ***P < 0.001, ****P < 0.0001.
Figure 2
Figure 2. In vitro function of a panel of hA2-CARs on human Tregs.
(A and B) ΔNGFR control/CAR Tregs were cocultured with a 2:1 (Tregs: K562) ratio of HLA-A2–expressing K562 cells. After 16 hours, expression of CD69, CD71, CTLA-4, and LAP was measured by flow cytometry. (A) Percent positive and fold increase over baseline (no K562; Supplemental Figure 3B) expression of CD69 and CD71. (B) Percent positive and fold increase over baseline (no K562; Supplemental Figure 3B) expression of CTLA-4 and LAP. Data represents n = 2–4 for each construct pooled from at least 2 independent experiments. One-way ANOVA and Holm-Šídák post hoc test comparing all constructs with mA2-CAR Tregs. Mean ± SEM. *P < 0.05, **P < 0.01, ***P < 0.001, ****P < 0.0001.
Figure 3
Figure 3. Cross-reactivity of humanized anti–HLA-A2 CARs with common HLA-A allelic variants.
(A) Schematic diagram of experimental setup and gating strategy for the FlowPRT cell assay. ΔNGFR or CAR Tregs were incubated with a cocktail of single HLA FlowPRA beads for 30 minutes, and bead-CAR Treg interactions were quantified as the loss of beads in a bead singlet gate based on FSC/SSC profile. (B) Binding to HLA-A*02:01–coated beads for each m/hA2-CAR Treg relative to binding of a ΔNGFR Treg control. Statistical significance determined by 1-way ANOVA and Holm-Šídák post hoc test comparing with mA2-CAR; mean ± SEM; **P < 0.01. (C and D) Correlation between the mean of HLA-A*02:01 binding measured by the FlowPRT cell assay and either (C) HLA-A*02:01 tetramer MFI evaluated by flow cytometry or (D) increase in the proportion of CD69+ cells 16 hours after coculture with HLA-A*02:01 versus negative control HLA-A*24:01 K562 cells. (E) Percent binding of each m/hA2-CAR Treg to the indicated HLA-A alleles after normalization to an ΔNGFR Treg control from the same donor. Dotted line represents 2 SDs from the mean of the bead-only control. For a summary of statistical results in E, see Supplemental Table 1. n = 3–6 from at least 3 independent experiments.
Figure 4
Figure 4. Functional cross-reactivity of a panel of hA2-CAR constructs in human Tregs.
ΔNGFR or m/hA2-CAR Tregs were cocultured with K562 cells transduced to express the indicated HLA-A alleles. After 16 hours, expression of CD69, CD71, LAP, and CTLA-4 was measured on live CD4+ T cells. n = 2–6 pooled from at least 2 independent experiments, mean ± SEM.
Figure 5
Figure 5. hA2-CAR Tregs are suppressive in vitro and in a model of xenogeneic GvHD in vivo.
(A) Cell proliferation dye-e450–labeled (CPD-e450–labeled) HLA-A2neg CD4+ “responder” T cells were stimulated with a 1:1 ratio of mature HLA-A2+ dendritic cells in the absence/presence of varying ratios of the indicated CPD-e660–labeled control or m/hA2-CAR Tregs. After 6 days, the amount of proliferation of the CPD-e450–labeled CD4+ responder T cells was measured by flow cytometry. Top: representative data and gating strategy, with proliferation index (Prolif. index). Bottom: average data for n = 3–7 pooled from at least 3 independent experiments. Statistics were performed using a 2-way ANOVA with Holm-Šídák post hoc test versus a ΔNGFR Treg control. *P < 0.05; mean ± SEM. (BD) Irradiated NSG mice were injected with PBS (n = 3); HLA-A*02:01pos PBMCs alone (n = 5); HLA-A*02:01pos PBMCs and a 1:2 ratio of H1k2 hA2-CAR Tregs (n = 6); or mA2-CAR Tregs (n = 4). Data were pooled from 2 independent experiments. (B) Survival curve, log-rank (Mantel-Cox) test. (C) Human CD45+ engraftment upon experimental or humane end point (gating strategy in Supplemental Figure 7A). (D) Percent weight change at sacrifice relative to experiment start (day 49 or earlier). Statistical significance determined using a 1-way ANOVA and Holm-Šídák post hoc test; mean ± SEM. *P ≤ 0.05, **P ≤ 0.01.
Figure 6
Figure 6. Expression of m/hA2 CARs endows Tregs with rapid and persistent homing to HLA-A2:01+ skin allografts.
Tregs were cotransduced with lentivirus encoding luciferase and either a control HER2-CAR, mA2-CAR, or hA2-CAR (H1k2) and expanded for 7 days. Dual transduced cells were FACS sorted, expanded for 5 more days, then injected into NSG mice that had previously been transplanted with juxtaposed skin transplants from both NSG and NSG-HLA-A*02:01 transgenic mice. (A) Schematic representation of the experimental setup. (B) Representative luciferase imaging of skin grafts from 2 different experiments (A and B) at the indicated time points after Treg injection. Red solid circle denotes location of NSG skin graft; black dotted circle denotes location of A2-positive NSG skin graft; green square denotes location of draining lymph node with a visually detectable luciferase signal. Amount of luciferase radiance was quantified using the average amount of photons/s/cm2/steradian and plotted as a ratio between the HLA-A*02:01-NSG and NSG skin grafts (C) 72 hours after Treg injection or (D) over time. n = 6–7 per group pooled from 3 independents experiments; mean ± SEM. Repeated-measures ANOVA with Bonferroni’s correction. *P < 0.05, **P < 0.01.
Figure 7
Figure 7. hA2-CAR Tregs diminish human skin allograft rejection.
NSG mice were transplanted with HLA-A*02:01+ human skin and injected 6 weeks later with either PBS (n = 3), or HLA-A*02:01neg PBMCs alone (n = 4) or with a 2:1 ratio of autologous H1k2 hA2-CAR Tregs (H1k2, n = 6) or ΔNGFR Tregs (n = 6). PBMCs/hA2-CAR Tregs were from 2 individual donors, tested in one experiment. Mice were monitored 3 times weekly and sacrificed 28 days after cell injection for mRNA and histology assessment. (A) Body weight was monitored 3 times weekly, and (B) the proportion of human CD45+ cells in the blood (left) and spleen (right) was measured on day 28. (C) Cumulative histological score of transplanted skin sections as determined by H&E staining. (D) Transplanted skin grafts were immunostained at experiment end point to quantify the amount of involucrin expression and proportion of Ki-67+ cells in the epidermis. Scale bars: 100 μm (top row), 20 μm (bottom row). (E) mRNA expression of the indicated genes within transplanted skin sections was determined by qPCR. (F) Transplanted skin grafts harvested at the experiment endpoint were immunostained to quantify the proportion of FOXP3+ cells within human CD45+ cells. Scale bars: 50 μm (top row), 20 μm (bottom row). (G) Transplanted skin grafts, intestine, lung, and liver sections were immunostained at the experiment end point to show the proportion of FOXP3+ cells within human CD45+ cells in each tissue. Scale bars: 100 μm. Each data point represents 1 mouse. Box-and-whisker plots show mean ± range. Statistical significance determined by 1-way ANOVA comparing PBMCs with PBMCs + NGFR or H1k2. For immunofluorescence quantifications in D and F, each data point represents the average cell number counted in 18–27 fields of view from 1 section/mouse. *P < 0.05.

References

    1. Gliwiński M, Iwaszkiewicz-Grześ D, Trzonkowski P. Cell-based therapies with T regulatory cells. BioDrugs. 2017;31(4):335–347. doi: 10.1007/s40259-017-0228-3. - DOI - PMC - PubMed
    1. Dawson NAJ, Vent-Schmidt J, Levings MK. Engineered tolerance: tailoring development, function, and antigen-specificity of regulatory T cells. Front Immunol. 2017;8:1460. - PMC - PubMed
    1. Putnam AL, et al. Clinical grade manufacturing of human alloantigen-reactive regulatory T cells for use in transplantation. Am J Transplant. 2013;13(11):3010–3020. doi: 10.1111/ajt.12433. - DOI - PMC - PubMed
    1. Tang Q, Lee K. Regulatory T-cell therapy for transplantation: how many cells do we need? Curr Opin Organ Transplant. 2012;17(4):349–354. doi: 10.1097/MOT.0b013e328355a992. - DOI - PubMed
    1. Elinav E, Adam N, Waks T, Eshhar Z. Amelioration of colitis by genetically engineered murine regulatory T cells redirected by antigen-specific chimeric receptor. Gastroenterology. 2009;136(5):1721–1731. doi: 10.1053/j.gastro.2009.01.049. - DOI - PubMed

Publication types

MeSH terms

Grants and funding