. 2019 Feb 12;14(2):e0211710.
doi: 10.1371/journal.pone.0211710. eCollection 2019.

Frequency-resolved analysis of coherent oscillations of local cerebral blood volume, measured with near-infrared spectroscopy, and systemic arterial pressure in healthy human subjects

Affiliations

Frequency-resolved analysis of coherent oscillations of local cerebral blood volume, measured with near-infrared spectroscopy, and systemic arterial pressure in healthy human subjects

Kristen Tgavalekos et al. PLoS One. .

Abstract

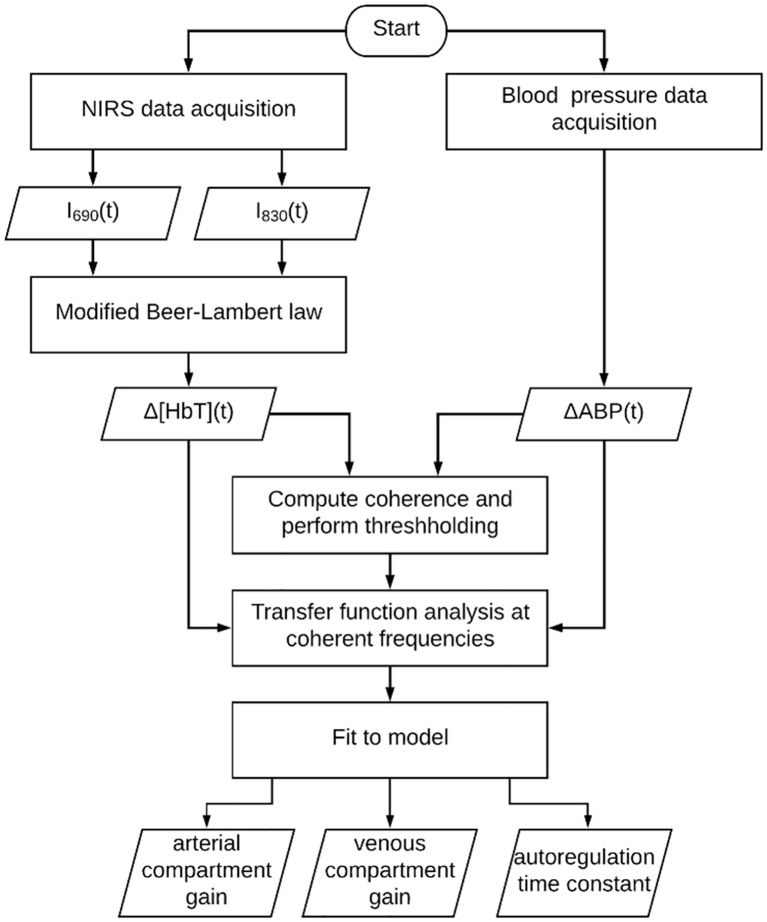
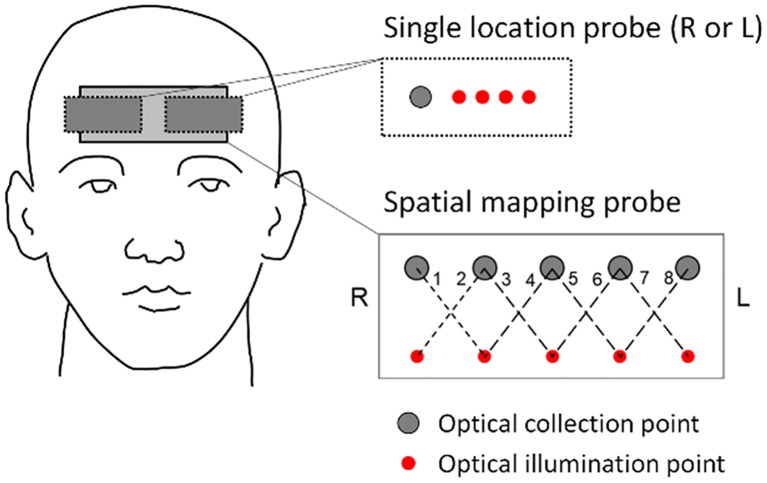
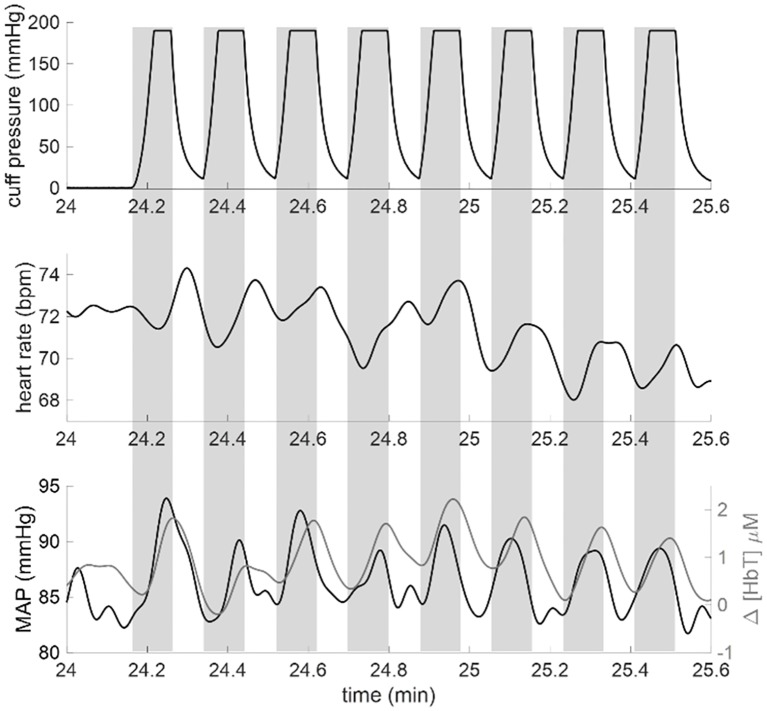
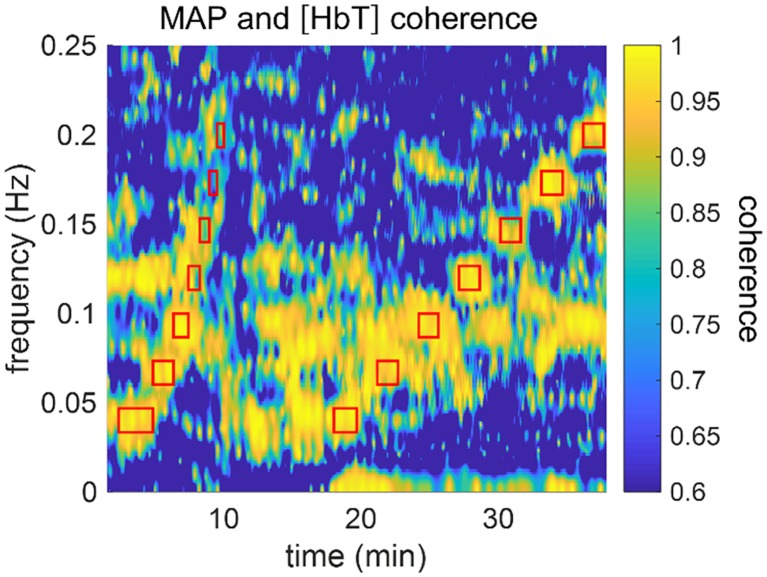
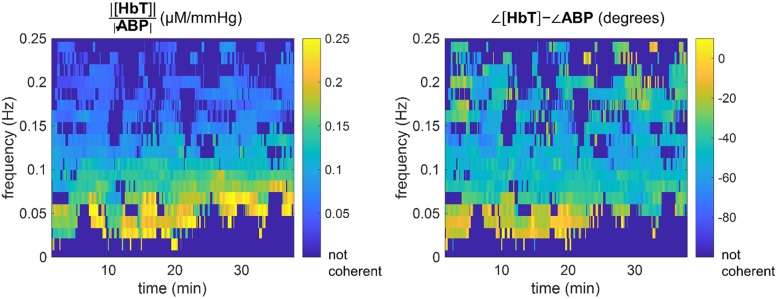
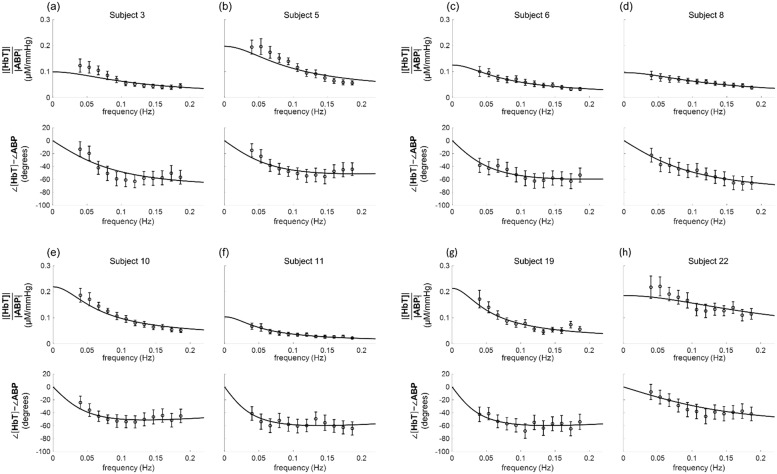
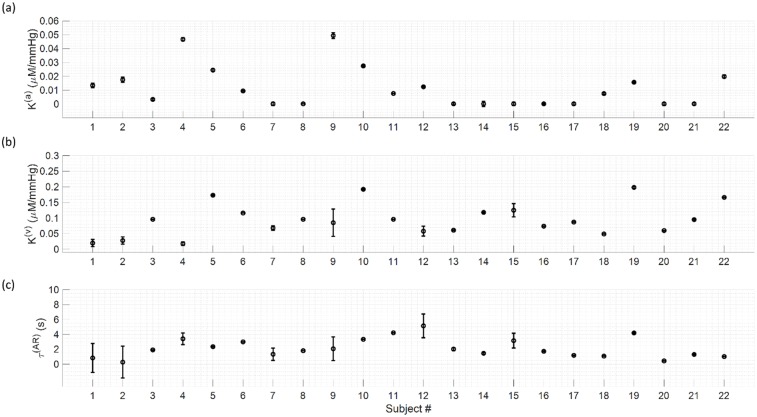
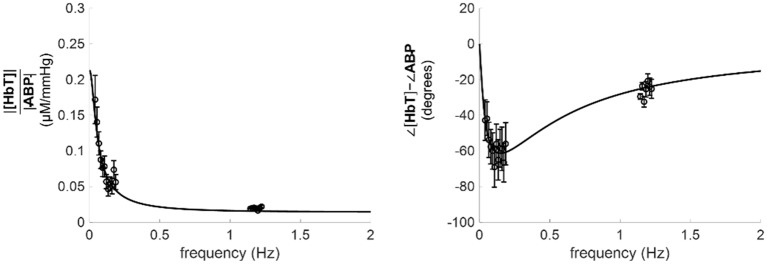
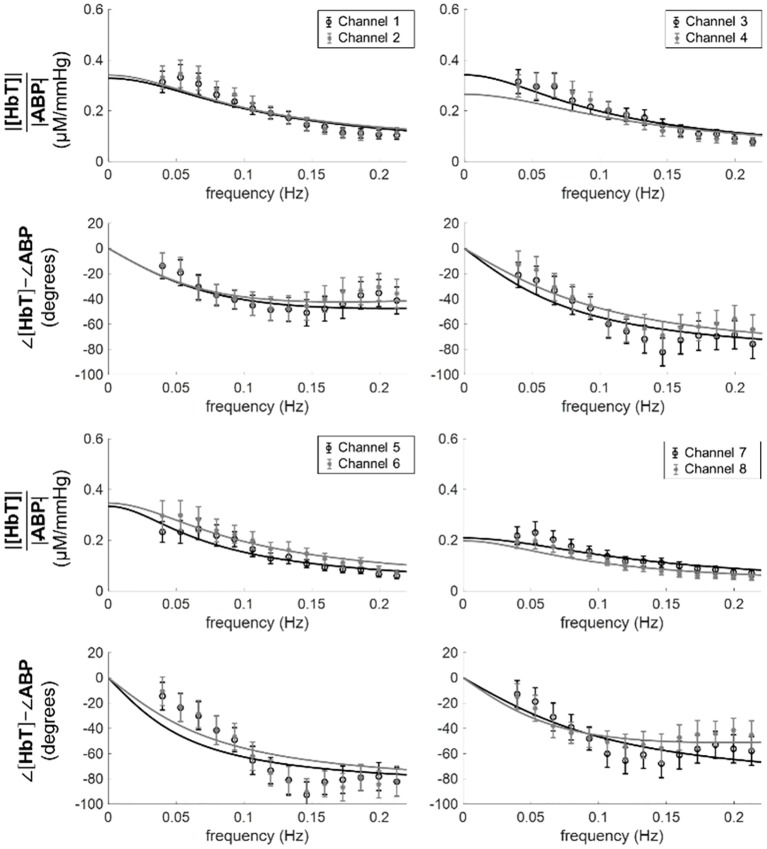
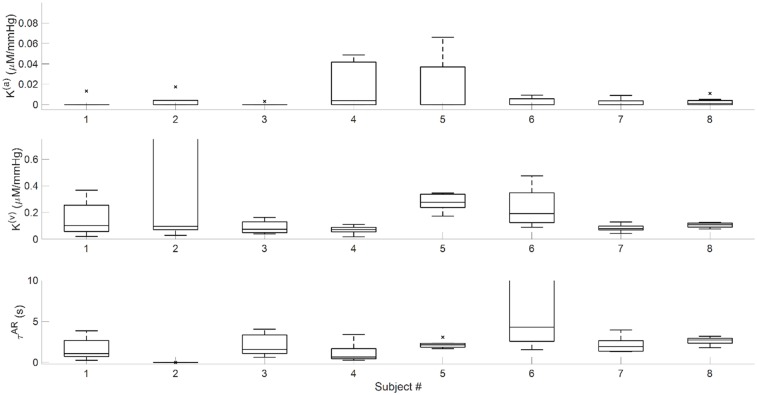
We report a study on twenty-two healthy human subjects of the dynamic relationship between cerebral hemoglobin concentration ([HbT]), measured with near-infrared spectroscopy (NIRS) in the prefrontal cortex, and systemic arterial blood pressure (ABP), measured with finger plethysmography. [HbT] is a measure of local cerebral blood volume (CBV). We induced hemodynamic oscillations at discrete frequencies in the range 0.04-0.20 Hz with cyclic inflation and deflation of pneumatic cuffs wrapped around the subject's thighs. We modeled the transfer function of ABP and [HbT] in terms of effective arterial (K(a)) and venous (K(v)) compliances, and a cerebral autoregulation time constant (τ(AR)). The mean values (± standard errors) of these parameters across the twenty-two subjects were K(a) = 0.01 ± 0.01 μM/mmHg, K(v) = 0.09 ± 0.05 μM/mmHg, and τ(AR) = 2.2 ± 1.3 s. Spatially resolved measurements in a subset of eight subjects reveal a spatial variability of these parameters that may exceed the inter-subject variability at a set location. This study sheds some light onto the role that ABP and cerebral blood flow (CBF) play in the dynamics of [HbT] measured with NIRS, and paves the way for new non-invasive optical studies of cerebral blood flow and cerebral autoregulation.


Conflict of interest statement

The authors have declared that no competing interests exist.

Figures

Fig 1
Fig 1. Flow chart of data collection and analysis.
I690(t) and I830(t) are the light intensities detected at 690 nm and 830 nm, respectively. Δ[HbT](t) is the relative change in total hemoglobin concentration. ΔABP(t) is the change in arterial blood pressure relative to baseline.
Fig 2
Fig 2. Configuration of the optical probes on the subject’s forehead.
The single location probe is placed on either the right side (R: subjects 9–12) or left side (L: subjects 13–22) of the forehead, and features four source-detector separations of 2.0, 2.5, 3.0 and 3.5 cm. The spatial mapping probe (subjects 1–8) has eight single-distance channels (numbered 1–8 in the figure) at a source-detector distance of 3.5 cm, and realizes self-calibrated absolute measurements using source-detector distances of 2.5 and 3.5 cm. The optical illumination points represent the locations where light at 690 and 830 nm is delivered to tissue.
Fig 3
Fig 3. Example time traces of induced oscillations from Subject 5.
Gray rectangles indicate the cuff inflation periods (from start of inflation to start of deflation). Top panel: Thigh cuff pressure measured with the manometer. Thigh cuffs were inflated for 11 seconds and deflated for 11 seconds to induce hemodynamic oscillations at a frequency of 0.093 Hz. Middle panel: Heart rate measured with the pulse oximeter in units of beats per minute (bpm). Bottom panel: mean arterial pressure (MAP) (black line) and total hemoglobin concentration changes (Δ[HbT], gray line). Signals in the middle panel and bottom panel have been low-pass filtered with a cut-off frequency of 0.25 Hz to suppress high-frequency noise and heart rate pulsations.
Fig 4
Fig 4. Time-frequency representation of coherence between [HbT] and MAP for subject 5, channel 8.
Red rectangles indicate timing and frequency of oscillations induced with the pneumatic thigh cuffs. The group of rectangles on the left (times <10 min) are associated with the chirp-like protocol and the group of rectangles on the right (times >18 min) are associated with oscillations of equal duration and spacing over time.
Fig 5
Fig 5. Transfer function analysis results for subject 5, channel 8.
Left panel: Amplitude ratio |[HbT]|/|ABP|, i.e. |HABP,[HbT](ω, t)|, at the coherent pixels. Right panel: Phase difference ∠[HbT] − ∠ABP, i.e. Arg[HABP,[HbT](ω, t)], at the coherent pixels. Regions of the images which are dark blue did not pass the coherence threshold condition.
Fig 6
Fig 6. Experimental data and fitted transfer functions for the [HbT]-ABP amplitude ratio and phase difference of eight representative subjects.
The symbols indicate the experimental data, the lines indicate the fitted transfer functions [represented by Eq (14)], and the error bars indicate the standard error of the mean.
Fig 7
Fig 7. Results for the fitting parameters for all twenty-two subjects.
(a): K(a); (b): K(v); (c): τ(AR).
Fig 8
Fig 8. Extension of the results for subject 19 to higher frequencies, up to 2 Hz.
Specifically, the fit lines of Fig 6(g), which result from the fit to the data at frequencies below 0.2 Hz, are extended up to a frequency of 2 Hz. The additional experimental data points at about 1.2 Hz represent cerebral [HbT] and ABP oscillations at the heart rate.
Fig 9
Fig 9. Experimental spectra (symbols) and best fits (lines) with Eq (14) for all channels measured with the spatial mapping probe on subject 5.
Fig 10
Fig 10. Box plots for the eight subjects measured with the spatial mapping probe.
Each box represents the spread of parameters across the eight channels in the probe. Top panel: K(a). Middle panel: K(v). Bottom panel: τ(AR).

Similar articles

Cited by

References

    1. Rivera-Lara L, Zorrilla-Vaca A, Geocadin RG, Healy RJ, Ziai W, Mirski MA. Cerebral Autoregulation-Oriented Therapy at the Bedside A Comprehensive Review. Anesthesiology. 2017;126:1187–99. 10.1097/ALN.0000000000001625 - DOI - PubMed
    1. Lee JK, Kibler KK, Benni PB, Easley RB, Czosnyka M, Smielewski P, et al. Cerebrovascular Reactivity Measured by Near-Infrared Spectroscopy. Stroke. 2009. May;40(5):1820–6. 10.1161/STROKEAHA.108.536094 - DOI - PubMed
    1. Diedler J, Zweifel C, Budohoski KP, Kasprowicz M, Sorrentino E, Haubrich C, et al. The Limitations of Near-Infrared Spectroscopy to Assess Cerebrovascular Reactivity: The Role of Slow Frequency Oscillations. Anesth Analg. 2011. October;113(4):849–57. 10.1213/ANE.0b013e3182285dc0 - DOI - PubMed
    1. Zweifel C, Castellani G, Czosnyka M, Helmy A, Manktelow A, Carrera E, et al. Noninvasive Monitoring of Cerebrovascular Reactivity with Near Infrared Spectroscopy in Head-Injured Patients. J Neurotrauma. 2010. November;27:1951–8. 10.1089/neu.2010.1388 - DOI - PubMed
    1. Czosnyka M, Hutchinson PJ, Balestreri M, Hiller M, Smielewski P, Pickard JD. Monitoring and interpretation of intracranial pressure after head injury. Acta Neurochir Suppl. 2006;96(114–8). - PubMed

Publication types