

The relationship between wasting and stunting: a retrospective cohort analysis of longitudinal data in Gambian children from 1976 to 2016
- PMID: 30753251
- PMCID: PMC6669055
- DOI: 10.1093/ajcn/nqy326
The relationship between wasting and stunting: a retrospective cohort analysis of longitudinal data in Gambian children from 1976 to 2016
Abstract
Background: The etiologic relationship between wasting and stunting is poorly understood, largely because of a lack of high-quality longitudinal data from children at risk of undernutrition.
Objectives: The aim of this study was to describe the interrelationships between wasting and stunting in children aged <2 y.
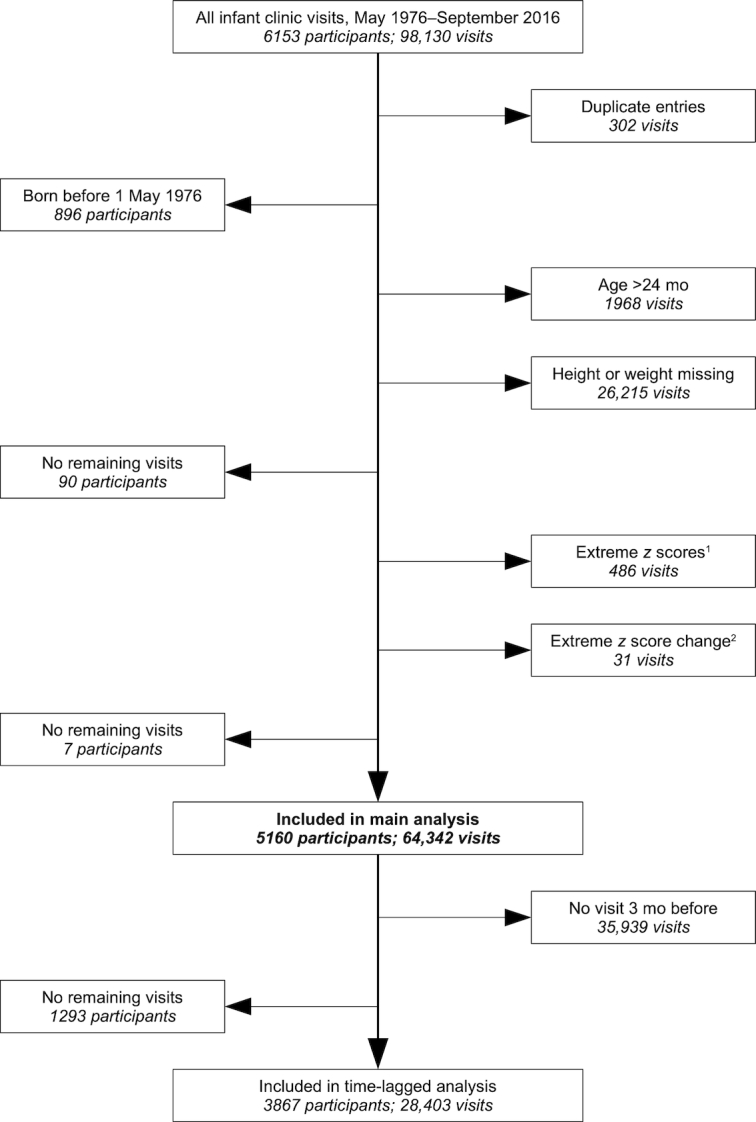
Methods: This study involved a retrospective cohort analysis, based on growth-monitoring records spanning 4 decades from clinics in rural Gambia. Anthropometric data collected at scheduled infant welfare clinics were converted to z scores, comprising 64,342 observations on 5160 subjects (median: 12 observations per individual). Children were defined as "wasted" if they had a weight-for-length z score <-2 against the WHO reference and "stunted" if they had a length-for-age z score <-2.
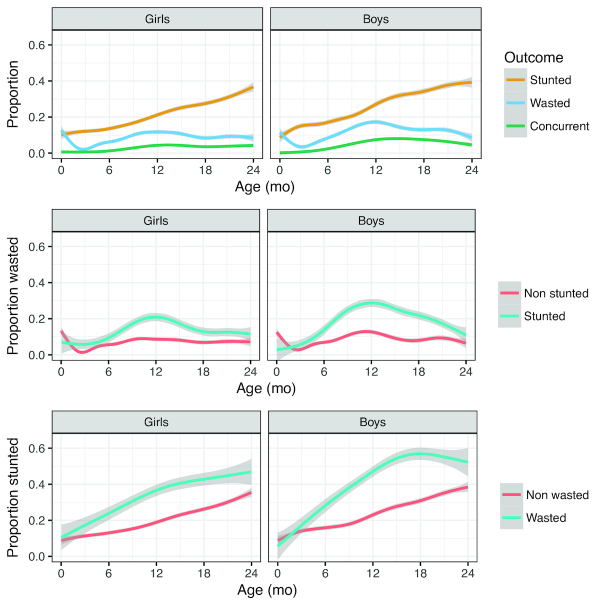
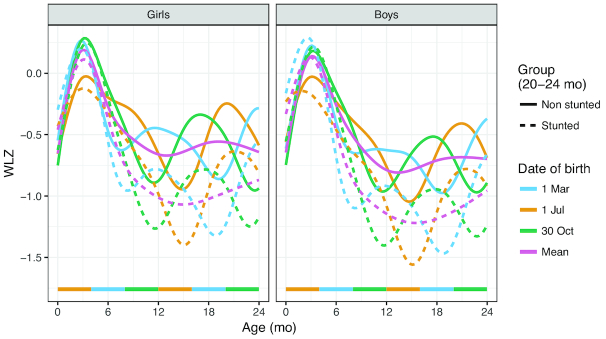
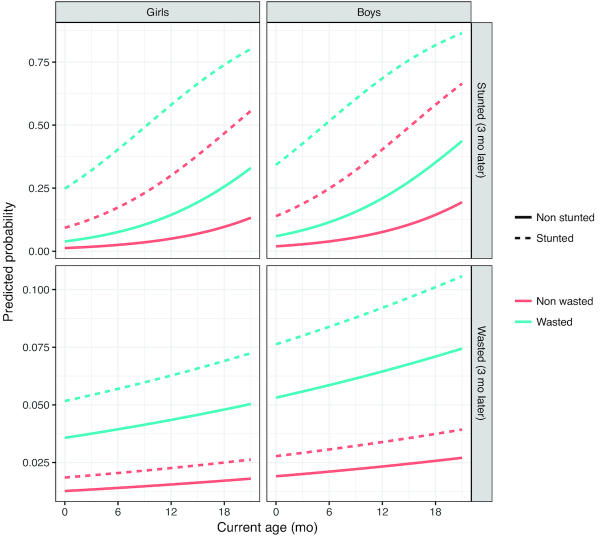
Results: Levels of wasting and stunting were high in this population, peaking at approximately (girls-boys) 12-18% at 10-12 months (wasted) and 37-39% at 24 mo of age (stunted). Infants born at the start of the annual wet season (July-October) showed early growth faltering in weight-for-length z score, putting them at increased risk of subsequent stunting. Using time-lagged observations, being wasted was predictive of stunting (OR: 3.2; 95% CI: 2.7, 3.9), even after accounting for current stunting. Boys were more likely to be wasted, stunted, and concurrently wasted and stunted than girls, as well as being more susceptible to seasonally driven growth deficits.
Conclusions: We provide evidence that stunting is in part a biological response to previous episodes of being wasted. This finding suggests that stunting may represent a deleterious form of adaptation to more overt undernutrition (wasting). This is important from a policy perspective as it suggests we are failing to recognize the importance of wasting simply because it tends to be more acute and treatable. These data suggest that stunted children are not just short children but are children who earlier were more seriously malnourished and who are survivors of a composite process.
Keywords: boys; concurrently wasted and stunted; girls; growth-monitoring data; seasonality; stunting; wasting.
© 2019 American Society for Nutrition.
Figures
Comment in
-
The complex relationship between wasting and stunting.Am J Clin Nutr. 2019 Aug 1;110(2):271-272. doi: 10.1093/ajcn/nqz050. Am J Clin Nutr. 2019. PMID: 31172176 No abstract available.
References
-
- Black RE, Allen LH, Bhutta ZA, Caulfield LE, de Onis M, Ezzati M, Mathers C, Rivera J, Maternal, Child Undernutrition Study G . Maternal and child undernutrition: global and regional exposures and health consequences. Lancet. 2008;371(9608):243–60. - PubMed
-
- Seckler D. ‘Small but healthy’: a basic hypothesis in theory, measurement and policy of malnutrition. In: Sukhatme PV, editor. Newer concepts in nutrition and their implications for policy. Pune: Maharashtra Association for the Cultivation of Science; 1982.
-
- Grantham-McGregor SM, Fernald LC, Sethuraman K. Effects of health and nutrition on cognitive and behavioural development in children in the first three years of life: Part 1: Low birthweight, breastfeeding and protein-energy malnutrition. Food Nutr Bull. 1999;20:53–75.
-
- Martorell R, Horta BL, Adair LS, Stein AD, Richter L, Fall CH, Bhargava SK, Biswas SK, Perez L, Barros FC et al. .. Weight gain in the first two years of life is an important predictor of schooling outcomes in pooled analyses from five birth cohorts from low- and middle-income countries. J Nutr. 2010;140(2):348–54. - PMC - PubMed
Publication types
MeSH terms
Grants and funding
LinkOut - more resources
Full Text Sources
Medical
