. 2019 Apr 1;142(4):1035-1050.
doi: 10.1093/brain/awz016.

Type I interferon protects neurons from prions in in vivo models

Affiliations

Type I interferon protects neurons from prions in in vivo models

Daisuke Ishibashi et al. Brain. .

Abstract

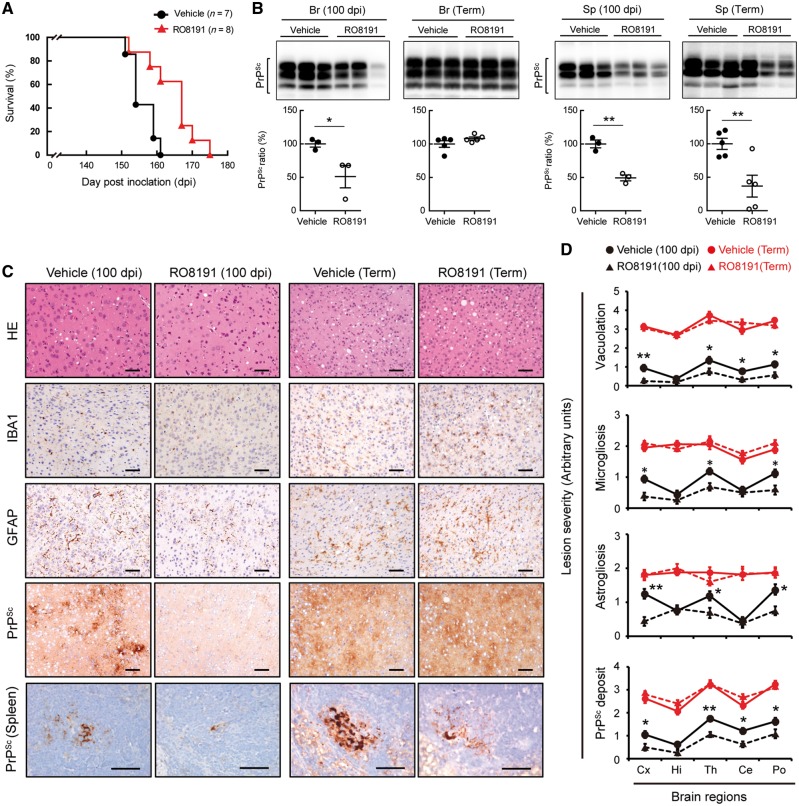
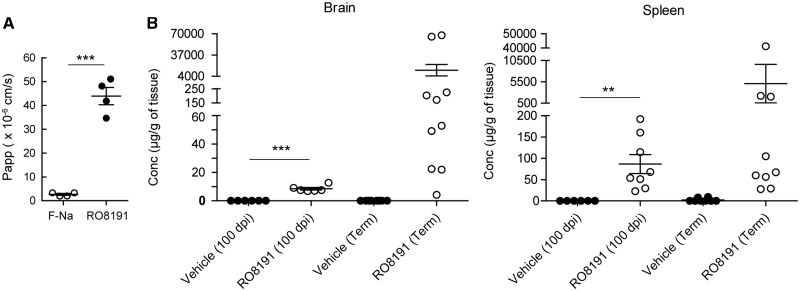
Infectious prions comprising abnormal prion protein, which is produced by structural conversion of normal prion protein, are responsible for transmissible spongiform encephalopathies including Creutzfeldt-Jakob disease in humans. Prions are infectious agents that do not possess a genome and the pathogenic protein was not thought to evoke any immune response. Although we previously reported that interferon regulatory factor 3 (IRF3) was likely to be involved in the pathogenesis of prion diseases, suggesting the protective role of host innate immune responses mediated by IRF3 signalling, this remained to be clarified. Here, we investigated the reciprocal interactions of type I interferon evoked by IRF3 activation and prion infection and found that infecting prions cause the suppression of endogenous interferon expression. Conversely, treatment with recombinant interferons in an ex vivo model was able to inhibit prion infection. In addition, cells and mice deficient in type I interferon receptor (subunit interferon alpha/beta receptor 1), exhibited higher susceptibility to 22L-prion infection. Moreover, in in vivo and ex vivo prion-infected models, treatment with RO8191, a selective type I interferon receptor agonist, inhibited prion invasion and prolonged the survival period of infected mice. Taken together, these data indicated that the interferon signalling interferes with prion propagation and some interferon-stimulated genes might play protective roles in the brain. These findings may allow for the development of new strategies to combat fatal diseases.

Keywords: innate immune system; prion infection; type I interferon (I-IFN).


Figures

Figure 1
Figure 1
Innate immune-related genes levels are suppressed by prion infection in the cells. (A) Ifnb gene expression in persistently prion-infected N2a-22 L and non-infected N2a-58 cells. Immunoblot shows PrPSc levels in those cells. (B and C) Irf3 and Ifnb levels in N2a-58 (B) and NIH3T3 (C) cells after ex vivo prion infection with 2 × 10⁻³ or 2 × 10⁻² % 22 L-brain homogenate (BH). Pre-infection of N2a-58 cells and normal brain homogenate treatment in 3T3 cells, white; 22 L-prion infection, black. Immunoblot shows PrPSc levels in those cells after prion infection. (D) Irf3 and Ifnb levels in N2a-22 L cells for 48 h after PPS and 3S9 treatments. N2a-58 (white); -22 L (black). Immunoblot shows PrPSc levels in the cells 24 and 48 h after PPS and 3S9 treatment. Statistical significance was determined using unpaired Student’s t-test (AC) and one-way ANOVA, followed by Tukey-Kramer test in multiple comparisons (D). *P < 0.05, **P < 0.01, ***P < 0.001. Data are presented as mean ± SEM. Quantitative RT-PCR and western blot results represent at least three independent experiments.
Figure 2
Figure 2
Type I IFNs inhibit prion propagation in infectious cells and animal models. (A) PrPSc levels in N2a-22 L cells 48 h after treatments with recombinant I-IFNs (rIFNs) (0.1–10 kU/ml). (BD) Resistance to ex vivo 22 L-prion infection in N2a-58 cells pretreated with rIFNs (0.1–10 kU/ml) (B), constitutively overexpressing IFN-β (C), or transfected with poly I:C (0.2–2 µg) (D). All graphs show quantifications of PrPSc band intensities. (E and F) Bioassay using 22 L-prion-infected mice (Tga20) inducing Ifnb with lentivirus system. Panels show localization of lentivirus in thalamus 20 days after stereotaxic injection to Tga20 mice brain (Venus: green; nuclei: blue) (E). Scale bar = 50 µm. PrPSc levels in brain of 22 L-prion-infected mice in the terminal stage brain pre-injected stereotaxically (s.t.) and intracerebrally (i.c.) with LV-venus and -IFN (F). Graphs show quantifications of PrPSc band intensities in brain (n = 3 mice per each lentiviral injection group). Statistical significance was determined using unpaired Student’s t-test (C and F) and one-way ANOVA, followed by Dunnett’s test in multiple comparisons (A, B and D). *P < 0.05, **P < 0.01 and ***P < 0.001. Data are presented as mean ± SEM. Western blot results represent at least three independent experiments.
Figure 3
Figure 3
Ifnar1 gene depletion is susceptible to prion infection in ex vivo models. (A) PrPSc levels in the indicated immortalized MEFs from wild-type and Ifnar1−/− mice after prion infection with 6 × 10⁻³ to 1.5 × 10⁻¹ % 22 L-brain homogenate (BH). Graphs show quantification of PrPSc levels in wild-type (black) and Ifnar1−/− (white) cells. *P < 0.05 versus wild-type. (B) Efficiency of prion infection in cells established by transducing the Ifnar1 gene into immortalized Ifnar1−/− MEFs. Immunoblots show PrPSc after prion infection with 2 × 10⁻² % 22 L-brain homogenate. Graphs show quantification of PrPSc levels in Ifnar1−/− (white) and Ifnar1-transduced (black) cells. **P < 0.01 versus Ifnar1−/−. Data are presented as mean ± SEM. Statistical significance was determined using one-way ANOVA, followed by Tukey-Kramer test in multiple comparisons (A) and unpaired Student’s t-test (B).
Figure 4
Figure 4
Ifnar1 gene depletion is susceptible to prion infection in in vivo animal models. (AD) Evaluation of prion pathogenesis in IFNAR1−/− mice. (A) Survival curves in wild-type (+/+) and Ifnar1−/− (−/−) mice following inoculation intracerebrally (i.c.) with a 10−1 dilution of 22 L-brain homogenate (P < 0.001, log-rank test). PrPSc levels (B) and histological changes (C) in the brain at 100 dpi and in terminal phase of prion infection. (C) Panels show vacuolation (HE), microglia (IBA1), and astrocytes (GFAP) in the cortex (Cx), and PrPSc deposits in cortex and spleen. Scale bars = 50 µm. (D) Lesion profiles of vacuolation, microgliosis, astrogliosis, and PrPSc deposits in the same five brain regions: cortex, hippocampus (Hi), thalamus (Th), cerebellum (Ce), and pons (Po). Details of the lesion severity score for each histological change are described in the ‘Materials and methods’ section. Circle and triangle symbols indicate wild-type and Ifnar1−/− mice, respectively, at 100 dpi (black) and in the terminal stage (red). *P < 0.05, **P < 0.01 versus wild-type mice at 100 dpi. Error bars represent SEM. Statistical significance was determined using unpaired Student’s t-test (D). Results represent at least three independent experiments.
Figure 5
Figure 5
RO8191 selectively stimulating type I IFN receptor blocks prion formation. (A and B) Effect of RO8191 was investigated in cell culture models. N2a-22 L (A) and N2a-58 (B) cells were treated with different concentrations (0, 0.5, 5, 250 and 500 μM) of RO8191 for 48 h. PrPSc (in N2a-22 L), PrPC (in N2a-58), OAS1a and β-actin (as a loading control) were detected by immunoblotting. PrPSc and PrPC band intensities following treatment with individual RO8191 concentrations are shown as a percentage of the negative control (bottom). (C) Resistance to ex vivo prion infection in N2a-58 cells pretreated with different concentrations (0, 0.5, 5, 250 and 500 μM) of RO8191. PrPSc, OAS1a and β-actin (as a loading control) were detected by immunoblotting. Statistical significance was determined using one-way ANOVA, followed by Dunnett’s test in multiple comparisons. **P < 0.01 and ***P < 0.001. Results in the graph present the mean ± SEM from at least three to five independent experiments.
Figure 6
Figure 6
RO8191-treated mice have resistance against prion infection. (AD) Evaluation of prion pathogenesis in RO8191-treated mice. (A) Survival curves for the vehicle and RO8191-treated mice after inoculation intracerebrally (i.c.) with a 10−1 dilution of 22 L-brain homogenate (P < 0.05, log-rank test). PrPSc levels (B) and histological changes (C) in the brain (cortex, Cx) and spleen are shown at 100 dpi and in the terminal phase of prion infection. (D) Lesion profiles in the same five brain regions are similar to those shown in Fig. 4. Circle and triangle symbols indicate vehicle and RO8191-treated mice, respectively, at 100 dpi (black) and in the terminal stage (red). *P < 0.05 and **P < 0.01 versus vehicle mice at 100 dpi. Error bars represent SEM. Statistical significance was determined using an unpaired Student’s t-test (B and D). These results represent at least three independent experiments.
Figure 7
Figure 7
RO8191 is able to translocate to the brain. (A) Blood–brain barrier permeability of RO8191 and sodium fluorescein (F-Na) as a negative control. Papp (×10−6 cm/s) in the graph shows quantification of blood–brain barrier permeability using the BBB Kit after RO8191 treatment for 60 min. ***P < 0.001 versus F-Na. (B) Concentration of RO8191 in the brain and spleen of RO8191-treated mice at 100 dpi and terminal phase after 22 L-prion inoculation. **P < 0.01 and ***P < 0.001 versus vehicle at 100 dpi. Statistical significance was determined using an unpaired Student’s t-test and Mann-Whitney U-test. Data are presented as mean ± SEM.

Similar articles

Cited by

References

    1. Aguzzi A, Nuvolone M, Zhu C. The immunobiology of prion diseases. Nat Rev Immunol 2013; 13: 888–902. - PubMed
    1. Aguzzi A, Polymenidou M. Mammalian prion biology: one century of evolving concepts. Cell 2004; 116: 313–27. - PubMed
    1. Atarashi R, Sim VL, Nishida N, Caughey B, Katamine S. Prion strain-dependent differences in conversion of mutant prion proteins in cell culture. J Virol 2006; 80: 7854–62. - PMC - PubMed
    1. Baker CA, Lu ZY, Manuelidis L. Early induction of interferon-responsive mRNAs in Creutzfeldt-Jakob disease. J Neurovirol 2004; 10: 29–40. - PMC - PubMed
    1. Bradford BM, Mabbott NA. Prion disease and the innate immune system. Viruses 2012; 4: 3389–419. - PMC - PubMed

Publication types