. 2019 Jun 1;115(7):1205-1216.
doi: 10.1093/cvr/cvz040.

Mesenchymal stromal cell-derived exosomes attenuate myocardial ischaemia-reperfusion injury through miR-182-regulated macrophage polarization

Affiliations

Mesenchymal stromal cell-derived exosomes attenuate myocardial ischaemia-reperfusion injury through miR-182-regulated macrophage polarization

Jinxuan Zhao et al. Cardiovasc Res. .

Abstract

Aims: Mesenchymal stromal cells (MSCs) gradually become attractive candidates for cardiac inflammation modulation, yet understanding of the mechanism remains elusive. Strikingly, recent studies indicated that exosomes secreted by MSCs might be a novel mechanism for the beneficial effect of MSCs transplantation after myocardial infarction. We therefore explored the role of MSC-derived exosomes (MSC-Exo) in the immunomodulation of macrophages after myocardial ischaemia/reperfusion (I/R) and its implications in cardiac injury repair.

Methods and results: Exosomes were isolated from the supernatant of MSCs using gradient centrifugation method. Administration of MSC-Exo to mice through intramyocardial injection after myocardial I/R reduced infarct size and alleviated inflammation level in heart and serum. Systemic depletion of macrophages with clodronate liposomes abolished the curative effects of MSC-Exo. MSC-Exo modified the polarization of M1 macrophages to M2 macrophages both in vivo and in vitro. miRNA sequencing of MSC-Exo and bioinformatics analysis implicated miR-182 as a potent candidate mediator of macrophage polarization and toll-like receptor 4 (TLR4) as a downstream target. Diminishing miR-182 in MSC-Exo partially attenuated its modulation of macrophage polarization. Likewise, knock down of TLR4 also conferred cardioprotective efficacy and reduced inflammation level in a mouse model of myocardial I/R.

Conclusion: Our data indicate that MSC-Exo attenuates myocardial I/R injury in mice via shuttling miR-182 that modifies the polarization status of macrophages. This study sheds new light on the application of MSC-Exo as a potential therapeutic tool for myocardial I/R injury.

Keywords: Exosomes; Macrophage polarization; Mesenchymal stromal cells; MicroRNA; Myocardial ischaemia/reperfusion injury.


Figures

Figure 1
Figure 1
Intramyocardial infusion of MSC-Exo attenuates myocardial I/R injury and alleviates cardiac inflammation in mice. EF% (A) and FS% (B) of sham-operated, PBS–treated, and MSC-Exo-treated mice measured by echocardiography 3 days and 3 weeks following myocardial I/R injury (sham, n = 5; PBS, n = 8; MSC-Exo, n = 8). (C) Representative images of Evans Blue and TTC-stained hearts isolated from mice 3 days following treatment with PBS or MSC-Exo. Area-at-risk (AAR; red line) and infarct size (IS; white dotted line). Scale bar = 5mm. (D) Quantitative analysis of the percentage AAR and percentage infarct of hearts in (C) (n = 6). (E) HE staining and quantification of inflammatory cell infiltration (%) within the ischaemic heart 3 days following operation (n = 6). Scale bar = 100 μm. Cytokine expression of IL-6 (F) and IL-10 (G) in the hearts of mice treated with PBS or MSC-Exo 3 days and 7 days after myocardial I/R (n = 8). Concentration of cytokines IL-6 (H) and IL-10 (I) in serum 3 days and 7 days after I/R (n = 8). Graphs depict mean ± SD. Statistical significance was determined using Student’s t-test for two group’s comparison, one-way ANOVA followed by Tukey’s multiple comparisons test for multiple group comparisons and two-way ANOVA followed by Bonferroni’s multiple comparisons test for comparison between different groups over time. *P < 0.05; **P < 0.01; ***P < 0.001; ****P < 0.0001; ns, not significant.
Figure 2
Figure 2
Systemic depletion of endogenous macrophages reduces the efficacy of MSC-Exo therapy. (A) Schematic of macrophage depletion protocol using Cl2MDP liposomes. (B) Representative flow cytometry plots of macrophage population in the spleens, blood, and hearts from Cl2MDP- and PBS-treated animals 3 days after I/R. (C) Pooled flow cytometry data from (B) (n = 5). (D) Representative images of Evans Blue and TTC-stained hearts from mice sacrificed 3 days after infusion of MSC-Exo or vehicle with or without macrophage depletion prior to myocardial I/R injury. Area-at-risk (AAR; red line) and infarct size (IS; white dotted line). Scale bar = 5 mm. (E) Quantification of percentage AAR and percentage infarct in hearts from groups defined in (D) (n = 6). (F) EF% and FS% measured by echocardiography 3 days following myocardial I/R injury (n = 6). Graphs depict mean ± SD. Statistical significance was determined using Student’s t-test and one-way ANOVA followed by Tukey’s multiple comparisons test. *P < 0.05; ***P < 0.001; ****P < 0.0001.
Figure 3
Figure 3
Effects of MSC-Exo on macrophage infiltration and polarization following myocardial I/R. (A) Representative flow cytometry plots showing the gating strategy used to determine total macrophage in heart (CD11b+F4/80+), M1 phenotype(CD11b+F4/80+iNOS+CD206) and M2 phenotype (CD11b+F4/80+iNOS-CD206+). (B) Quantification of total macrophages, M1 macrophages and M2 macrophages within heart tissues 3 days following treatment with PBS or MSC-Exo (n = 5). (C) Gene expression profiles of pro-inflammatory cytokines and M1 macrophage marker in the hearts of mice sacrificed 3 days after myocardial I/R (n = 6). (D) Gene expression profiles of anti-inflammatory cytokines and M2 macrophage marker in the hearts of mice treated with PBS or MSC-Exo 3 days after myocardial I/R (n = 6). Expression of interest genes is normalized to GADPH and given as a relative change. (E) Representative images of western blot to assess levels of iNOS and Arg1 in the hearts of mice treated with PBS or MSC-Exo 3 days after I/R (n = 5). (F) Quantification of band intensities in (E). All data are mean ± SD. Statistical significance was determined using one-way ANOVA followed by Tukey’s multiple comparisons test. *P < 0.05; **P < 0.01; ***P < 0.001; ****P < 0.0001.
Figure 4
Figure 4
MSC-Exo facilitates the polarization of macrophages to M2 phenotype under inflammatory environment. (A) Representative images of the uptake of Dil-labelled exosomes (red) by RAW264.7 cells (DAPI blue) and fluorescence uptake with sham control and dye-only samples. Sham control, aliquots isolated from equal volume of MSC culture medium containing 5% exosome-free FBS in the absence of cells stained with DiI; Dye-only, PBS negative control stained with the DiI; Non-stained, background RAW264.7 cells fluorescence without addition of a sample. Scale bar = 25 μm. (B) Concentration of cytokine IL-6 and IL-10 in supernatants of LPS-stimulated RAW 264.7 cells after culturing with MSC-Exo or PBS for 48 h (n = 6). (C) Western blot assay for iNOS and Arg1 expression in LPS-stimulated RAW 264.7 cells after culturing with MSC-Exo or PBS for 48 h. (D) Quantitative analysis of iNOS, Arg1 levels in (C) (n = 5). (E) Representative flow cytometry plots showing the percentages of M1 (iNOS+CD206) and M2 (iNOSCD206+) phenotype in LPS-stimulated peritoneal macrophages after culturing with MSC-Exo or PBS for 48 h. (F) Quantification of flow cytometry data in (E) (n = 5). (G) Gene expression profiles of M1 markers (iNOS, IL-1β, IL-6, and TNFα) and M2 markers (Arg1, IL-10, CD206, and TGFβ) in LPS-stimulated peritoneal macrophages after culturing with MSC-Exo or PBS for 48 h (n = 5). Expression of interest genes is normalized to GADPH and given as relative change. Data are presented as mean ± SD. Statistical analysis was performed with Student’s t-test and one-way ANOVA followed by Tukey’s multiple comparisons test. **P < 0.01; ***P < 0.001; ****P < 0.0001.
Figure 5
Figure 5
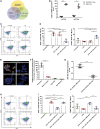
miR-182 is involved in MSC-Exo mediated macrophage polarization in vitro. (A) Main reported miRNAs participated in inflammation modulation, cardiac repair, and miRNAs abundant in MSC-Exo according to miRNA-sequencing analysis. miR-182 and miR-125a are multifunctional in both fields. (B) Real-time PCR analysis of miR-182 and miR-125a levels in exosomes derived from MSCs and RAW264.7 cells (n = 5). The expression levels of the miRNAs were normalized to U6. (C) Representative flow cytometry plots showing the percentages of M1 (iNOS+CD206) and M2 (iNOSCD206+) phenotype in LPS-stimulated RAW264.7 cells after transfection with miR-182 mimic or NC mimic for 48 h. (D) Pooled flow cytometry data from (C) (n = 5). (E) Representative images of the uptake of miR-182 inhibitor transfected (green) Dil-labelled MSC-Exo (red) by RAW264.7 cells (DAPI blue) and fluorescence uptake with sham control and dye-only samples. Sham control, aliquots isolated from equal volume of MSC culture medium containing 5% exosome-free FBS in the absence of cells stained with DiI; Dye-only, PBS negative control stained with the DiI; Non-stained, background RAW264.7 cells fluorescence without addition of a sample. Scale bar = 25 μm. (F) Quantification of arbitrary fluorescence intensity from five different fields of each sample in (E) at 400× magnification obtained in a single experiment (n = 5). (G) Real-time PCR analysis of miR-182 levels in exosomes derived from NC inhibitor MSC-Exo and miR-182 inhibitor MSC-Exo (n = 5). (H) Representative flow cytometry plots showing the percentages of M1 (iNOS+CD206) and M2 (iNOSCD206+) phenotype in LPS-stimulated RAW264.7 cells treated with miR‐182 inhibitor MSC-Exo or NC inhibitor MSC-Exo for 48 h. (I) Quantification of flow cytometry data in (H) (n = 5). Data are presented as the mean ± SD. Statistical significance was determined using Student’s t-test and one-way ANOVA followed by Tukey’s multiple comparisons test. *P < 0.05; **P < 0.01; ***P < 0.001; ****P < 0.0001.
Figure 6
Figure 6
miR-182-5p shuttling by MSC-Exo modulates macrophage phenotype through targeting TLR4. (A) TLR4 mRNA relative expression detected by qRT–PCR after transfection of miR-182 mimic or scramble control (n = 5). (B) Protein levels of TLR4 detected by western blotting after transfection of miR-182 mimic or scramble control (n = 5). (C) Representative images of western blots for TLR4 and downstream MyD88/NF-κB and PI3K/Akt signalling pathways in LPS-stimulated RAW264.7 cells after transfection with miR-182 mimic or NC mimic for 48 h (n = 5). (D) Representative images of western blots for TLR4 and downstream MyD88/NF-κB and PI3K/Akt signalling pathways in LPS-stimulated RAW264.7 cells treated with miR‐182 inhibitor MSC-Exo or NC inhibitor MSC-Exo for 48 h (n = 5). (E) Protein levels of TLR4 in cardiac tissue of mice treated with PBS or MSC-Exo 3 days after myocardial I/R (n = 5). (F) EF% and FS% of TLR4-deficiency mice and WT mice 3 days following myocardial I/R injury (n = 8). (G) Representative flow cytometry plots showing the percentages of total macrophage (CD11b+F4/80+), M1 (CD11b+F4/80+iNOS+CD206) and M2 (CD11b+F4/80+iNOS-CD206+) phenotype within the heart tissue of TLR4-deficiency mice and WT mice 3 days following I/R injury. (H) Quantification of total macrophages, M1 macrophages and M2 macrophages within the heart tissue of TLR4-deficiency mice and WT mice in baseline and 3 days following myocardial I/R injury (n = 6). Graphs depict mean ± SD. Statistical significance was determined using Student’s t-test and one-way ANOVA followed by Tukey’s multiple comparisons test. *P < 0.05; **P < 0.01; ***P < 0.001; ns, not significant.

Similar articles

Cited by

References

    1. Hausenloy DJ, Yellon DM.. Myocardial ischemia-reperfusion injury: a neglected therapeutic target. J Clin Invest 2013;123:92–100. - PMC - PubMed
    1. Eltzschig HK, Eckle T.. Ischemia and reperfusion—from mechanism to translation. Nat Med 2011;17:1391–1401. - PMC - PubMed
    1. Frangogiannis NG. Regulation of the inflammatory response in cardiac repair. Circ Res 2012;110:159–173. - PMC - PubMed
    1. Wynn TA, Vannella KM.. Macrophages in tissue repair, regeneration, and fibrosis. Immunity 2016;44:450–462. - PMC - PubMed
    1. Ong SB, Hernández-Reséndiz S, Crespo-Avilan GE, Mukhametshina RT, Kwek XY, Cabrera-Fuentes HA, Hausenloy DJ.. Inflammation following acute myocardial infarction: multiple players, dynamic roles, and novel therapeutic opportunities. Pharmacol Ther 2018;186:73–87. - PMC - PubMed

Publication types

MeSH terms