

In vivo ratiometric optical mapping enables high-resolution cardiac electrophysiology in pig models
- PMID: 30753358
- PMCID: PMC6704389
- DOI: 10.1093/cvr/cvz039
In vivo ratiometric optical mapping enables high-resolution cardiac electrophysiology in pig models
Abstract
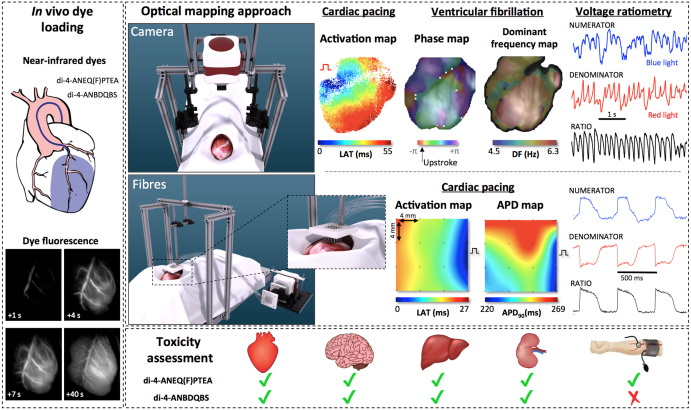
Aims: Cardiac optical mapping is the gold standard for measuring complex electrophysiology in ex vivo heart preparations. However, new methods for optical mapping in vivo have been elusive. We aimed at developing and validating an experimental method for performing in vivo cardiac optical mapping in pig models.
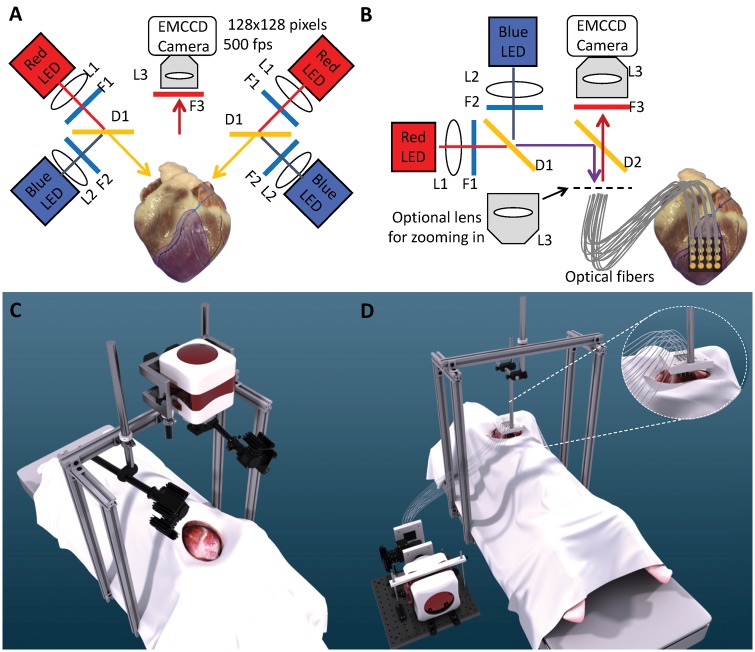
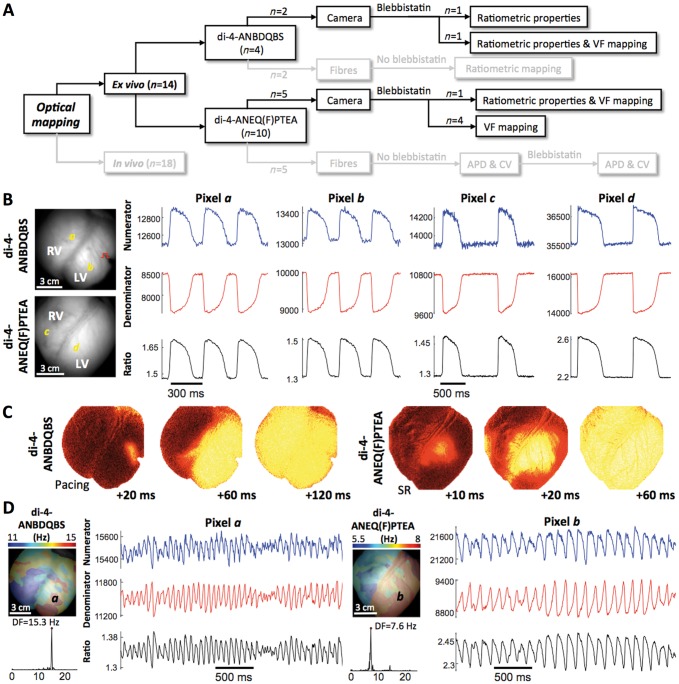
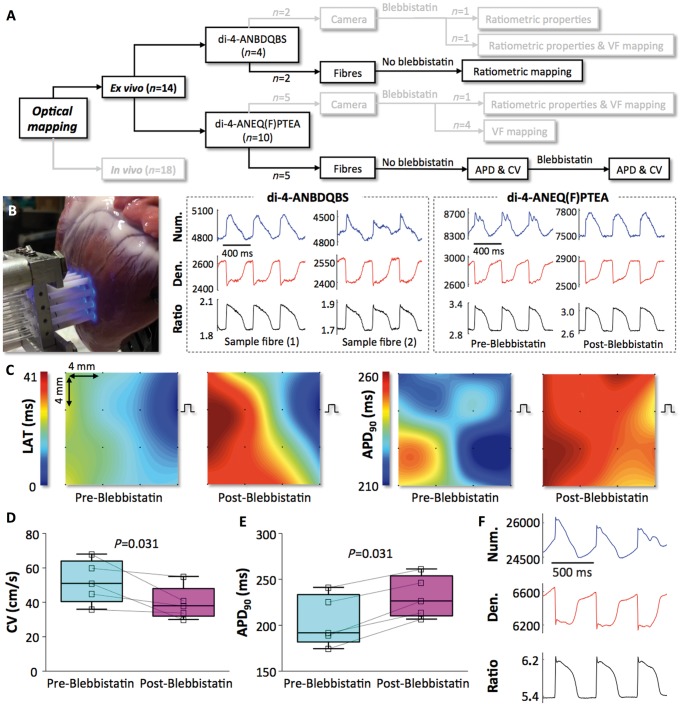
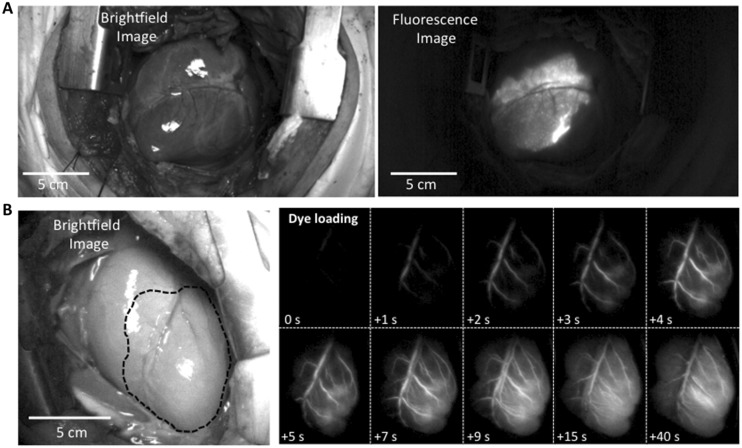
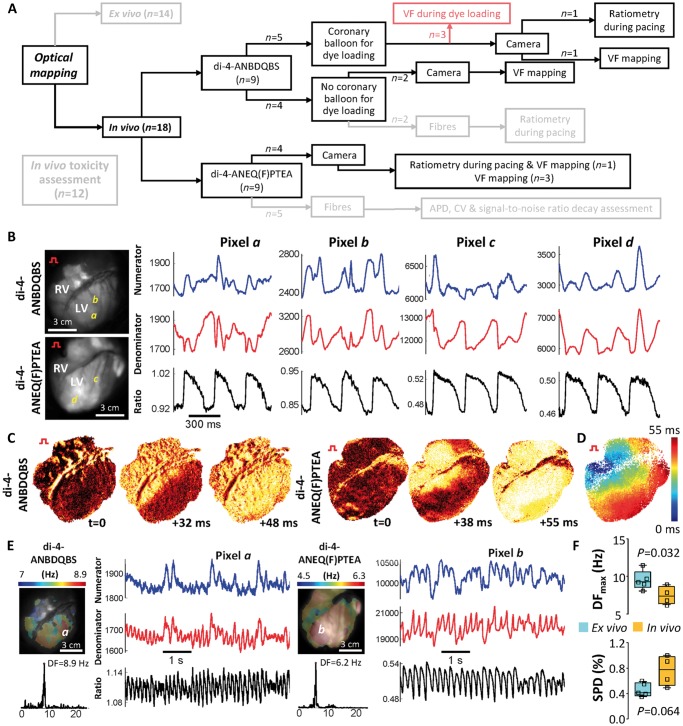
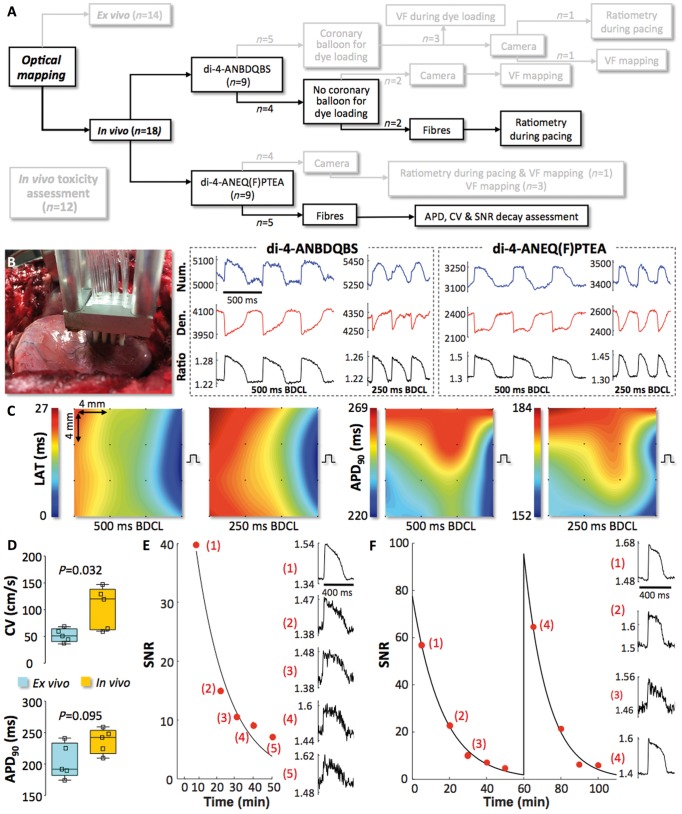
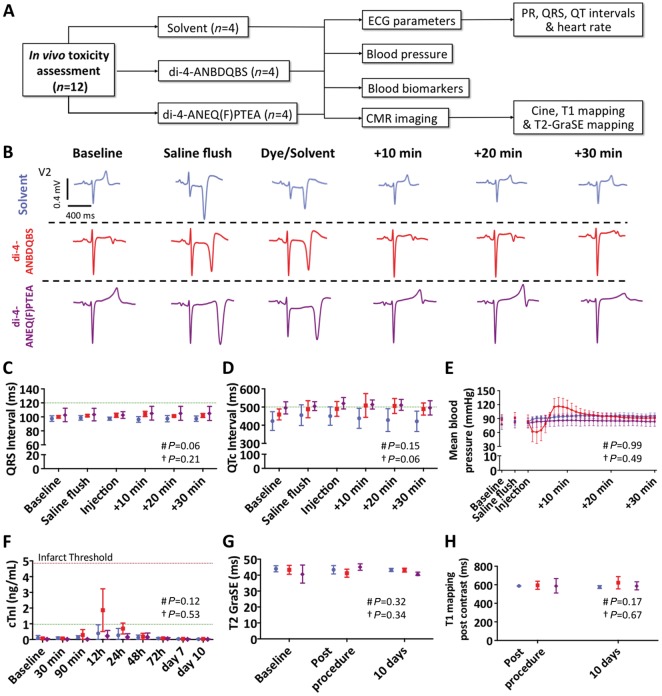
Methods and results: First, we characterized ex vivo the excitation-ratiometric properties during pacing and ventricular fibrillation (VF) of two near-infrared voltage-sensitive dyes (di-4-ANBDQBS/di-4-ANEQ(F)PTEA) optimized for imaging blood-perfused tissue (n = 7). Then, optical-fibre recordings in Langendorff-perfused hearts demonstrated that ratiometry permits the recording of optical action potentials (APs) with minimal motion artefacts during contraction (n = 7). Ratiometric optical mapping ex vivo also showed that optical AP duration (APD) and conduction velocity (CV) measurements can be accurately obtained to test drug effects. Secondly, we developed a percutaneous dye-loading protocol in vivo to perform high-resolution ratiometric optical mapping of VF dynamics (motion minimal) using a high-speed camera system positioned above the epicardial surface of the exposed heart (n = 11). During pacing (motion substantial) we recorded ratiometric optical signals and activation via a 2D fibre array in contact with the epicardial surface (n = 7). Optical APs in vivo under general anaesthesia showed significantly faster CV [120 (63-138) cm/s vs. 51 (41-64) cm/s; P = 0.032] and a statistical trend to longer APD90 [242 (217-254) ms vs. 192 (182-233) ms; P = 0.095] compared with ex vivo measurements in the contracting heart. The average rate of signal-to-noise ratio (SNR) decay of di-4-ANEQ(F)PTEA in vivo was 0.0671 ± 0.0090 min-1. However, reloading with di-4-ANEQ(F)PTEA fully recovered the initial SNR. Finally, toxicity studies (n = 12) showed that coronary dye injection did not generate systemic nor cardiac damage, although di-4-ANBDQBS injection induced transient hypotension, which was not observed with di-4-ANEQ(F)PTEA.
Conclusions: In vivo optical mapping using voltage ratiometry of near-infrared dyes enables high-resolution cardiac electrophysiology in translational pig models.
Keywords: In vivo imaging; Cardiac fibrillation; Cardiotoxicity; Optical mapping; Voltage-sensitive dyes.
© The Author(s) 2019. Published by Oxford University Press on behalf of the European Society of Cardiology.
Figures
Comment in
-
Putting the pieces together using in vivo optical mapping.Cardiovasc Res. 2019 Sep 1;115(11):1574-1575. doi: 10.1093/cvr/cvz089. Cardiovasc Res. 2019. PMID: 30924872 Free PMC article. No abstract available.
Similar articles
-
Di-5-ANEQ(F)PTEA Offers Better Performance than Di-4-ANEQ(F)PTEA for In-Situ Cardiac Optical Mapping.Annu Int Conf IEEE Eng Med Biol Soc. 2023 Jul;2023:1-4. doi: 10.1109/EMBC40787.2023.10340445. Annu Int Conf IEEE Eng Med Biol Soc. 2023. PMID: 38082915
-
Optical mapping of cardiac electromechanics in beating in vivo hearts.Biophys J. 2023 Nov 7;122(21):4207-4219. doi: 10.1016/j.bpj.2023.09.017. Epub 2023 Sep 29. Biophys J. 2023. PMID: 37775969 Free PMC article.
-
Near-infrared voltage-sensitive fluorescent dyes optimized for optical mapping in blood-perfused myocardium.Heart Rhythm. 2007 Nov;4(11):1441-51. doi: 10.1016/j.hrthm.2007.07.012. Epub 2007 Jul 17. Heart Rhythm. 2007. PMID: 17954405 Free PMC article. Review.
-
High-Resolution Optical Measurement of Cardiac Restitution, Contraction, and Fibrillation Dynamics in Beating vs. Blebbistatin-Uncoupled Isolated Rabbit Hearts.Front Physiol. 2020 May 26;11:464. doi: 10.3389/fphys.2020.00464. eCollection 2020. Front Physiol. 2020. PMID: 32528304 Free PMC article.
-
Optical Mapping of Ventricular Fibrillation Dynamics.Adv Exp Med Biol. 2015;859:313-42. doi: 10.1007/978-3-319-17641-3_13. Adv Exp Med Biol. 2015. PMID: 26238059 Review.
Cited by
-
Putting the pieces together using in vivo optical mapping.Cardiovasc Res. 2019 Sep 1;115(11):1574-1575. doi: 10.1093/cvr/cvz089. Cardiovasc Res. 2019. PMID: 30924872 Free PMC article. No abstract available.
-
Wide-field fluorescence lifetime imaging of neuron spiking and subthreshold activity in vivo.Science. 2023 Jun 23;380(6651):1270-1275. doi: 10.1126/science.adf9725. Epub 2023 Jun 22. Science. 2023. PMID: 37347862 Free PMC article.
-
ESC working group on cardiac cellular electrophysiology position paper: relevance, opportunities, and limitations of experimental models for cardiac electrophysiology research.Europace. 2021 Nov 8;23(11):1795-1814. doi: 10.1093/europace/euab142. Europace. 2021. PMID: 34313298 Free PMC article. Review.
-
Genetically engineered HEK cells as a valuable tool for studying electroporation in excitable cells.Sci Rep. 2024 Jan 6;14(1):720. doi: 10.1038/s41598-023-51073-5. Sci Rep. 2024. PMID: 38184741 Free PMC article.
-
Optical mapping of electromechanics in intact organs.Exp Biol Med (Maywood). 2020 Feb;245(4):368-373. doi: 10.1177/1535370219894942. Epub 2019 Dec 16. Exp Biol Med (Maywood). 2020. PMID: 31842618 Free PMC article.
References
-
- Neher E, Sakmann B.. Single-channel currents recorded from membrane of denervated frog muscle fibres. Nature 1976;260:799–802. - PubMed
-
- Gray RA, Jalife J, Panfilov AV, Baxter WT, Cabo C, Davidenko JM, Pertsov AM, Hogeweg P, Winfree AT.. Mechanisms of cardiac fibrillation. Science 1995;270:1222–1223. - PubMed
-
- Horowitz LN, Harken AH, Kastor JA, Josephson ME.. Ventricular resection guided by epicardial and endocardial mapping for treatment of recurrent ventricular tachycardia. N Engl J Med 1980;302:589–593. - PubMed
-
- Narayan SM, Baykaner T, Clopton P, Schricker A, Lalani GG, Krummen DE, Shivkumar K, Miller JM.. Ablation of rotor and focal sources reduces late recurrence of atrial fibrillation compared with trigger ablation alone: extended follow-up of the CONFIRM trial. J Am Coll Cardiol 2014;63:1761–1768. - PMC - PubMed
-
- Marchlinski FE, Haffajee CI, Beshai JF, Dickfeld TM, Gonzalez MD, Hsia HH, Schuger CD, Beckman KJ, Bogun FM, Pollak SJ, Bhandari AK.. Long-term success of irrigated radiofrequency catheter ablation of sustained ventricular tachycardia: post-approval THERMOCOOL VT trial. J Am Coll Cardiol 2016;67:674–683. - PubMed
Publication types
MeSH terms
Substances
Grants and funding
LinkOut - more resources
Full Text Sources
Miscellaneous
