. 2019 Dec 23;11(11):979-993.
doi: 10.1093/jmcb/mjz008.

ADAM10 sheddase activation is controlled by cell membrane asymmetry

Affiliations

ADAM10 sheddase activation is controlled by cell membrane asymmetry

Florian Bleibaum et al. J Mol Cell Biol. .

Abstract

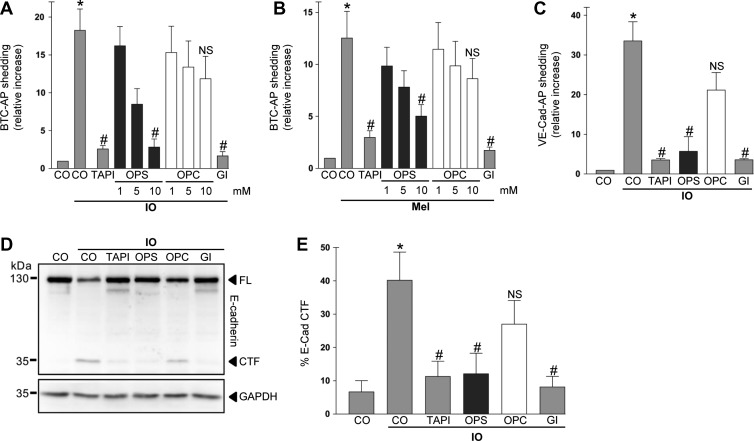
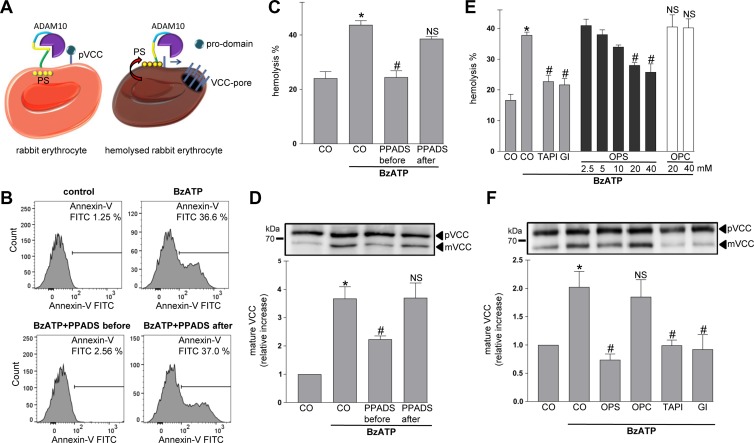
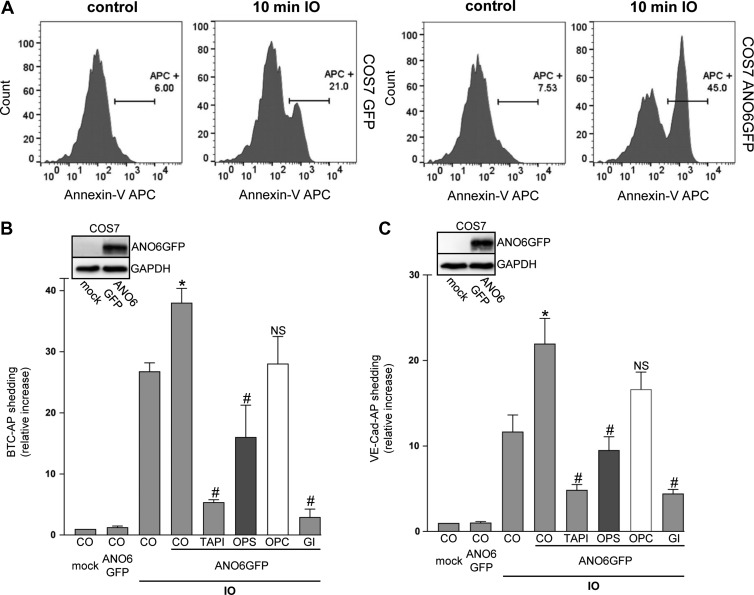
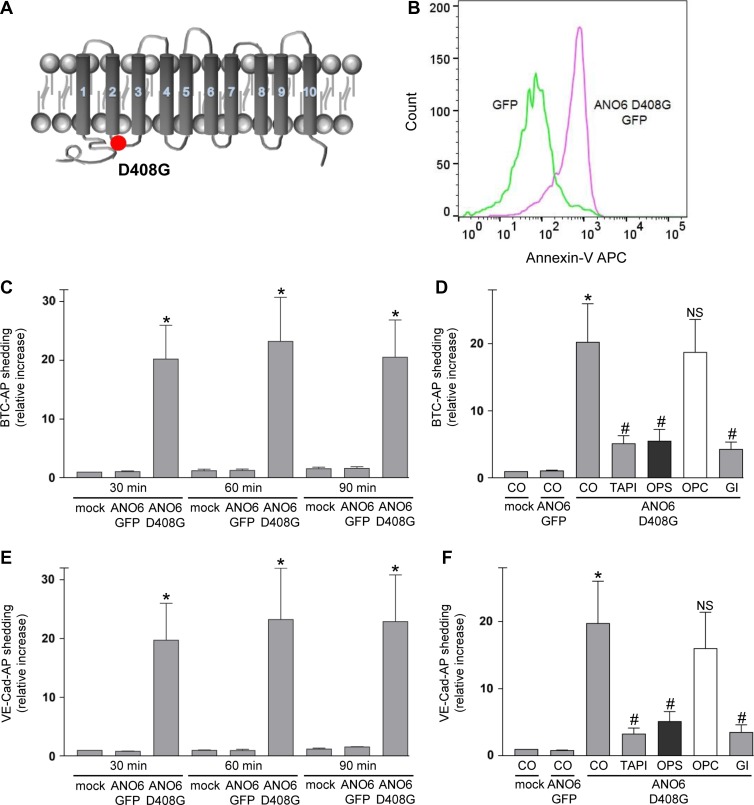
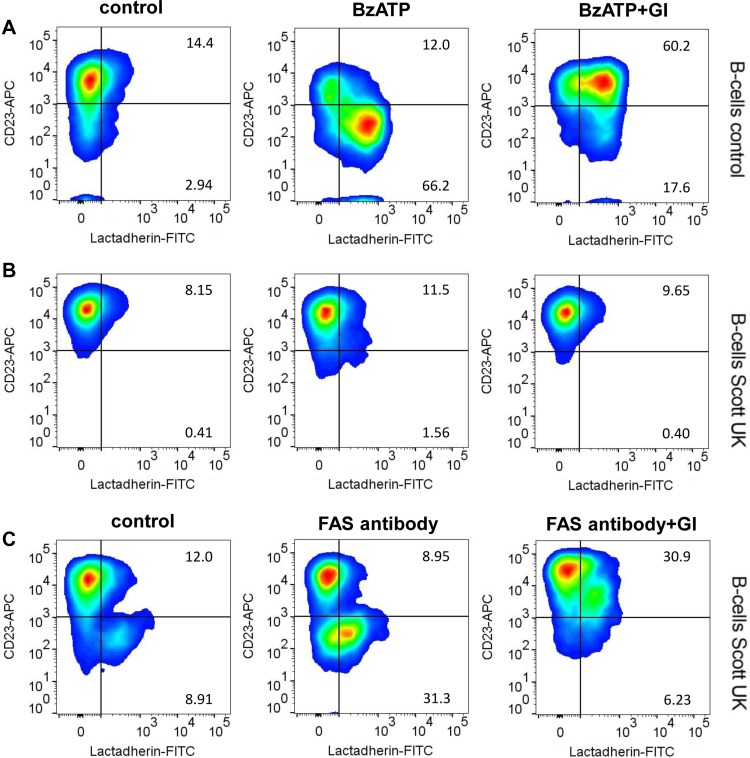
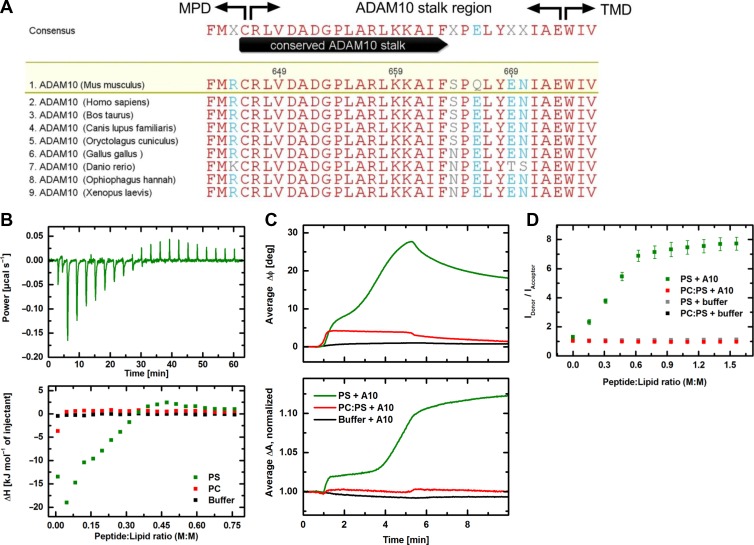
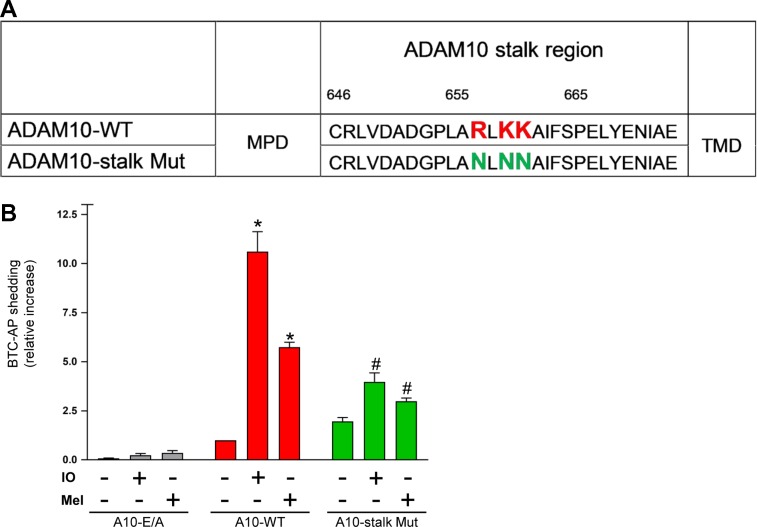
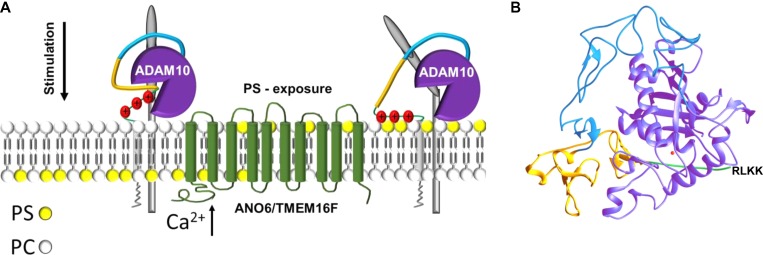
Dysregulation of the disintegrin-metalloproteinase ADAM10 may contribute to the development of diseases including tumorigenesis and Alzheimer's disease. The mechanisms underlying ADAM10 sheddase activation are incompletely understood. Here, we show that transient exposure of the negatively charged phospholipid phosphatidylserine (PS) is necessarily required. The soluble PS headgroup was found to act as competitive inhibitor of substrate cleavage. Overexpression of the Ca2+-dependent phospholipid scramblase Anoctamin-6 (ANO6) led to increased PS externalization and substrate release. Transfection with a constitutively active form of ANO6 resulted in maximum sheddase activity in the absence of any stimulus. Calcium-dependent ADAM10 activation could not be induced in lymphocytes of patients with Scott syndrome harbouring a missense mutation in ANO6. A putative PS-binding motif was identified in the conserved stalk region. Replacement of this motif resulted in strong reduction of sheddase activity. In conjunction with the recently described 3D structure of the ADAM10 extracellular domain, a model is advanced to explain how surface-exposed PS triggers ADAM10 sheddase function.

Keywords: ADAM10; Anoctamin-6; activation; cell membrane asymmetry; phosphatidylserine; shedding.


Figures

Figure 1
Figure 1
PS interaction is required for ADAM10 activation. (A and B) COS7 cells were transfected with the AP-tagged ADAM10 substrate BTC and stimulated with ionomycin (IO, 1 μM; A) or melittin (Mel, 0.5 μM; B) for 30 min. Shedding was dose-dependently reduced by addition of the competing phosphatidylserine head group (OPS) but not by the head group of phosphatidylcholine (OPC). OPS (10 mM), broadspectrum metalloprotease inhibitor TAPI-1 (10 μM), and ADAM10 inhibitor GI (3 μM) significantly abrogated the induced shedding. (C) COS7 cells were transfected with the AP-tagged ADAM10 substrate VE-cadherin and stimulated with ionomycin for 30 min in the presence of OPS (10 mM), OPC (10 mM), TAPI-1 (10 μM), or ADAM10 inhibitor GI (3 μM) and analysed for substrate shedding. (D) Shedding of full-length (FL) E-cadherin was monitored by immunoblot analysis. HaCaT keratinocytes were stimulated with ionomycin (1 μM) in the presence of TAPI-1 (10 μM), OPS (10 mM), OPC (10 mM), or ADAM10 inhibitor GI (3 μM). (E) Densitometric quantification of E-cadherin C-terminal fragment (CTF) generation of three independent western blots. * indicates a significant increase compared to unstimulated cells; # indicates significant decrease compared to stimulated control (P < 0.05, n = 3; ±SEM). NS, no significant difference. Data were analysed by one-way analysis of variance and Bonferroni multiple comparison post hoc test. CO, control.
Figure 2
Figure 2
Analysis of ADAM10 PS-dependency using a rabbit erythrocyte model. (A) Schematic model. ADAM10 is expressed on rabbit erythrocytes. PS is externalized upon cell activation. Vibrio cholerae cytolysin precursor (pVCC) cleavage leads to pore formation and hemolysis. (B) Stimulation with BzATP (0.5 mM) leads to PS exposure. Cells were stimulated for 15 min, stained with Annexin V-FITC, and analysed by FACS analysis. Induction of PS exposure was inhibited by pre-incubation with P2R antagonist PPADS (100 μM), but not by post-incubation. (CF) BzATP-induced hemolysis and pVCC cleavage depends on PS externalization. Cells were stimulated with BzATP as detailed in Materials and methods. BzATP treatment induced hemolysis (C) and pVCC cleavage (D). Pre-incubation with PPADS abrogated this effect. Application of PPADS after removel of BzATP could not prevent pVCC shedding and hemolysis. (D, upper panel) Representative immunoblot of pVCC cleavage. (D, lower panel) Densitometric quantification of three independent experiments. (E and F) BzATP-induced hemolysis (E) and pVCC cleavage (F) were inhibited by OPS (20 mM) but not by OPC (20 mM) and significantly abrogated in the presence of TAPI-1 (10 μM) and GI (3 μM). (F, upper panel) Representative immunoblot of pVCC cleavage. (F, lower panel) Densitometric quantification of three independent western blots. * indicates a significant increase compared to unstimulated cells; # indicates significant decrease compared to stimulated control cells (P < 0.05, n = 3; ±SEM). NS, no significant difference. Data were analysed by one-way analysis of variance and Bonferroni multiple comparison post hoc test. CO, control.
Figure 3
Figure 3
Overexpression of ANO6 enhances ADAM10 sheddase activity upon calcium influx. (A) Mock-transfected and Anoctamin-6 (ANO6)-GFP-transfected COS7 cells were stimulated with ionomycin (IO, 1 μM) for the indicated time. After stimulation, cells were stained with Annexin V-APC and analysed via FACS analysis. (B and C) COS7 cells were co-transfected with ANO6-GFP or mock vector and the AP-tagged ADAM10 substrates BTC or VE-cadherin, respectively. Cells were stimulated with IO (1 μM) for 30 min. IO-induced shedding was significantly increased upon overexpression of ANO6. TAPI (10 μM), ADAM10 inhibitor GI (3 μM), and OPS (10 mM), but not OPC (10 mM), significantly abrogated the induced shedding. * indicates a significant increase compared to mock-transfected stimulated cells; # indicates significant decrease compared to ANO6-transfected stimulated control cells (P < 0.05, n = 3; ±SEM). NS, no significant difference. Data were analysed by one-way analysis of variance and Bonferroni multiple comparison post hoc test. CO, control.
Figure 4
Figure 4
Transfection of hyperactive ANO6 leads to constitutive PS exposure and ADAM10 sheddase activation. (A) Schematic representation of human ANO6-D408G mutant. (B) Mock-transfected or ANO6-D408G-GFP-transfected COS7 cells were analysed for PS exposure using Annexin V-APC staining. (CF) COS7 cells were co-transfected with mock plasmid or ANO6-D408G-GFP and the AP-tagged ADAM10 substrate BTC (C, D) or VE-cadherin (E, F). (C and E) After washing, cells were analysed for substrate release for 30, 60, and 90 min. (D and F) Cells were analysed for BTC-AP or VE-cadherin release after 30 min in the presence of TAPI-1 (10 μM), OPS (10 mM), OPC (10 mM), or GI (3 μM). ADAM10 inhibitor GI, TAPI, and OPS significantly abrogated the shedding. * indicates a significant increase compared to mock-transfected cells; # indicates significant decrease compared to ANO6-D408G-GFP transfected cells in the absence of inhibitor (P < 0.05, n = 3; ±SEM). NS, no significant difference. Data were analysed by one-way analysis of variance and Bonferroni multiple comparison post hoc test. CO, control.
Figure 5
Figure 5
ANO6 loss-of-function abolishes ADAM10-mediated shedding in Scott patient lymphocytes. Control B-cells and B-cells from Scott syndrome patients were monitored by flow cytometry for induction of PS exposure (lactadherin-FITC) and CD23 shedding. (A and B) BzATP stimulation (0.5 mM, 30 min) induced PS externalization and loss of CD23 in control cells (A, middle panel), but not in Scott patient cells (B, middle panel). (C) Fas-antibody (500 ng/ml, 6 h)-induced apoptosis led to pronounced PS exposure and concomitant CD23 loss in Scott cells. BzATP and Fas-antibody-induced CD23 shedding was abrogated in the presence of the ADAM10 inhibitor GI (3 μM). Representative pseudocolor plots of three independent experiments are shown.
Figure 6
Figure 6
Biophysical properties of the ADAM10 stalk region. (A) Alignment of the ADAM10 stalk region sequences downstream of the membrane proximal domain (MPD) and upstream of the transmembrane domain (TMD) from different species identifies a highly conserved region. Red letters indicate identical residues. ClustalW multiple sequence alignment. (B) ITC measurements to study the interaction of the ADAM10 stalk region with either PS (green) or PC (red) liposomes. Shown is the heating power corresponding to interaction of the ADAM10 peptide with PS liposomes in 20 titration steps as a function of time (upper panel) and the interaction enthalpy for both lipid systems and the buffer control (black) plotted over the peptide:lipid ratio (lower panel). While the titration of ADAM10 peptide into buffer and to PC liposomes shows no interaction, it comes first to exothermic reactions and then to endothermic reactions with PS liposomes. (C) SAW measurements showing the interaction of ADAM10 peptide with PS membranes (green) or PC:PS (9:1) membranes (red) immobilized on the CM-dextran/poly-L-lysine (PLL) functionalization of the sensor chip surface. Binding of the peptide to the functionalization (black) served as control. The increase of the phase signal ΔΦ indicates an additional mass loading on the chip surface being more pronounced for PS than for PC:PS (upper panel); the increase of the amplitude signal ΔA corresponds to an increased viscosity on the surface (lower panel). Shown are average curves of five individual sensor channels. (D) Fluorescence resonance energy transfer (FRET) spectroscopy. Intercalation of ADAM10 peptide into PS liposomes (green) and PC:PS (9:1) liposomes (red). The liposomes are double labelled with NBD-PE (donor) and Rhodamine-DHPE (acceptor). An increased ratio between donor and acceptor fluorescence intensities indicates insertion of peptides between the lipid molecules. This effect is only visible for PS liposomes but not for PC:PS liposomes. Controls (grey and black) show no effect. Error bars indicate the standard deviations of three independent measurements.
Figure 7
Figure 7
Deletion of cationic amino acids in the ADAM10 stalk region impairs sheddase function. (A) A potential PS-binding motif (R657/K659/K660) was exchanged creating an ADAM10 stalk mutant (ADAM10-stalk Mut). (B) ADAM17/ADAM10 double-deficient HEK cells were co-transfected with BTC-AP and WT-ADAM10 (A10-WT), inactive ADAM10 (A10 E/A), or ADAM10 mutant and stimulated with ionomycin (IO, 1 μM) or melittin (Mel, 1 μM) for 30 min. AP-activity in the supernatant was calculated in relation to total (supernatant and cell pellet) AP activity and is shown in comparison to A10-WT as ‘control’. * indicates a significant increase compared to unstimulated cells; # indicates significant decrease compared to A10-WT transfected stimulated cells (P < 0.05, n = 3; ±SEM). Data were analysed by one-way analysis of variance and Bonferroni multiple comparison post hoc test.
Figure 8
Figure 8
Model of ADAM10 sheddase activation. (A) Stimuli leading to elevation of intracellular calcium induce ANO6 scramblase activation and PS externalization from the inner to the outer cell membrane leaflet. Hyperactive ANO6 induces ADAM10-mediated shedding even in the absence of any stimulus. Cationic amino acid residues in the stalk region of ADAM10 might interact with the negatively charged PS-head group. ADAM10–PS interaction seems to be a prerequisite for induced shedding. (B) Ribbon representation of the X-ray structure of the extracellular region of ADAM10 (pdb accession code: 6BE6) (Seegar et al., 2017). Colour coding of the different domains is according to A and the Zn-ion in the catalytic centre is depicted in red. Cationic amino-acid residues in the stalk region responsible for the PS interaction are missing in the X-ray structure and are depicted in one-letter code.

References

    1. Andra J., Bohling A., Gronewold T.M., et al. (2008). Surface acoustic wave biosensor as a tool to study the interaction of antimicrobial peptides with phospholipid and lipopolysaccharide model membranes. Langmuir 24, 9148–9153. - PubMed
    1. Andra J., Koch M.H., Bartels R., et al. (2004). Biophysical characterization of endotoxin inactivation by NK-2, an antimicrobial peptide derived from mammalian NK-lysin. Antimicrob. Agents Chemother. 48, 1593–1599. - PMC - PubMed
    1. Bevers E.M., and Williamson P.L. (2016). Getting to the outer leaflet: physiology of phosphatidylserine exposure at the plasma membrane. Physiol. Rev. 96, 605–645. - PubMed
    1. Boukamp P., Petrussevska R.T., Breitkreutz D., et al. (1988). Normal keratinization in a spontaneously immortalized aneuploid human keratinocyte cell line. J. Cell Biol. 106, 761–771. - PMC - PubMed
    1. Brandenburg K., David A., Howe J., et al. (2005). Temperature dependence of the binding of endotoxins to the polycationic peptides polymyxin B and its nonapeptide. Biophys. J. 88, 1845–1858. - PMC - PubMed

Publication types