. 2019 Jun 5;220(1):139-150.
doi: 10.1093/infdis/jiz064.

Metformin Alters Human Host Responses to Mycobacterium tuberculosis in Healthy Subjects

Affiliations

Metformin Alters Human Host Responses to Mycobacterium tuberculosis in Healthy Subjects

Ekta Lachmandas et al. J Infect Dis. .

Abstract

Background: Metformin, the most widely administered diabetes drug, has been proposed as a candidate adjunctive host-directed therapy for tuberculosis, but little is known about its effects on human host responses to Mycobacterium tuberculosis.

Methods: We investigated in vitro and in vivo effects of metformin in humans.

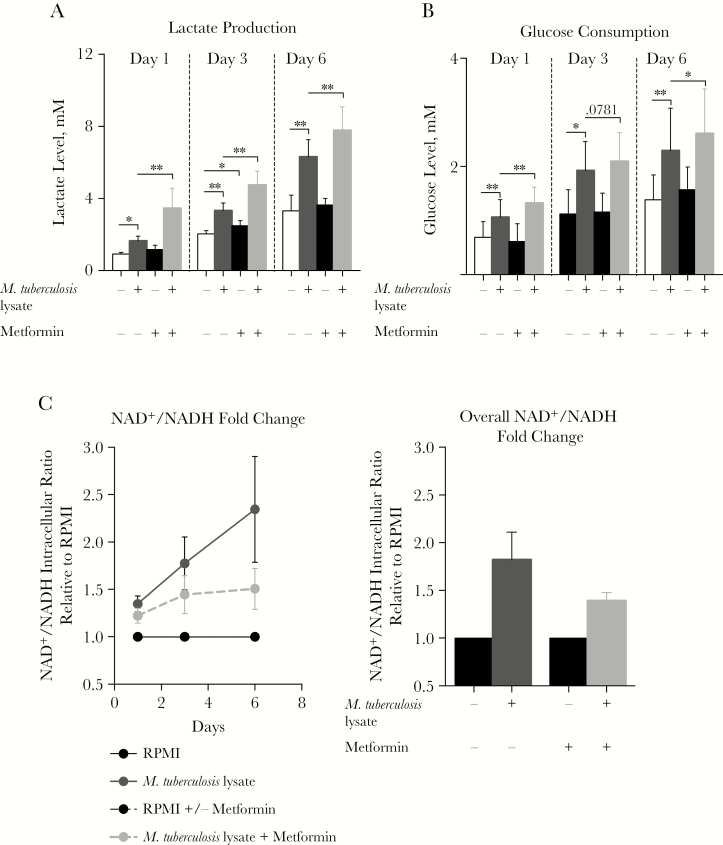
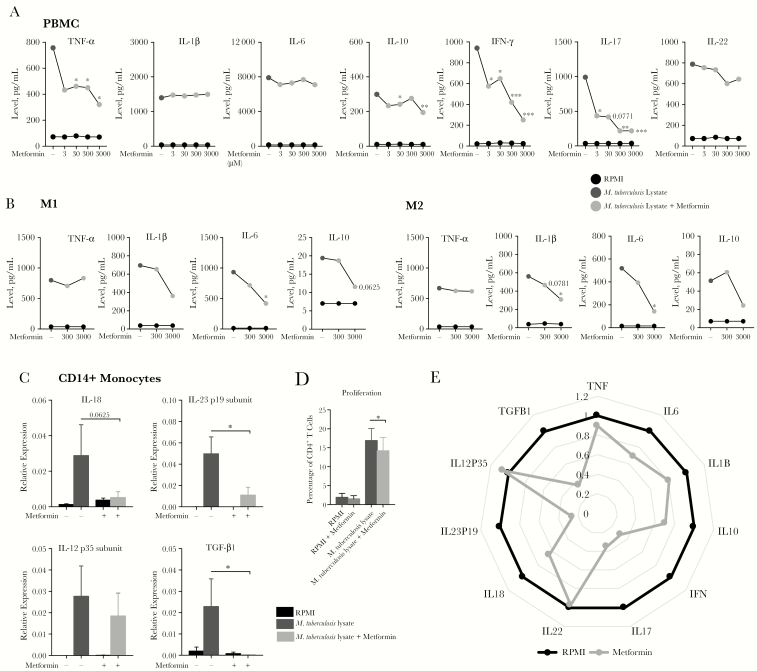
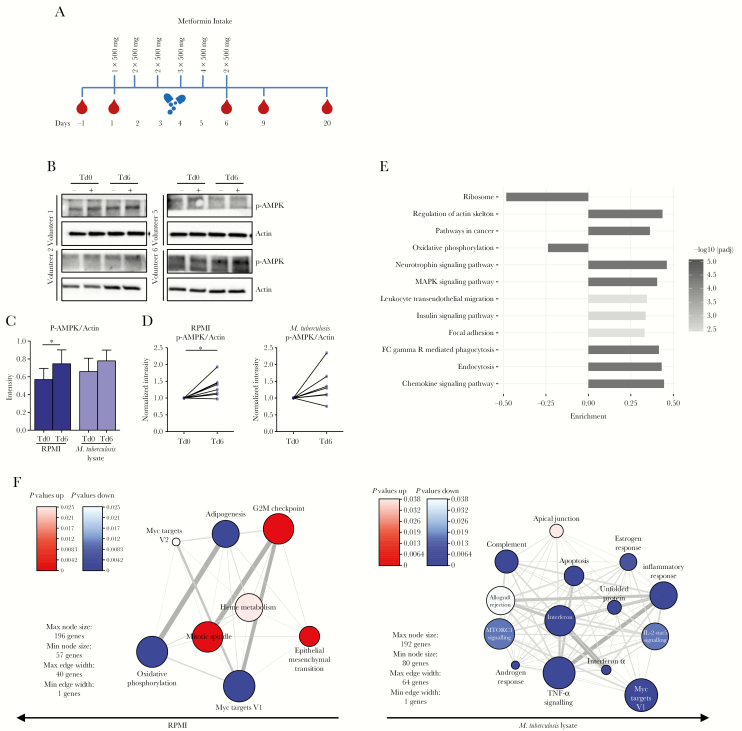
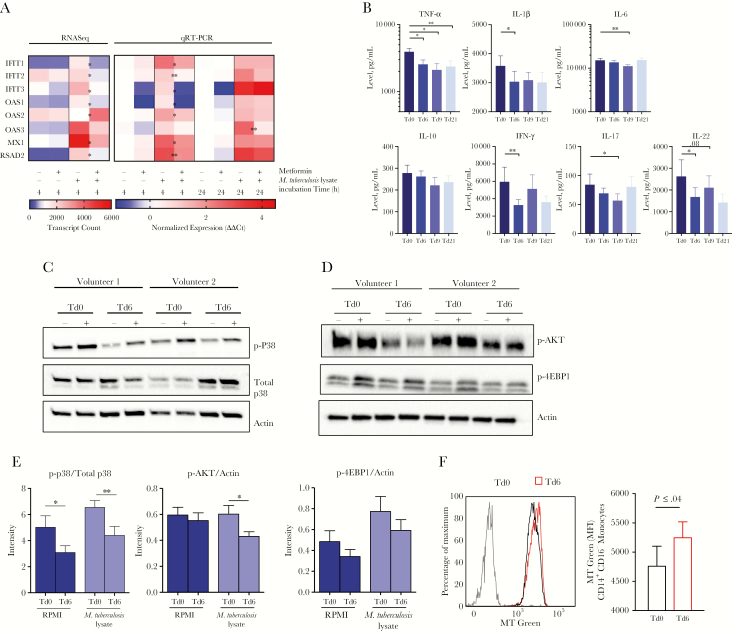
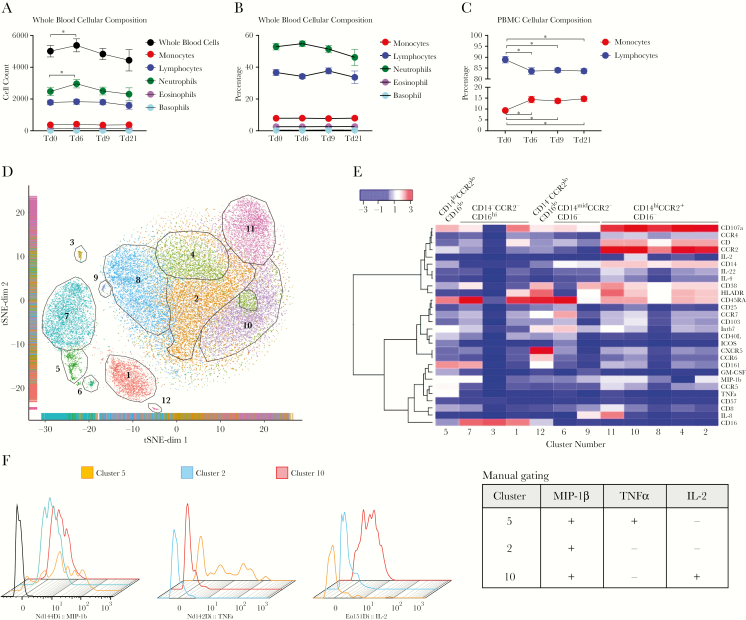
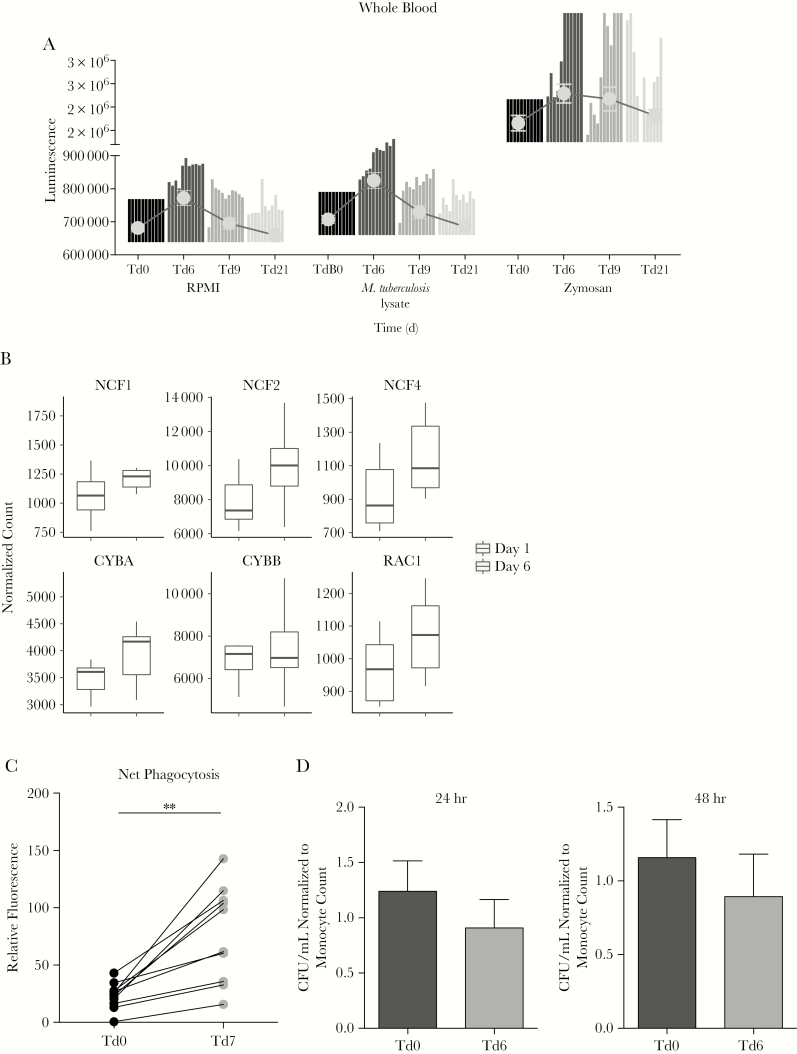
Results: Metformin added to peripheral blood mononuclear cells from healthy volunteers enhanced in vitro cellular metabolism while inhibiting the mammalian target of rapamycin targets p70S6K and 4EBP1, with decreased cytokine production and cellular proliferation and increased phagocytosis activity. Metformin administered to healthy human volunteers led to significant downregulation of genes involved in oxidative phosphorylation, mammalian target of rapamycin signaling, and type I interferon response pathways, particularly following stimulation with M. tuberculosis, and upregulation of genes involved in phagocytosis and reactive oxygen species production was increased. These in vivo effects were accompanied by a metformin-induced shift in myeloid cells from classical to nonclassical monocytes. At a functional level, metformin lowered ex vivo production of tumor necrosis factor α, interferon γ, and interleukin 1β but increased phagocytosis activity and reactive oxygen species production.

Conclusion: Metformin has a range of potentially beneficial effects on cellular metabolism, immune function, and gene transcription involved in innate host responses to M. tuberculosis.

Keywords: Metformin; antimycobacterial mechanisms; gene transcription; host-directed therapy; tuberculosis.


Figures

Figure 1.
Figure 1.
Metformin alters the mammalian target of rapamycin (mTOR) signaling axis while maintaining glucose regulatory effects. A, C, and D, Lactate production (A), glucose consumption (C), and fold change in nicotinamide adenine dinucleotide (oxidized; NAD+)/nicotinamide adenine dinucleotide (reduced; NADH) levels (D) in peripheral blood mononuclear cells (PBMCs) stimulated with Mycobacterium tuberculosis lysate in the presence or absence of 1000 µM metformin for 24 hours, 48 hours, or 7 days. For panel A, data are from 2 individual experiments. For panels AC, data are shown as means ± standard errors of the mean from 2–3 experiments and 6–9 donors. RPMI, Roswell Park Memorial Institute medium. *P < .05 and ** P < .01, by the Wilcoxon matched-pairs signed rank test.
Figure 2.
Figure 2.
Metformin affects the cytokine profile of human cells stimulated with Mycobacterium tuberculosis. A and B, Cytokine production from human peripheral blood mononuclear cells (PBMCs; A) and monocyte-derived M1 and M2 macrophages (B) stimulated with M. tuberculosis lysate, with or without 3–3000µM of metformin for 24 hours (for tumor necrosis factor α [TNF-α], interleukin 6 [IL-6], interleukin 1β [IL-1β], and interleukin 10 [IL-10]) or 7 days (for interferon γ [IFN-γ], interleukin 17 [IL-17], and interleukin 22 [IL-22]). C, Cytokine gene expression in CD14+ monocytes stimulated with M. tuberculosis lysate with or without 3000 µM metformin after 4 hours (for interleukin 18 [IL-18] and transforming growth factor β1 [TGF-β1]) or 24 hours (for interleukin 23p19 [IL-23p19] and interleukin 12p35 [IL-12p35]). D, Percentage CD4+ T-cell proliferation in PBMCs stimulated with M. tuberculosis lysate in the presence or absence of 300 µM metformin for 6 days, using carboxyfluorescein succinimidyl ester labeling to track generations. E, Fold change in cytokine production by PBMCs stimulated with M. tuberculosis lysate with 3000 µM metformin, relative to stimulation in the absence of metformin. Values <1 indicate reduced cytokine production. This is indicated by projection toward the center of the radius. All data are means ± standard errors of the mean. For panels AC and E, data are from 3 experiments and 6–13 donors. For panel D, data are from 4 experiments and 7 donors. *P < .05 and **P < .01, by the Wilcoxon matched-pairs signed rank test (for panels A–C) and the paired t test (for panel D).
Figure 3.
Figure 3.
Global effects of metformin in healthy human volunteers. A, Healthy volunteers (n = 11) received an increasing dose of metformin for 5 consecutive days. Blood specimens were collected twice before and several times after metformin treatment. B, Western blot analysis of p-AMPK in lysates of peripheral blood mononuclear cells (PBMCs) collected from healthy volunteers before and after metformin intake and stimulated for 2 hours with Roswell Park Memorial Institute medium (RPMI; −) or Mycobacterium tuberculosis lysate (+). Four representative donors are shown. C, Quantitative relative band intensity analysis of phospho-AMPK (p-AMPK) before (treatment day 0 [Td0]) and after (Td6) metformin treatment in samples stimulated with RPMI or M. tuberculosis lysate. Data are means ± standard errors of the mean for 8 donors. D, Fold change in p-AMPK levels before (Td0) and after (Td6) metformin treatment in samples stimulated with RPMI or M. tuberculosis lysate. Data for 8 donors are shown. *P < .05 and **P < .01, by the paired t test. Western blot data are normalized to the loading control, actin. E, Gene set analysis of RNA sequencing data, showing Kyoto Encyclopedia of Genes and Genomes pathways that were differentially expressed in ex vivo blood samples following metformin administration. The bar length indicates the magnitude of the change of expression of the gene set. Data were analyzed using the Piano R package, and pathways with adjusted P values < .01 are shown. F, Hallmark gene set enrichment and network analysis, showing gene sets upregulated (red) or downregulated (blue) following metformin administration in resting PBMCs or those stimulated with M. tuberculosis lysate for 4 hours. The color intensity indicates the adjusted P value for the gene set enrichment. IL-2, interleukin 2; TNF-α, tumor necrosis factor α.
Figure 4.
Figure 4.
Metformin intake in healthy volunteers affects cytokine production via p38 and AKT inhibition. A, Expression of 8 genes in the “response to type 1 interferon” Gene Ontology group among peripheral blood mononuclear cells (PBMCs) collected before and after in vivo metformin administration from healthy volunteers and stimulated with Mycobacterium tuberculosis lysate in vitro for 4 or 24 hours. Expression measured by RNA sequence (RNAseq) analysis (at 4 hours) and quantitative reverse transcription–polymerase chain reaction (qRT-PCR) analysis (at 4 and 24 hours). B, Cytokine production from isolated PBMCs collected before and after metformin intake and stimulated with M. tuberculosis lysate for 24 hours (for tumor necrosis factor α [TNF-α], interleukin 6 [IL-6], interleukin 1β [IL-1β], and interleukin 10 [IL-10]) or after 7 days (for interferon γ [IFN-γ], interleukin 17 [IL-17], or interleukin 22 [IL-22]) in the presence of 10% pooled human serum. C and D, Findings of Western blot analysis of phospho-p38 (p-p38) and total p38 levels (C) and p-AKT and p-4EBP1 levels (D) in lysates of PBMCs collected from healthy volunteers before and after metformin intake and stimulated for 2 hours in Roswell Park Memorial Institute medium (RPMI; −) or M. tuberculosis lysate (+). Data are representative of 4 of 8 evaluated donors from the trial. Western blot data are normalized to the loading control, actin. E, Fold change in p-p38/total p38 levels, p-AKT/actin levels, or p-4EBP1/actin levels in PBMCs collected before (treatment day 0 [Td0]) versus those collected after (Td6) metformin treatment and stimulated with RPMI or M. tuberculosis lysate. F, Mitochondrial mass assessment in CD14+CD16- monocytes. The left panel is overlay of data from before and after metformin treatment in a specimen from the same individual. The right panel should the median fluorescence intensity (MFI) yielded by MitoTracker Green (MT) in 3 samples. Gray, FMO control. *P < .05 and **P < .01, by the paired t test. Western blot data are mean values ± standard errors of the mean and are representative of 8 donors presented in panels C or D or Supplementary Figure 3A or 3B.
Figure 5.
Figure 5.
Metformin intake in healthy volunteers alters the blood cellular composition landscape. AC, Analysis of leukocyte counts plotted as raw cell counts for whole blood (A), as percentage of total counts for whole blood (B), and as percentage of total counts for isolated peripheral blood mononuclear cells (PBMCs; C). D, Cryopreserved PBMCs collected before (treatment day 0 [Td0]) or after (Td6) metformin intake were stimulated with PMA-ionomycin and analyzed by mass cytometry. t-distributed stochastic neighbor embedding (tSNE) analysis of single-cell data from blood monocytes in analyzed samples. Cells were plotted and color-coded on the basis of the 12 “unsupervised” Phenograph clusters. E, Heat-plot summary of the average median expression of each marker analyzed for the 12 clusters identified. Twelve clusters are divided into 5 subsets, based on the expression of CD14, CD16, and CCR2. F, Mass cytometry data were analyzed by a manual gating strategy. The 3 differentially regulated monocyte clusters were overlayed to assess the expression of cytokines. The table on right indicates the depiction of (in terms of + [expression] and – [no expression]) which cluster expresses which cytokine, based on the manual gating strategy.
Figure 6.
Figure 6.
Metformin intake in healthy volunteers affects ex vivo antimycobacterial defense mechanisms but not Mycobacterium tuberculosis outgrowth. A, Reactive oxygen species (ROS) production, as measured by luminol reaction, in whole-blood specimens collected from volunteers before and after metformin treatment and stimulated with Roswell Park Memorial Institute medium (RPMI), M. tuberculosis lysate, or zymosan. Data are representative of 11 individual donors. Bars representing the fold change in production in specimens collected on treatment day 6 (Td6), Td9, or Td21 over that in specimens collected on Td0 for each individual donor are superimposed with gray dots representing mean values ± standard errors of the mean. B, Expression of 6 genes encoding key NADPH oxidase proteins for ROS production were assessed in ex vivo blood specimens by RNA sequencing analysis (RNAseq) before and after administration of metformin in the healthy volunteers. *P < .05 and **P < .01, by the Wilcoxon matched-pairs signed rank test. C, Net phagocytosis of pHrodo conjugates in healthy volunteers given metformin for 7 days. Upon RBC lysis, blood cells were incubated with the pHrodo suspension for 2 hours in an incubator without elevated CO2 levels at 37°C before measuring fluorescence. D, Numbers of colony-forming units (CFU) per milliliter after 24 hours or 48 hours of infection of peripheral blood mononuclear cells that were obtained from volunteers before and after metformin treatment and then infected with mycobacteria. Data were normalized to the monocyte count.

Similar articles

Cited by

References

    1. Jeon CY, Murray MB. Diabetes mellitus increases the risk of active tuberculosis: a systematic review of 13 observational studies. PLoS Med 2008; 5:e152. - PMC - PubMed
    1. Baker MA, Harries AD, Jeon CY, et al. . The impact of diabetes on tuberculosis treatment outcomes: a systematic review. BMC Med 2011; 9:81. - PMC - PubMed
    1. Lachmandas E, Beigier-Bompadre M, Cheng SC, et al. . Rewiring cellular metabolism via the AKT/mTOR pathway contributes to host defence against Mycobacterium tuberculosis in human and murine cells. Eur J Immunol 2016; 46:2574–86. - PMC - PubMed
    1. Singhal A, Jie L, Kumar P, et al. . Metformin as adjunct antituberculosis therapy. Sci Transl Med 2014; 6:263ra159. - PubMed
    1. Leow MK, Dalan R, Chee CB, et al. . Latent tuberculosis in patients with diabetes mellitus: prevalence, progression and public health implications. Exp Clin Endocrinol Diabetes 2014; 122:528–32. - PubMed

Publication types

MeSH terms