. 2019 Apr 23;47(7):3395-3406.
doi: 10.1093/nar/gkz060.

The E3-ligases SCFPpa and APC/CCdh1 co-operate to regulate CENP-ACID expression across the cell cycle

Affiliations

The E3-ligases SCFPpa and APC/CCdh1 co-operate to regulate CENP-ACID expression across the cell cycle

Olga Moreno-Moreno et al. Nucleic Acids Res. .

Abstract

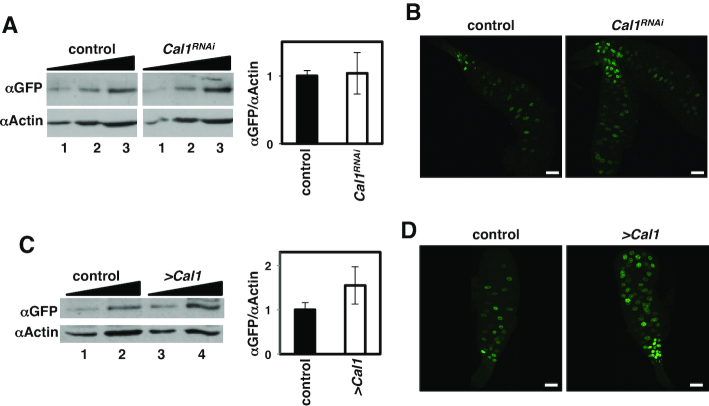
Centromere identity is determined by the specific deposition of CENP-A, a histone H3 variant localizing exclusively at centromeres. Increased CENP-A expression, which is a frequent event in cancer, causes mislocalization, ectopic kinetochore assembly and genomic instability. Proteolysis regulates CENP-A expression and prevents its misincorporation across chromatin. How proteolysis restricts CENP-A localization to centromeres is not well understood. Here we report that, in Drosophila, CENP-ACID expression levels are regulated throughout the cell cycle by the combined action of SCFPpa and APC/CCdh1. We show that SCFPpa regulates CENP-ACID expression in G1 and, importantly, in S-phase preventing its promiscuous incorporation across chromatin during replication. In G1, CENP-ACID expression is also regulated by APC/CCdh1. We also show that Cal1, the specific chaperone that deposits CENP-ACID at centromeres, protects CENP-ACID from SCFPpa-mediated degradation but not from APC/CCdh1-mediated degradation. These results suggest that, whereas SCFPpa targets the fraction of CENP-ACID that is not in complex with Cal1, APC/CCdh1 mediates also degradation of the Cal1-CENP-ACID complex and, thus, likely contributes to the regulation of centromeric CENP-ACID deposition.


Figures

Figure 1.
Figure 1.
Ppa regulates CENP-ACID expression in G1. (A) Schematic representation of the synchronization induced by the morphogenetic furrow (MF) in the eye imaginal disc. FMW, first mitotic wave. SMW, second mitotic wave. G1, G1-arrested cells. MF moves from posterior to anterior as indicated. (B) The expression of CENP-ACID::YFP in the eye imaginal disc is determined by direct fluorescence (in green) in control ey3.5>CENP-ACID::YFP flies (top) and upon Ppa depletion in ey3.5>CENP-ACID::YFP; ppaRNAi flies (bottom). Immunostainings with αPH3, which marks mitotic cells, are also presented (in red). DNA was stained with DAPI (in white). The position of the MF is indicated. Scale bar corresponds to 25 μm. (C) The number of posterior αPH3-positive cells per disc is presented for control ey3.5>CENP-ACID::YFP flies (N = 10) and Ppa-depleted ey3.5>CENP-ACID::YFP; ppaRNAi flies (N = 7) (P-value > 0.01, two-tailed t-test; error bars are SEM). D) In the left, the eye phenotypes of control ey3.5>CENP-ACID::YFP flies and Ppa-depleted ey3.5>CENP-ACID::YFP; ppaRNAi flies are presented. Scale bar corresponds to 100 μm. In the right, quantitative analysis of the results showing box plots of the eye area of control ey3.5>CENP-ACID::YFP flies (N = 20) and Ppa-depleted ey3.5>CENP-ACID::YFP; ppaRNAi flies (N = 20). (P-value > 0.01, two-tailed t-test). (E) In the left, enlarged images of the region indicated by the box in A. Scale bar corresponds to 10 μm. In the right, the percentage of cells showing high levels of mislocalized CENP-ACID::YFP in the posterior region of eye imaginal discs from control ey3.5>CENP-ACID::YFP flies (N = 7) and Ppa-depleted ey3.5>CENP-ACID::YFP; ppaRNAi flies (N = 5) is presented for total and αPH3-negative and –positive cells (**P-value < 0.001, two-tailed t-test; errors bars are SEM).
Figure 2.
Figure 2.
Ppa regulates CENP-ACID expression during DNA replication. (A) The expression of CENP-ACID::YFP in salivary glands is determined by direct fluorescence (in green) in control ey3.5>CENP-ACID::YFP flies (top) and Ppa-depleted ey3.5>CENP-ACID::YFP; ppaRNAi flies (bottom). DNA was stained with DAPI (in white). Scale bars correspond to 100 μm. (B) Western blot (WB) analysis with αGFP antibodies of the levels of CENP-ACID::YFP expression in salivary glands from control ey3.5>CENP-ACID::YFP flies and Ppa-depleted ey3.5>CENP-ACID::YFP; ppaRNAi flies. Increasing amounts of extract are analyzed (lanes 1–3). αActin antibodies were used as loading control. Quantitative analysis of the results is shown in the bottom (N = 3; ****P-value < 0.00001, two-tailed t-test; errors bars are SEM). (C) As in A, but for salivary glands subjected to EdU-incorporation (in red) to detect replicating cells. Arrows indicate EdU-positive cells. Scale bars correspond to 100 μm. (D) The percentage of EdU-positive salivary gland cells is presented for control ey3.5>CENP-ACID::YFP flies (N = 8) and Ppa-depleted ey3.5>CENP-ACID::YFP; ppaRNAi flies (N = 12) (P-value > 0.01, two-tailed t-test; error bars are SEM). (E) In the left, the number of nuclei per gland is presented for control ey3.5>CENP-ACID::YFP flies (N = 10) and Ppa-depleted ey3.5>CENP-ACID::YFP; ppaRNAi flies (N = 24) (P-value > 0.01, two-tailed t-test; error bars are SEM). In the right, nuclei area of salivary glands cells is presented for control ey3.5>CENP-ACID::YFP flies (N = 10) and Ppa-depleted ey3.5>CENP-ACID::YFP; ppaRNAi flies (N = 24) (P-value > 0.01, two-tailed t-test; error bars are SEM).
Figure 3.
Figure 3.
Ppa does not regulate CENP-ACID expression in differentiated cells in the eye imaginal disc. (A) The expression of CENP-ACID::YFP in the eye imaginal disc is determined by direct fluorescence (in green) in control longGMR>CENP-ACID::YFP flies (left) and Ppa-depleted longGMR>CENP-ACID::YFP; ppaRNAi flies (right). DNA was stained with DAPI (in white). The position of the MF is indicated. Scale bars correspond to 25 μm. (B) The eye phenotypes of control longGMR-GAL4 flies and Ppa-depleted longGMR>ppaRNAi flies, expressing CENP-ACID::YFP (+) or not (–), are presented. Scale bars correspond to 100 μm. In the bottom, the proportions of flies showing strong, mild or no necrotic eye phenotype are presented for the indicated genotypes (N > 56). (C) Immunostaining with αELAV (in blue), which marks neuronal differentiated cells, and αPH3 (in red), which marks mitotic cells, of eye imaginal discs from Ppa-depleted longGMR>CENP-ACID::YFP; ppaRNAi flies. CENP-ACID::YFP expression is determined by direct fluorescence (in green). DNA was stained with DAPI (in white). The position of the MF is indicated. Scale bar corresponds to 25 μm.
Figure 4.
Figure 4.
APC/C regulates CENP-ACID expression. (A) The expression of CENP-ACID::YFP in salivary glands is determined by direct fluorescence (in green) in control ey3.5>CENP-ACID::YFP flies (top) and APC2-depleted ey3.5>CENP-ACID::YFP; APC2RNAi flies (bottom). DNA was stained with DAPI (in white). Scale bars correspond to 100 μm. (B) WB analysis with αGFP antibodies of the levels of CENP-ACID::YFP expression in salivary glands from control ey3.5>CENP-ACID::YFP flies and APC2-depleted ey3.5>CENP-ACID::YFP; APC2RNAi flies. αActin antibodies were used as loading control. Quantitative analysis of the results is shown in the bottom (N = 2; *P-value < 0.01, two-tailed t-test; error bars are SEM). (C) As in A but for control ey3.5>CENP-ACID::YFP flies and Cdh1-depleted ey3.5>CENP-ACID::YFP; Cdh1RNAi flies. (D) As in B but for control ey3.5>CENP-ACID::YFP flies, Cdc20-depleted ey3.5>CENP-ACID::YFP; Cdc20RNAi flies and Cdh1-depleted ey3.5>CENP-ACID::YFP; Cdh1RNAi flies Quantitative analysis of the results is shown in the bottom (N ≥ 2; *P < 0.01, ****P < 0.00001, two-tailed t-test; error bars are SEM). (E) In the top, the number of nuclei per gland is presented for control ey3.5>CENP-ACID::YFP flies (N = 10), APC2-depleted ey3.5>CENP-ACID::YFP; APC2RNAi flies (N = 2), Cdh1-depleted ey3.5>CENP-ACID::YFP; Cdh1RNAi flies (N = 8) and Cdc20-depleted ey3.5>CENP-ACID::YFP; Cdc20RNAi flies (N = 4) (P-value > 0.01, two-tailed t-test; error bars are SEM). In the bottom, nuclei area of salivary glands cells is presented for control ey3.5>CENP-ACID::YFP flies (N = 10), APC2-depleted ey3.5>CENP-ACID::YFP; APC2RNAi flies (N = 2), Cdh1-depleted ey3.5>CENP-ACID::YFP; Cdh1RNAi flies (N = 8) and Cdc20-depleted ey3.5>CENP-ACID::YFP; Cdc20RNAi flies (N = 4) (P-value > 0.01, two-tailed t-test; error bars are SEM).
Figure 5.
Figure 5.
APC/C regulates endogenous CENP-ACID levels. (A) Endogenous CENP-ACID expression in the eye imaginal disc is determined by immunostaining with αCENP-ACID (in green) in control ey3.5 (top) and Cdh1-depleted ey3.5>Cdh1RNAi flies (bottom). Immunostainings with αPH3, which marks mitotic cells, are also presented (in red). DNA was stained with DAPI (in white). The position of the MF is indicated. Scale bar corresponds to 25 μm. In the bottom, the integrated intensity of fluorescence in posterior versus anterior cells is presented for control ey3.5 flies (N = 17) and Cdh1-depleted ey3.5>Cdh1RNAi flies (N = 13) (****P-value < 0.0001; two-tailed t-test; errors bars are SEM). (B) Immunostaining with αCENP-ACID (in red) of brain squashes from control elav-GAL4 (top), APC2-depleted elav>APC2RNAi (center) and APC10-depleted elav>APC10RNAi larvae (bottom). DNA was stained with DAPI (in blue). Scale bars correspond to 5 μm.
Figure 6.
Figure 6.
The contribution of Cal1 to CENP-ACID expression. (A) WB analysis with αGFP antibodies of the levels of CENP-ACID::YFP expression in salivary glands from control ey3.5>CENP-ACID::YFP flies and Cal1-depleted ey3.5>CENP-ACID::YFP; Cal1RNAi flies. Increasing amounts of extract are analyzed (lanes 1–3). αActin antibodies were used as loading control. Quantitative analysis of the results is shown in the right (N = 3; P-value > 0.01, two-tailed t-test; errors bars are SEM). (B) The expression of CENP-ACID::YFP in salivary glands is determined by direct fluorescence (in green) in control ey3.5>CENP-ACID::YFP flies (left) and Cal1-depleted ey3.5>CENP-ACID::YFP; Cal1RNAi flies (right). Scale bars correspond to 100 μm. (C) As in A but for control ey3.5>CENP-ACID::YFP flies and ey3.5>CENP-ACID::YFP; UAS-Cal1 flies overexpressing Cal1. (N = 2; P-value>0.01, two-tailed t-test; errors bars are SEM). (D) As in B but for control ey3.5>CENP-ACID::YFP flies and ey3.5>CENP-ACID::YFP; UAS-Cal1 flies overexpressing Cal1. Scale bars correspond to 100 μm.
Figure 7.
Figure 7.
Cal 1 protects CENP-ACID from Ppa-mediated degradation. (A) WB analysis with αGFP antibodies of the levels of CENP-ACID::YFP expression in salivary glands from control ey3.5>CENP-ACID::YFP flies, Cdh1-depleted ey3.5>CENP-ACID::YFP; Cdh1RNAi flies and double Cdh1+Cal1-depleted ey3.5>CENP-ACID::YFP; Cdh1RNAi; Cal1RNAi flies. Increasing amounts of extract are analyzed (lanes 1–3). Quantitative analysis of the results is shown in the right (N ≥ 2; *P-value <0.01; error bars are SEM). (B) The expression of CENP-ACID::YFP in salivary glands is determined by direct fluorescence (in green) in Cdh1-depleted ey3.5>CENP-ACID::YFP; Cdh1RNAi flies and double Cdh1+Cal1-depleted ey3.5>CENP-ACID::YFP; Cdh1RNAi; Cal1RNAi flies. Scale bars correspond to 100 μm. (C) As in A but for control ey3.5>CENP-ACID::YFP flies, Cdh1-depleted ey3.5>CENP-ACID::YFP; Cdh1RNAi flies and Cdh1-depleted ey3.5>CENP-ACID::YFP; Cdh1RNAi; UAS-Cal1 flies overexpressing Cal1 (N = 3; P-value > 0.01, two-tailed t-test; errors bars are SEM). (D) As in B but for Cdh1-depleted ey3.5>CENP-ACID::YFP; Cdh1RNAi flies and Cdh1-depleted ey3.5>CENP-ACID::YFP; Cdh1RNAi; UAS-Cal1 flies overexpressing Cal1. For the later, two examples are presented with the gland in the right showing increased CENP-ACID::YFP expression. Scale bars correspond to 100 μm. (E) As in A but for control ey3.5>CENP-ACID::YFP flies, Ppa-depleted ey3.5>CENP-ACID::YFP; ppaRNAi flies and double Ppa+Cal1-depleted ey3.5>CENP-ACID::YFP; ppaRNAi; Cal1RNAi flies (N = 2; P-value > 0.01, two-tailed t-test; errors bars are SEM). (F) As in B but for Ppa-depleted ey3.5>CENP-ACID::YFP; ppaRNAi flies and double Ppa+Cal1-depleted ey3.5>CENP-ACID::YFP; ppaRNAi; Cal1RNAi flies. Scale bars correspond to 100 μm. (G) As in A but for control ey3.5>CENP-ACID::YFP flies, Ppa-depleted ey3.5>CENP-ACID::YFP; ppaRNAi flies and Ppa-depleted ey3.5>CENP-ACID::YFP; ppaRNAi; UAS-Cal1 flies overexpressing Cal1 (N = 2; P-value > 0.01, two-tailed t-test; errors bars are SEM). (H) As in B but for Ppa-depleted ey3.5>CENP-ACID::YFP; ppaRNAi flies and Ppa-depleted ey3.5>CENP-ACID::YFP; ppaRNAi; UAS-Cal1 flies overexpressing Cal1. Scale bars correspond to 100 μm.

Similar articles

Cited by

References

    1. Allshire R.C., Karpen G.H.. Epigenetic regulation of centromeric chromatin: old dogs, new tricks. Nat. Rev. Genet. 2008; 9:923–937. - PMC - PubMed
    1. Black B.E., Cleveland D.W.. Epigenetic centromere propagation and the nature of CENP-A nucleosomes. Cell. 2011; 144:471–479. - PMC - PubMed
    1. Maddox P.S., Corbett K.D., Desai A.. Structure, assembly and reading of centromeric chromatin. Curr. Opin. Genet. Dev. 2012; 22:139–147. - PMC - PubMed
    1. Malik H.S., Henikoff S.. Major evolutionay transitions in centromere complexity. Cell. 2009; 138:1067–1082. - PubMed
    1. Torras-Llort M., Moreno-Moreno O., Azorín F.. Focus on the centre: the role of chromatin on the regulation of centromere identity and function. EMBO J. 2009; 28:2337–2348. - PMC - PubMed

Publication types