

Differential effects of split and continuous sleep on neurobehavioral function and glucose tolerance in sleep-restricted adolescents
- PMID: 30753648
- PMCID: PMC6519912
- DOI: 10.1093/sleep/zsz037
Differential effects of split and continuous sleep on neurobehavioral function and glucose tolerance in sleep-restricted adolescents
Abstract
Study objectives: Many adolescents are exposed to sleep restriction on school nights. We assessed how different apportionment of restricted sleep (continuous vs. split sleep) influences neurobehavioral function and glucose levels.
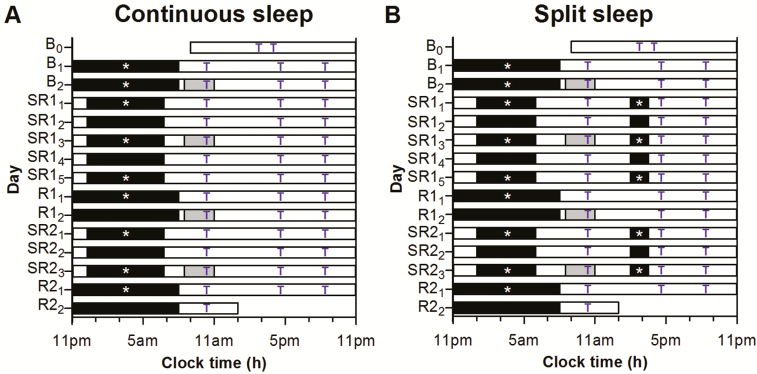
Methods: Adolescents, aged 15-19 years, were evaluated in a dormitory setting using a parallel-group design. Following two baseline nights of 9-hour time-in-bed (TIB), participants underwent either 5 nights of continuous 6.5-h TIB (n = 29) or 5-hour nocturnal TIB with a 1.5-hour afternoon nap (n = 29). After two recovery nights of 9-hour TIB, participants were sleep restricted for another three nights. Sleep was assessed using polysomnography (PSG). Cognitive performance and mood were evaluated three times per day. Oral glucose tolerance tests (OGTT) were conducted on mornings after baseline sleep, recovery sleep, and the third day of each sleep restriction cycle.
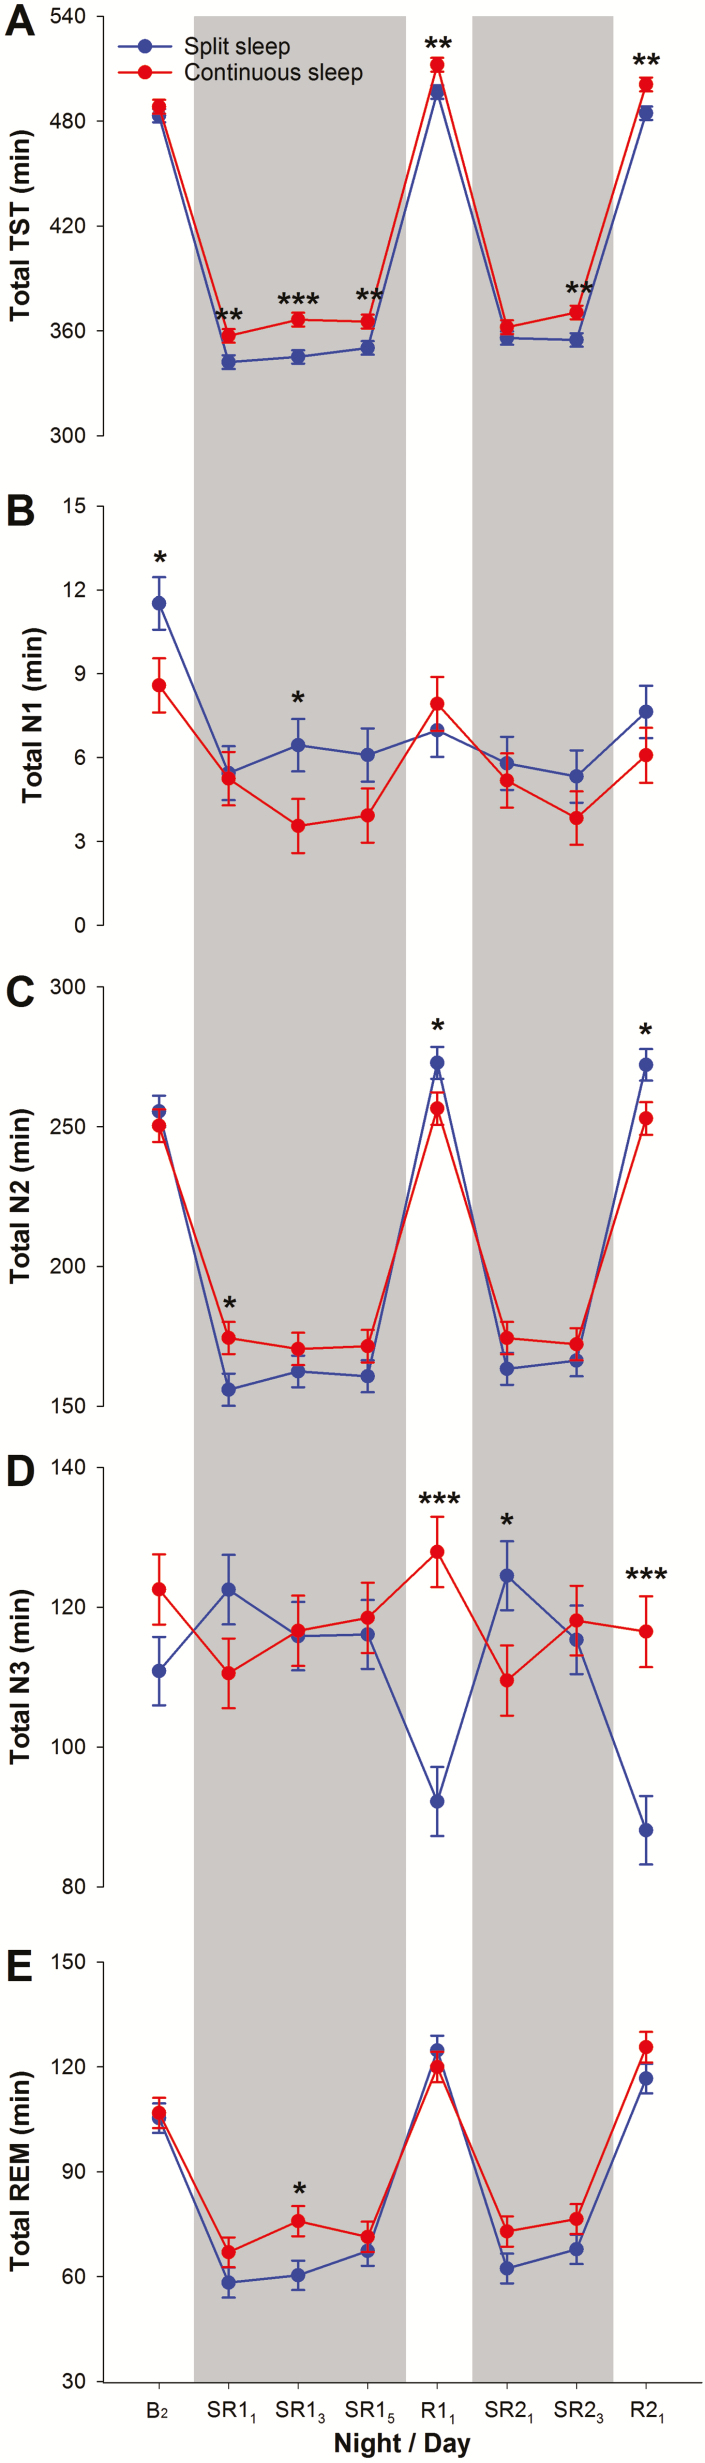
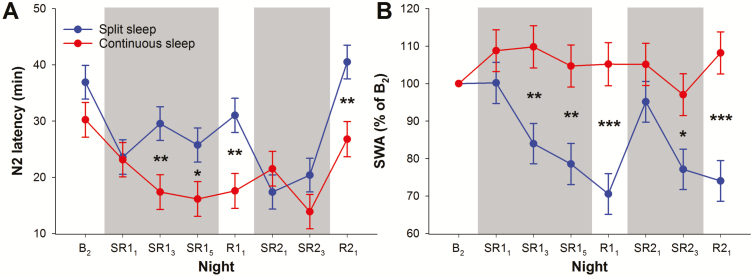
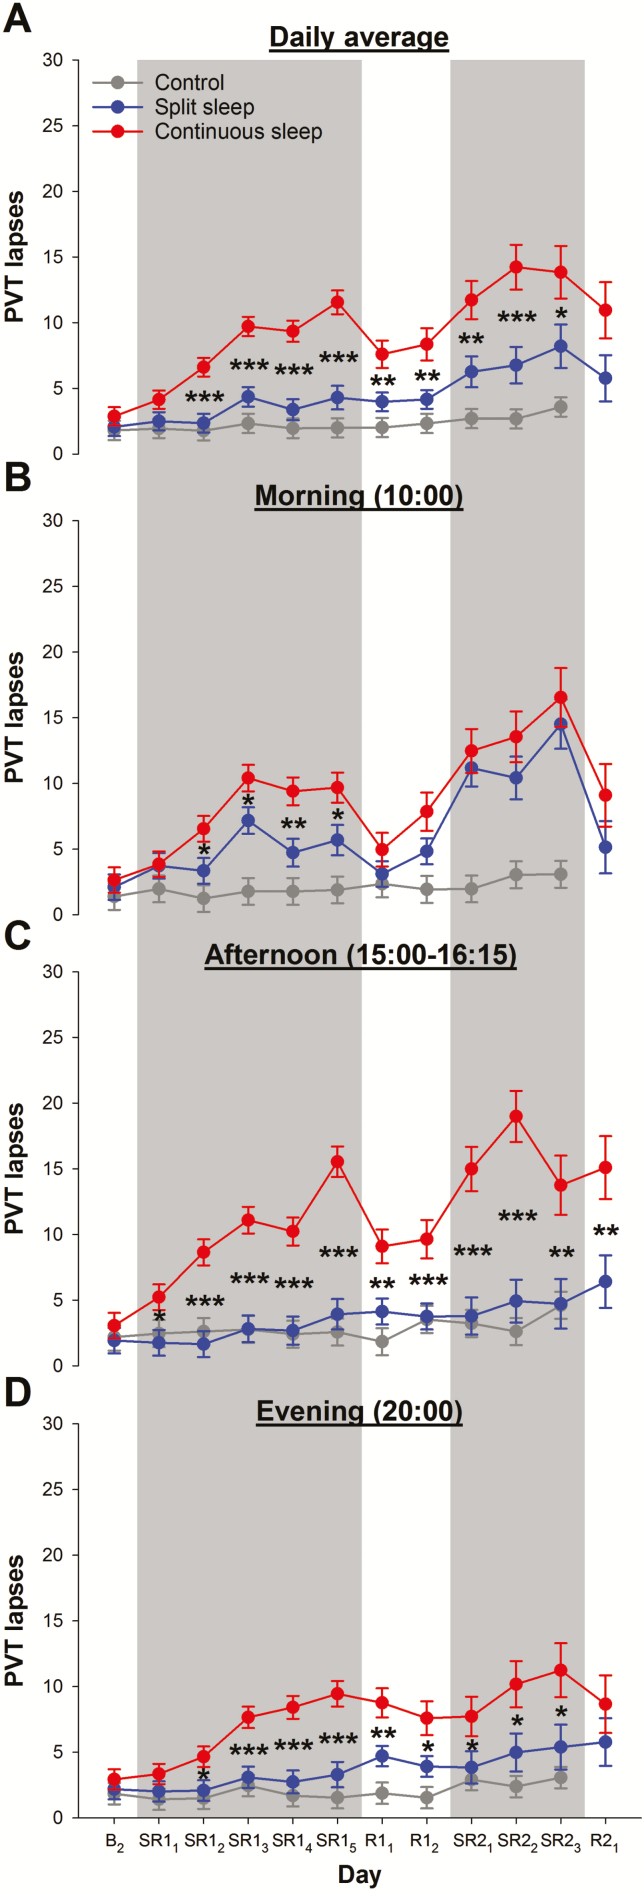
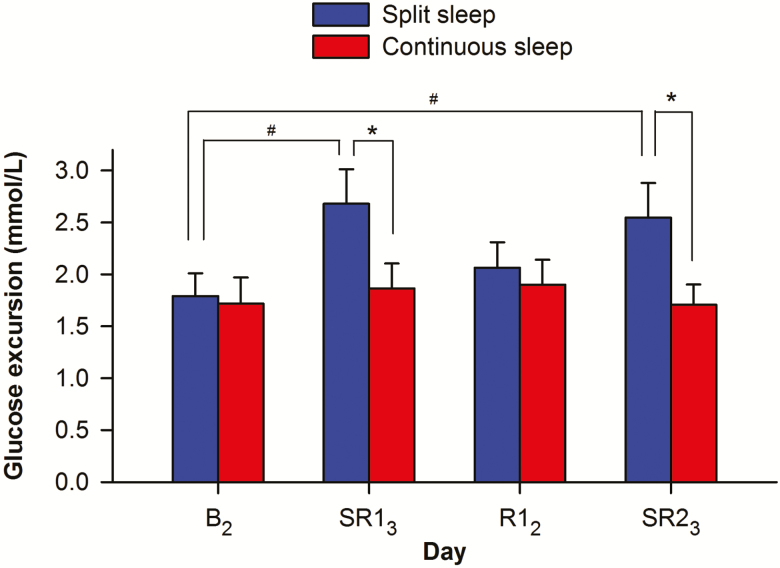
Results: The split sleep group had fewer vigilance lapses, better working memory and executive function, faster processing speed, lower level of subjective sleepiness, and more positive mood, even though PSG-verified total sleep time was less than the continuous sleep group. However, vigilance in both sleep-restricted groups was inferior to adolescents in a prior sample given 9-hour nocturnal TIB. During both cycles of sleep restriction, blood glucose during the OGTT increased by a greater amount in the split sleep schedule compared with persons receiving 6.5-hour continuous sleep.
Conclusions: In adolescents, modest multinight sleep restriction had divergent negative effects on cognitive performance and glucose levels depending on how the restricted sleep was apportioned. They are best advised to obtain the recommended amount of nocturnal sleep.
Trial registration: https://clinicaltrials.gov/ct2/show/NCT03333512.
Keywords: adolescents; cognition; continuous sleep; glucose tolerance; partial sleep deprivation; sleep restriction; split sleep; vigilance.
© Sleep Research Society 2019. Published by Oxford University Press [on behalf of the Sleep Research Society].
Figures
Similar articles
-
Neurobehavioral Impact of Successive Cycles of Sleep Restriction With and Without Naps in Adolescents.Sleep. 2017 Feb 1;40(2):zsw042. doi: 10.1093/sleep/zsw042. Sleep. 2017. PMID: 28364507 Free PMC article. Clinical Trial.
-
Cognitive Performance, Sleepiness, and Mood in Partially Sleep Deprived Adolescents: The Need for Sleep Study.Sleep. 2016 Mar 1;39(3):687-98. doi: 10.5665/sleep.5552. Sleep. 2016. PMID: 26612392 Free PMC article. Clinical Trial.
-
Cognitive effects of split and continuous sleep schedules in adolescents differ according to total sleep opportunity.Sleep. 2020 Dec 14;43(12):zsaa129. doi: 10.1093/sleep/zsaa129. Sleep. 2020. PMID: 32619240 Free PMC article.
-
Adolescent sleep restriction effects on cognition and mood.Prog Brain Res. 2019;246:55-71. doi: 10.1016/bs.pbr.2019.02.008. Epub 2019 Mar 22. Prog Brain Res. 2019. PMID: 31072563 Review.
-
Behavioral and physiological consequences of sleep restriction.J Clin Sleep Med. 2007 Aug 15;3(5):519-28. J Clin Sleep Med. 2007. PMID: 17803017 Free PMC article. Review.
Cited by
-
Association between sleep habits and behavioral problems in early adolescence: a descriptive study.BMC Psychol. 2022 Nov 5;10(1):254. doi: 10.1186/s40359-022-00958-7. BMC Psychol. 2022. PMID: 36335370 Free PMC article.
-
Staying vigilant during recurrent sleep restriction: dose-response effects of time-in-bed and benefits of daytime napping.Sleep. 2022 Apr 11;45(4):zsac023. doi: 10.1093/sleep/zsac023. Sleep. 2022. PMID: 35089345 Free PMC article.
-
Memory performance following napping in habitual and non-habitual nappers.Sleep. 2021 Jun 11;44(6):zsaa277. doi: 10.1093/sleep/zsaa277. Sleep. 2021. PMID: 33313925 Free PMC article. Clinical Trial.
-
Daily fluctuations in adolescents' sleep predict next-day attention, sleepiness, and fatigue: an ecological momentary assessment study over 28 days.J Child Psychol Psychiatry. 2025 May;66(5):686-696. doi: 10.1111/jcpp.14076. Epub 2024 Dec 1. J Child Psychol Psychiatry. 2025. PMID: 39618031 Free PMC article.
-
Daily relations between nap occurrence, duration, and timing and nocturnal sleep patterns in college students.Sleep Health. 2022 Aug;8(4):356-363. doi: 10.1016/j.sleh.2022.05.002. Epub 2022 Jun 19. Sleep Health. 2022. PMID: 35732554 Free PMC article.
References
-
- Hirshkowitz M, et al. . National Sleep Foundation’s sleep time duration recommendations: methodology and results summary. Sleep Health. 2015;1(1):40–43. - PubMed
-
- Gradisar M, et al. . Recent worldwide sleep patterns and problems during adolescence: a review and meta-analysis of age, region, and sleep. Sleep Med. 2011;12(2):110–118. - PubMed
-
- Olds T, et al. . The relationships between sex, age, geography and time in bed in adolescents: a meta-analysis of data from 23 countries. Sleep Med Rev. 2010;14(6):371–378. - PubMed
-
- Belenky G, et al. . Patterns of performance degradation and restoration during sleep restriction and subsequent recovery: a sleep dose-response study. J Sleep Res. 2003;12(1):1–12. - PubMed
Publication types
MeSH terms
Substances
Associated data
LinkOut - more resources
Full Text Sources
Medical
Research Materials
