. 2019 Mar 18;47(5):2472-2486.
doi: 10.1093/nar/gkz082.

Loss of RNA-binding protein GRSF1 activates mTOR to elicit a proinflammatory transcriptional program

Affiliations

Loss of RNA-binding protein GRSF1 activates mTOR to elicit a proinflammatory transcriptional program

Ji Heon Noh et al. Nucleic Acids Res. .

Abstract

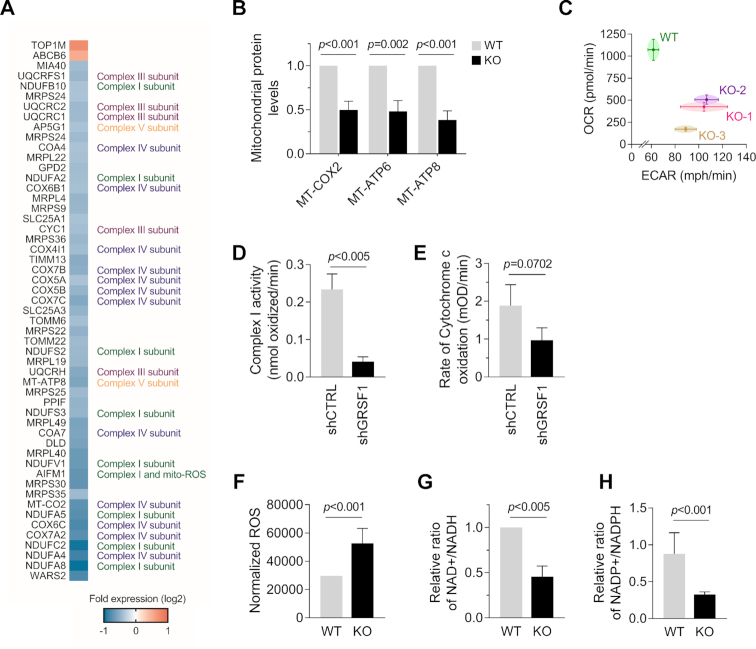
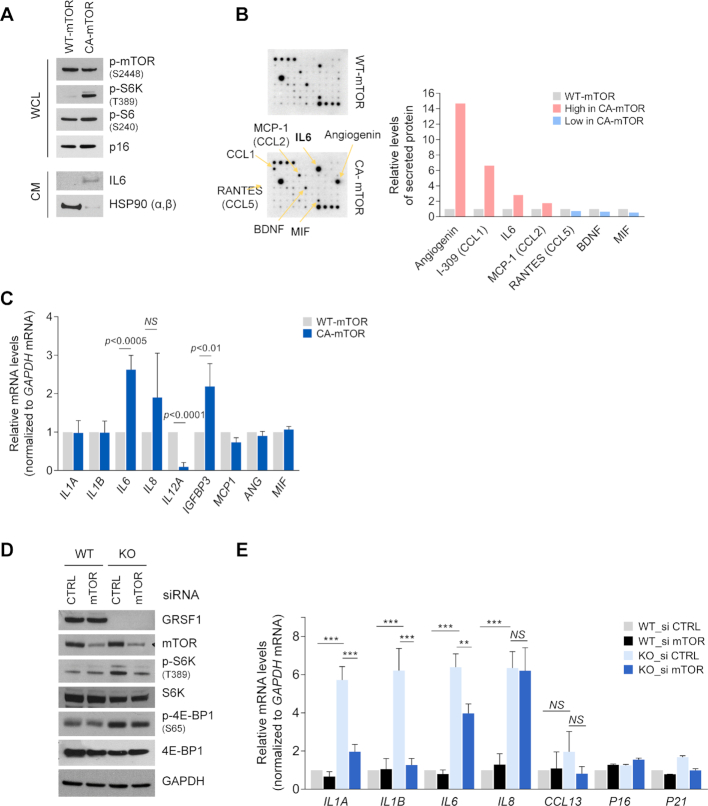
The RNA-binding protein GRSF1 (G-rich RNA sequence-binding factor 1) critically maintains mitochondrial homeostasis. Accordingly, loss of GRSF1 impaired mitochondrial respiration and increased the levels of reactive oxygen species (ROS), triggering DNA damage, growth suppression, and a senescent phenotype characterized by elevated production and secretion of interleukin (IL)6. Here, we characterize the pathways that govern IL6 production in response to mitochondrial dysfunction in GRSF1-depleted cells. We report that loss of GRSF1 broadly altered protein expression programs, impairing the function of respiratory complexes I and IV. The rise in oxidative stress led to increased DNA damage and activation of mTOR, which in turn activated NF-κB to induce IL6 gene transcription and orchestrate a pro-inflammatory program. Collectively, our results indicate that GRSF1 helps preserve mitochondrial homeostasis, in turn preventing oxidative DNA damage and the activation of mTOR and NF-κB, and suppressing a transcriptional pro-inflammatory program leading to increased IL6 production.


Figures

Figure 1.
Figure 1.
GRSF1 ablation increases DNA damage, reduces cell proliferation. (A) GRSF1 was ablated in HEK293 cells via CRISPR-Cas9-mediated gene editing using three different gRNAs (#1, #2, #3). The GRSF1 KO clones selected (KO-1, KO-2, KO-3) are indicated (bold). The expression of GRSF1 and loading controls PNPASE and β-Actin was assessed by Western blot analysis. (B) The growth of WT, KO-1, KO-2, and KO-3 populations was monitored by counting the number of viable cells. (C, D) Constitutive DNA damage was assessed in WT and KO HEK293 cells by the alkaline comet assay and quantified by measuring OTM values (C), and the levels of several DDR proteins in the cell populations were assessed by western blot analysis in nuclear (Nuc) and cytoplasmic (Cyto) lysates (D). GAPDH and HDAC2 were included as cytoplasmic and nuclear markers, respectively; GAPDH and HuR served as loading controls. (E–G) DNA damage was assessed in WT, KO or KO+GRSF1 HEK293 with or without treatment with NAC (10 mM, 2 h) by the alkaline comet assay, as described in panel C (E,F), and by Western blot analysis of cytoplasmic lysates, as described in panel D (G). (H–J) DNA damage was assessed in constitutively silenced pool populations of shCTRL and shGRSF1 cells by the alkaline comet assay and quantified by measuring OTM values (H), the levels of DDR proteins were assessed by Western blot analysis (I), and cell proliferation was assessed by monitoring [3H]-thymidine incorporation (J). The data in (B,J) represent the means ±S.D. from three independent experiments.
Figure 2.
Figure 2.
GRSF1 loss alters protein expression programs and impairs respiratory complexes I and IV. (A) iTRAQ-based quantitative proteomic analysis of the global response to GRSF1 depletion in two HEK293 KO clones relative to WT cells (Materials and Methods). A heat map of the relative abundance of proteins (log2 ratio) was generated from the iTRAQ-derived quantifications. (B) The levels of mitochondrial (MT) proteins COX2, ATP6, and ATP8 were assessed from the mass spec analysis. (C) Basal OCR and ECAR of three GRSF1 KO clonal cells (KO-1, 2 and 3) and parental HEK293 cells (WT) were measured using an extracellular flux (XF) analyzer. (D–H) The enzyme activities of the mitochondrial complex I (D) and IV (E) were analyzed in HEK293 cells stably expressing shGRSF1 or shCTRL; the cellular levels of ROS were measured with the use of a general ROS indicator CM-H2DCFDA (F), and the relative levels of NAD+/NADH (G) and NADP+/NADPH (H) ratios were determined in WT and KO HEK293 cells. The data in (B–H) are the means and ±SD of three independent experiments.
Figure 3.
Figure 3.
Silencing GRSF1 increases production of cytokines including IL6. (A) WT and KO HEK293 cells were cultured in conditioned media (CM) prepared from either WT or KO cells; 48 h later, whole-cell lysates (WCL) were prepared and subsets of phosphorylated proteins were assessed by using antibody arrays and quantified (Supplementary Figure S2). (B) The increase in phosphorylated STAT3, mTOR, S6K, and ERK was validated by Western blot analysis in HEK293 cells expressing normal GRSF1 levels (shCTRL) as well as in two clones of constitutively silenced GRSF1 (shGRSF1_1 and shGRSF1_2). (C) CM was collected from WT and KO cells, analyzed by antibody arrays (left), and the levels of secreted proteins were quantified (right). (D) Secreted IL6 levels in WT and KO HEK293 cells were quantified by AlphaLISA. The data in (A–C) are representative from two independent experiments. The data in (D) represent the means ± SD from three independent experiments.
Figure 4.
Figure 4.
The rise in production of IL6 and cytokines by ablating GRSF1 is largely dependent on mTOR. (A–C) Plasmid vectors expressing WT mTOR or constitutively active (CA) mTOR were transfected into GRSF1 KO HEK293 cells; 24 h later, Rapamycin was added for an additional 18 h, and 48 h post-transfection, the protein and RNA were analyzed. WCL were used for Western blot analysis, including the analysis of several phosphorylated (p-) proteins (A). CM was also collected from the transfected and serum-starved cells in the presence of Rapamycin, and was used to determine IL6 levels by Western blotting (A) and antibody array analysis (left) and quantification (right) (B). Total RNA was used to determine the levels of mRNAs encoding cytokines by RT-qPCR analysis (C). (D, E) WT and KO HEK293 cells were transfected with small interfering (si)RNAs (CTRL or directed to mTOR); 48 h later proteins and RNA were isolated and assessed by Western blotting (D) and RT-qPCR (E) analysis, respectively. The data in (C, E) are the means and ± SD of 3 independent experiments. In (E), **P < 0.005; ***P < 0.0001; NS, not significant.
Figure 5.
Figure 5.
Elevated production of IL6 and other cytokines following GRSF1 ablation is largely dependent on NF-κB activity. (A) Forty-eight hours after transfecting HEK293 cells as explained in Figure 4D, nuclei were fractionated and NF-κB p65 (RelA) activity was determined by an ELISA-based assay (Materials and Methods). (B) Lentiviruses expressing shGRSF1 or shCTRL were introduced into HEK293 cells stably expressing a luciferase (Luc) reporter gene under transcriptional control of an NF-κB p65-responsive element, and the luciferase activity was determined. (C) WT and KO HEK293 cells were transiently transfected with control or NF-κB p65 (RelA)-directed siRNA; 48 h later, the levels of mRNAs encoding cytokines and other factors were determined by RT-qPCR analysis. (D) Following microarray analysis (Arraystar) of total RNA in WT and KO HEK293 cells (3 biological replicates per group), differentially expressed mRNAs that were transcriptional targets of NF-κB p65 were clustered (heat map); inset, relative expression levels of the top 19 mRNAs more highly expressed in KO than in WT (top right). mRNAs showing statistically significant increases or decreases (fold change ≥ 2 and P-value ≤ 0.05) were visualized by Volcano plot; IL6 mRNA is indicated (bottom right). (E) A gene set analysis was performed, and the cellular pathways that are highly enriched under GRSF1-deficiency are listed. (F) Forty-eight hours after silencing NF-κB1 or RelA in KO cells, the levels of IL6 mRNA were quantified by RT-qPCR analysis. Data in (A–C) and (F) are the means and ± SD of three independent experiments; **P < 0.005; ***P < 0.0001; NS, not significant. Microarray analysis was performed in triplicate.
Figure 6.
Figure 6.
Ablation of GRSF1 increases IL6 mRNA production transcriptionally. (A) The relative levels of IL6 mRNA and pre-mRNA were quantified by RT-qPCR analysis in WT and KO HEK293 cells. (B) Nascent IL6 pre-mRNA was quantified by incubating WT and KO cells with 4-SU over a range of times (5 min to 2 h) to label newly transcribed RNA; after biotinylating 4-SU residues and purifying biotinylated, 4-SU-labeled RNA was isolated using streptavidin beads. Newly transcribed IL6 mRNA and newly transcribed GAPDH mRNA (for normalization) were quantified by RT-qPCR analysis. (C) The relative stabilities of IL6, IL1A, and IL1B mRNAs, as well as a control stable transcript (ACTIN mRNA), in WT and KO cells was assessed by incubating cells with actinomycin D for the times indicated, whereupon total RNA was isolated, and the levels of each mRNAs quantified by RT-qPCR analysis and normalized to 18S rRNA levels. Data in A-C are the means and ± SD of three independent experiments.
Figure 7.
Figure 7.
IL6 translation in GRSF1 KO cells is enhanced largely independently of mTOR. (A) WT and KO HEK293 cells were harvested and cytoplasmic extracts were sedimented by centrifugation through sucrose density gradients; global polysome profiles depict ribosomal subunits (40S, 60S), and monosomes (80S) as well as low- and high-molecular weight polysomes (LMWP, HMWP) (left). RNA was isolated from equal volumes of each fraction, and the presence of IL6 and ACTIN mRNAs was quantified by RT-qPCR analysis and represented as % of the total mRNA on the gradient (right). (B) Extracts were prepared and processed as in (A), but WT or KO cells were collected after either no treatment or treatment with Rapamycin (Rapa). (C) IL6 secreted by untreated and Rapamycin-treated KO and WT cells was quantified by AlphaLISA; data represent the means ± SD from three independent experiments. (D) Proposed model. Loss of GRSF1 impairs mitochondrial gene expression programs and mitochondrial function; the ensuing rise in ROS causes DNA damage and triggers a DNA damage response that includes activation of the transcription factor NF-κB and the transcriptional induction in IL6 mRNA levels. Translation of IL6 is selectively increased in a GRSF1-dependent manner, but this increase appears mTOR-independent.

References

    1. Glisovic T., Bachorik J.L., Yong J., Dreyfuss G.. RNA-binding proteins and post-transcriptional gene regulation. FEBS Lett. 2008; 582:1977–1986. - PMC - PubMed
    1. Dreyfuss G., Kim V.N., Kataoka N.. Messenger RNA binding proteins and the messages they carry. Nat. Rev. Mol. Cell Biol. 2002; 3:195–205. - PubMed
    1. Gerstberger S., Hafner M., Tuschl T.. A census of human RNA-binding proteins. Nat. Rev. Genet. 2014; 15:829–845. - PMC - PubMed
    1. Keene J.D. RNA regulons: coordination of posttranscriptional events. Nat. Rev. Genet. 2007; 8:533–543. - PubMed
    1. Moore M.J. From birth to death: the complex lives of eukaryotic mRNAs. Science. 2005; 309:1514–1518. - PubMed

Publication types

MeSH terms

LinkOut - more resources