Comparative Study
. 2019 May 1;36(5):955-965.
doi: 10.1093/molbev/msz023.

Signals of Variation in Human Mutation Rate at Multiple Levels of Sequence Context

Affiliations
Comparative Study

Signals of Variation in Human Mutation Rate at Multiple Levels of Sequence Context

Rachael C Aikens et al. Mol Biol Evol. .

Abstract

Our understanding of the human mutation rate helps us build evolutionary models and interpret patterns of genetic variation observed in human populations. Recent work indicates that the frequencies of specific polymorphism types have been elevated in Europe, and that many more, subtler signatures of global polymorphism variation may yet remain unidentified. Here, we present an analysis of the 1000 Genomes Project supported by analysis in the Simons Genome Diversity Panel, suggesting additional putative signatures of mutation rate variation across populations and the extent to which they are shaped by local sequence context. First, we compiled a list of the most significantly variable polymorphism types in a cross-continental statistical test. Clustering polymorphisms together, we observe three sets that showed distinct shared patterns of relative enrichment among ancestral populations, and we characterize each one of these putative "signatures" of polymorphism variation. For three of these signatures, we found that a single flanking base pair of sequence context was sufficient to determine the majority of enrichment or depletion of a polymorphism type. However, local genetic context up to 2-3 bp away contributes additional variability and may help to interpret a previously noted enrichment of certain polymorphism types in some East Asian groups. Moreover, considering broader local genetic context highlights patterns of polymorphism variation, which were not captured by previous approaches. Building our understanding of mutation rate in this way can help us to construct more accurate evolutionary models and better understand the mechanisms that underlie genetic change.

Keywords: mutation rate; sequence context models; statistical genetics.


Figures

<sc>Fig</sc>. 1.
Fig. 1.
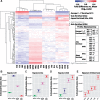
Signatures of mutation rate by trinucleotide context highlight variability across populations. (A) Heatmap of all 3-mer polymorphisms, clustered based on their relative rates in each of 20 nonadmixed 1000 Genomes Project populations. Clusters of interest are labeled, and their membership is detailed in the table to the right. Polymorphisms are clustered and colored based on fold elevation over the mean mutation rate for each mutation type. All units are log base 2 transformed, with red color corresponding to enrichment and blue to depletion. Population codes along the bottom correspond to the three-letter codes assigned in the 1000 Genomes data set. (BD) Approximate 95% confidence interval estimates of inferred mutation rate across continental groups in 1KG for signatures #1, #2a, and #2b. (E) Inferred mutation rates for signature #3 shown across five East Asian subpopulations: Chinese Dai in Xishuangbanna (CDX), Vietnamese (KHV), Han Chinese from Beijing and Southern China (CHB and CHS), and Japanese in Tokyo (JPT).
<sc>Fig</sc>. 2.
Fig. 2.
Mutational signatures driven at the 3-mer context level. Each point represents a 7-mer expansion of the 3-mer subtype shown, plotted based on its estimated mutation rate in 1KG within each of the two populations displayed. Colors indicate the log (base 10) of the number of polymorphisms observed for that 7-mer class. (A) When a 3-mer polymorphism type occurs at equal rates in two related populations, most of the 256 7-mer expansions of this 3-mer appear along the diagonal y = x line. (B) For TCC→T and the other C→T polymorphism types elevated in Europe, the bulk of the 7-mer expansions lie above the y = x diagonal, indicating that there has been a substantial difference in mutation rate between Europe and East Asia, and this difference is driven by effects at the 3-mer, rather than the 7-mer level.
<sc>Fig</sc>. 3.
Fig. 3.
Patterns of variation within in East Asia among 7-mers from signature #3. (A) Most 7-mer expansions of AAC→C are the same in Chinese Dai versus Japanese, with the exception of some highly variable 7-mer polymorphism types. Polymorphisms significantly heterogeneous between Japan and Chinese Dai are labeled. (B) Estimated private mutation rate of the fourteen 7-mer polymorphism types shown in table 2 displayed across each East Asian subpopulation from 1KG. Brackets indicate approximate 95% confidence intervals.
<sc>Fig</sc>. 4.
Fig. 4.
Two significantly variable 7-mer expansions of TAA→T. (A) Estimated private mutation rate of TTTAAAA→T across continental groups in 1KG, with approximate 95% confidence intervals shown. (B) TTTAAAA→T and ATTAAAA→T appear to be both more variable between continental groups and more common than other 7-mer expansions of TAA→T. These two polymorphism types are the only ones from the 256 TAA→T expansions that are significantly different (false discovery rate < 0.05) between Africa and Europe in 1KG.
<sc>Fig</sc>. 5.
Fig. 5.
Enrichment of polymorphisms across DAF bins. The enrichment of polymorphisms in a signature across DAF bins in 1KG, calculated as the proportion of mutations in a bin with a given polymorphism class, divided by the proportion of all polymorphism with that class. (A) Signature #1 in Europeans. (B) Signature #1 in South Asians.

References

    1. Aggarwala V, Voight BF.. 2016. An expanded sequence context model broadly explains variability in polymorphism levels across the human genome. Nat Genet. 48:349–355. - PMC - PubMed
    1. Auton A, Abecasis GR, Altshuler DM, Durbin RM, Abecasis GR, Bentley DR, Chakravarti A, Clark AG, Donnelly P, Eichler EE, et al. 2015. A global reference for human genetic variation. Nature 526:68–74. - PMC - PubMed
    1. Carlson J, Locke AE, Flickinger M, Zawistowski M, Levy S, Myers RM, Boehnke M, Kang HM, Scott LJ, Li JZ, et al. 2018. Extremely rare variants reveal patterns of germline mutation rate heterogeneity in humans. Nat Commun. 9(1): 3753. - PMC - PubMed
    1. Conrad DF, Keebler JEM, DePristo MA, Lindsay SJ, Zhang Y, Casals F, Idaghdour Y, Hartl CL, Torroja C, Garimella KV, et al. 2011. Variation in genome-wide mutation rates within and between human families. Nat Genet. 43(7): 712–714. - PMC - PubMed
    1. Danecek P, Auton A, Abecasis G, Albers CA, Banks E, DePristo MA, Handsaker RE, Lunter G, Marth GT, Sherry ST, et al. 2011. The variant call format and VCFtools. Bioinformatics 27(15): 2156–2158. - PMC - PubMed

Publication types