. 2019 Feb 11;35(2):315-328.e6.
doi: 10.1016/j.ccell.2019.01.005.

Aging-like Spontaneous Epigenetic Silencing Facilitates Wnt Activation, Stemness, and BrafV600E-Induced Tumorigenesis

Affiliations

Aging-like Spontaneous Epigenetic Silencing Facilitates Wnt Activation, Stemness, and BrafV600E-Induced Tumorigenesis

Yong Tao et al. Cancer Cell. .

Abstract

We addressed the precursor role of aging-like spontaneous promoter DNA hypermethylation in initiating tumorigenesis. Using mouse colon-derived organoids, we show that promoter hypermethylation spontaneously arises in cells mimicking the human aging-like phenotype. The silenced genes activate the Wnt pathway, causing a stem-like state and differentiation defects. These changes render aged organoids profoundly more sensitive than young ones to transformation by BrafV600E, producing the typical human proximal BRAFV600E-driven colon adenocarcinomas characterized by extensive, abnormal gene-promoter CpG-island methylation, or the methylator phenotype (CIMP). Conversely, CRISPR-mediated simultaneous inactivation of a panel of the silenced genes markedly sensitizes to BrafV600E-induced transformation. Our studies tightly link aging-like epigenetic abnormalities to intestinal cell fate changes and predisposition to oncogene-driven colon tumorigenesis.

Keywords: BRAF(V600E); CIMP; CpG-island DNA methylation; aging; cancer risk; colon adenocarcinomas; epigenetic silencing; transformation; tumor predisposition; tumorigenesis.


Figures

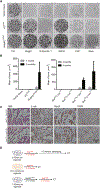
Figure 1.
Figure 1.. BrafV600E-Mutant Organoids Acquire Augmented Dysplastic Growth Phenotype
(A and B) Representative images of organoids at 2–3 months after activation of BrafV600E (BrafCA) or not (BrafEV) (A) and quantification of sphere formation (B). Boxplot shows the interquartile range. Points show observed values. Lower and upper boundaries of boxes represent the 25th and 75th percentile; cross bar represents median; whiskers show minimum and maximum values. (C and D) H&E (C) and phase-contrast (D) images of WT organoids; arrow shows crypt-like budding structure growing outward. (E and F) H&E (E) and phase-contrast (F) images of BrafCA organoids; arrows indicate inward-growing structures with dysplastic cells having high nucleus-to-cytosol ratio. (G and H) H&E (G) and phase-contrast (H) images of BrafCA-IND organoids; arrows indicate cells in the interior of the organoid growing as multilayers with augmented dysplastic features. See also Figure S1.
Figure 2.
Figure 2.. BrafV600E-Mutant Organoids Evolve and Acquire Autonomous Wnt Pathway Activation and Stem Cell Phenotype
(A) Schematic diagram of niche factor dependency assay with serial exclusion of growth factors and measurement of growth at each week for 3 weeks. (B) Heatmap showing relative growth capacity of organoids in different media compared with ENSW media at each week. BrafCA-IND1–3 were derived from corresponding BrafCA replicates upon continued culture(dotted arrow) in Base medium. Suffix “−2m” or “−5m” indicates organoids cultured normally in ENSW for 2 or 5 months, respectively, after BrafV600E induction. (c) Schematic of co-culture experiment. (D and E) tdTomato+ BrafCA-IND1 or 2 organoids were mixed with tdTomato BrafEV1 or 2 and grown in ENSW (E) or Base (B) medium for 1 week, followed by analysis by mutant-specific PCR (D) and fluorescence microscopy (E). In (D) the rec-BrafV600E and non-rec-Braf bands were monitored to detect the presence of BrafCA-IND1 or 2 and BrafEV1 or 2, respectively. (F) Heatmap represents relative growth rates of various organoids in medium containing only Noggin and R-Spondin 1 at each IWP-2 concentration in comparison with growth in the DMSO treatment. See also Figure S2.
Figure 3.
Figure 3.. Sustained Intestinal Stem Cell and Wnt Target Gene Activity in BrafV600E Organoids
(A) Schematic showing WT, BrafEV, BrafCA, and BrafCA-IND independently plated in two wells and grown in ENSW medium and Base medium for48 h, followed by genome-wide gene expression and flow cytometry analyses. (B) List of gene sets that are highly enriched in patterns 1 and 2. Pattern 1 genes are those up-regulated in ENSW medium and down-regulated in Base medium in WT/BrafEV, whereas pattern 2 genes have opposite expression changes. (C) Summary of fluorescence-activated cell sorting analysis of CD44+ stem cell population. Boxplot shows the interquartile range. Lower and upper boundaries of box represent the 25th and 75th percentile; cross bar represents median; whiskers extend to the most extreme data point no more than 1.5 times the interquartile range from box (Welch two-sample one-sided *p ≤ 0 .05; ns, not significant). See also Figure S3.
Figure 4.
Figure 4.. Transformed Phenotype Induced by BrafV600E Mimics Pathologic Features of Human Proximal COAD
(A) Plot showing xenograft tumor volume at 1 and 2 months after subcutaneous injection of the various organoids in NSG mice. Error bars indicate ±SD (n = 5 mice, two flanks each mouse). (B) A representative image showing that BrafCA-IND xenograft tumors are gelatinous with copious amounts of mucin (white arrowhead). (C) Representative image showing invasion of a BrafCA-IND1 tumor through the peritoneum and its growth (white arrowhead) in the kidney capsule. (D–G) Examples of histology of xenograft tumors showing that tumors consist of mucin (*)-filled cysts lined by piled-up dysplastic epithelial cells (arrow, D), occasional signet ring cells (arrow, E), multinucleation (arrow, F), and bizarre-looking mitotic figures (arrow, G). (H and I) Examples of histology of invasive tumors in subcutaneous space(red arrowhead, H)that have invaded through the peritoneal muscle layer and grown as tumor in the kidney capsule (black arrowhead, H) and the occasional presence of tumor cells between muscle layers (arrow, I). (J and K) Representative histology of human mucinous adenocarcinoma from the TCGA database (TCGA: AA-3877) showing mucin (*)-filled cysts lined by piled-up dysplastic cells (arrow, J) and occasional cells with a large vacuole (signet ring cell, arrow, K).
Figure 5.
Figure 5.. DNA Methylation Modifications Accrue during BrafV600E-Driven Transformation
(A) Bar plot showing numbers of genes identified as differentially methylated In BrafCA3 and BrafCA-IND3 compared with BrafEV3. Enrichment of Wnt-pathway genes in the genes hypermethylated in BrafCA-IND3 is indicated. (B) Representative CGI (red bars under gene structure) promoter methylation profiles of candidate genes (orange peaks indicate enrichment of reads indicating relative methylation levels). Curved arrows indicate transcription start sites and direction of gene transcription. In the Cdkn2a locus, p16Ink4a and p19Arf promoters are shown separately. (C) Heatmap showing validation of CIMP phenotype in the BrafCA-IND at key candidate genes by quantitative methylation-specific PCR (MSP) and bisulfite pyrosequencing. Organoids shown are those that were cultured for 5 months. See also Figures S4 and S5.
Figure 6.
Figure 6.. Long-Term-Cultured Organoids Accumulate CpG-Island DNA Methylation and Show Differentiation Defects
(A) DNA methylation accumulation determined by bisulfite pyrosequencing of selected CGI regions in BrafEV1 and 3 organoids cultured for 2 or 12–14 months and BrafCA-IND1–3 organoids cultured for 5 months. The suffix “m” in BrafEV1–12m and BrafEV3–14m indicates the duration in months for which the organoids were cultured. Whiskers indicate mean (cross bar) ± SD. (B) Representative images showing the growth of long-term-cultured (12–14 months) wild-type BrafEV organoids in medium deficient in indicated ligands, or in medium with all ligands (Full). Results are representative of two experiments performed in duplicate. (C) Quantitative real-time PCR analysis of markers and key cell fate regulators of colon epithelial cells between long-term-cultured (12or14 months) and young (2 months) wild-type BrafEV1 and 3 organoids. mRNA expression of long-term- relative to short-term-cultured organoids is shown. Error bars, ±SD (n = 3 wells). (D) Projection of confocal images showing enterocyte cell marker Krt20 (green) and proliferating cells (EdU, red) in BrafEV1 and 3 organoids cultured for the indicated lengths of time. DAPI (blue) is used as a nuclear stain. See also Figure S6.
Figure 7.
Figure 7.. Both Long-Term-Cultured Organoids and Young Organoids with CRISPR-Mediated Inactivation of Selected Genes Are Predisposed to Rapid Transformation by BrafV600E
(A) Representative images showing the growth of young (2 months) organoids (BrafEV3–2m) with CRISPR-mediated knockout of Cdx2 alone (KOCdx2) or in combination with Sfrp4, Sox17, and Cdkn2a (MultiKOC2SSP) after 7 days of culture in medium deficient in indicated ligands, or in medium with all ligands (Full) or none of the ligands (Base). Results are representative of two different experiments performed in duplicate. (B) Analysis of xenograft tumor growth by measuring tumor volume (y axis) of xenograft tumors from CRISPR-edited young organoids (BrafEV3–2m, left) and young (2 months) and old (12–14 months) organoids (right), after BrafV600E activation. Tumor volumes were measured at 1 and 2 months after subcutaneous injection. Error bars indicate ±SD (n = 5 mice, two flanks each mouse). (C) H&E and immunohistochemistry (brown) staining of tumors derived from long-term-cultured organoids with BrafV600E with antibodies staining for β-catenin (β-cat), mucin 2 (Muc2), and cytokeratin 20 (Krt20). (D) Summary of observations from three models exploring permissive role of epigenetically silenced genes in BrafV600E-induced transformation. See also Figure S7.

Comment in

  • The Origin of CIMP, At Last.
    Ushijima T, Suzuki H. Ushijima T, et al. Cancer Cell. 2019 Feb 11;35(2):165-167. doi: 10.1016/j.ccell.2019.01.015. Cancer Cell. 2019. PMID: 30753821

References

    1. Ahuja N, Li Q, Mohan AL, Baylin SB, and Issa JP (1998). Aging and DNA methylation in colorectal mucosa and cancer. Cancer Res. 58, 5489–5494. - PubMed
    1. Akalin A, Franke V, Vlahovicek K, Mason CE, and Schubeler D (2015). Genomation: a toolkit to summarize, annotate and visualize genomic intervals. Bioinformatics 31, 1127–1129. - PubMed
    1. Akalin A, Kormaksson M, Li S, Garrett-Bakelman FE, Figueroa ME, Melnick A, and Mason CE (2012). methylKit: a comprehensive R package for the analysis of genome-wide DNA methylation profiles. Genome Biol. 13, R87. - PMC - PubMed
    1. Asada K, Nakajima T, Shimazu T, Yamamichi N, Maekita T, Yokoi C, Oda I, Ando T, Yoshida T, Nanjo S, et al. (2015). Demonstration of the usefulness of epigenetic cancer risk prediction by a multicentre prospective cohort study. Gut 64, 388–396. - PMC - PubMed
    1. Baba Y, Nosho K, Shima K, Freed E, Irahara N, Philips J, Meyerhardt JA, Hornick JL, Shivdasani RA, Fuchs CS, et al. (2009). Relationship of CDX2 loss with molecular features and prognosis in colorectal cancer. Clin. Cancer Res. 15, 4665–4673. - PMC - PubMed

Publication types

MeSH terms