

Spatiotemporal Prediction of Increasing Winter Perceived Temperature across a Sub-Tropical City for Sustainable Planning and Climate Change Mitigation
- PMID: 30754664
- PMCID: PMC6388248
- DOI: 10.3390/ijerph16030497
Spatiotemporal Prediction of Increasing Winter Perceived Temperature across a Sub-Tropical City for Sustainable Planning and Climate Change Mitigation
Abstract
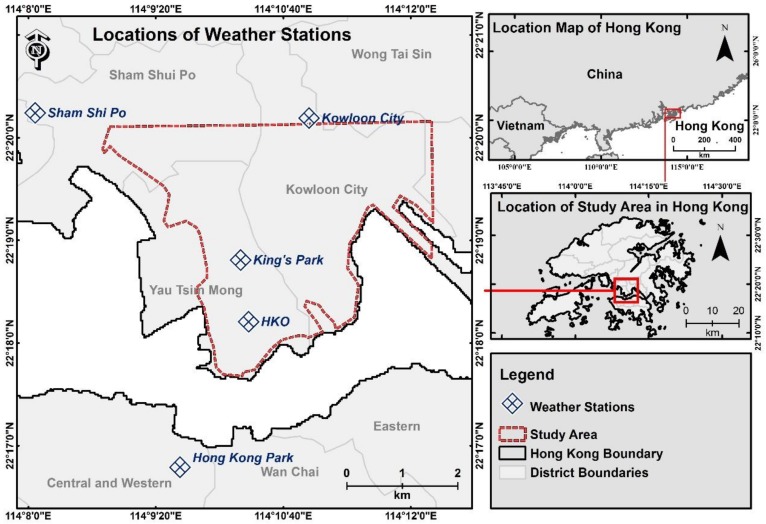
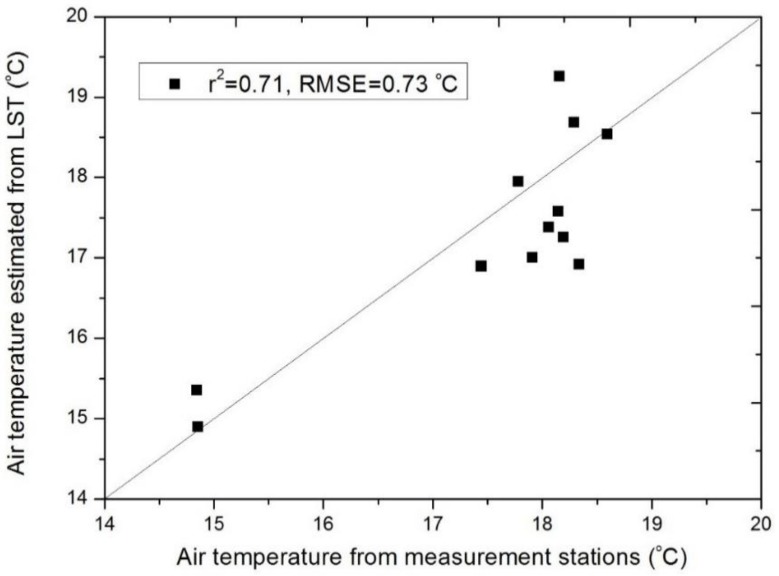
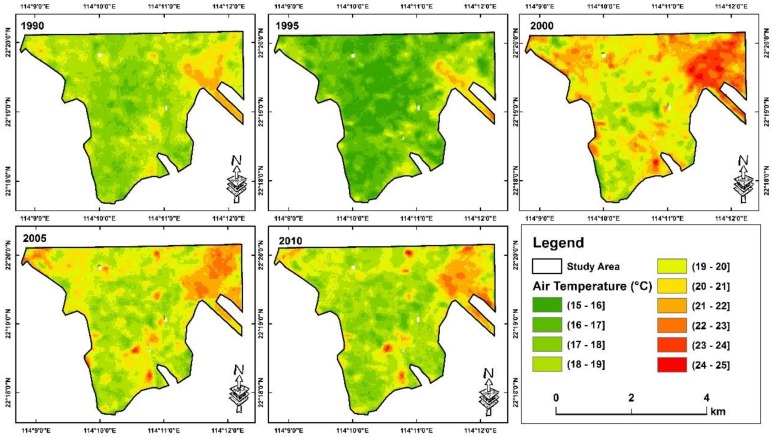
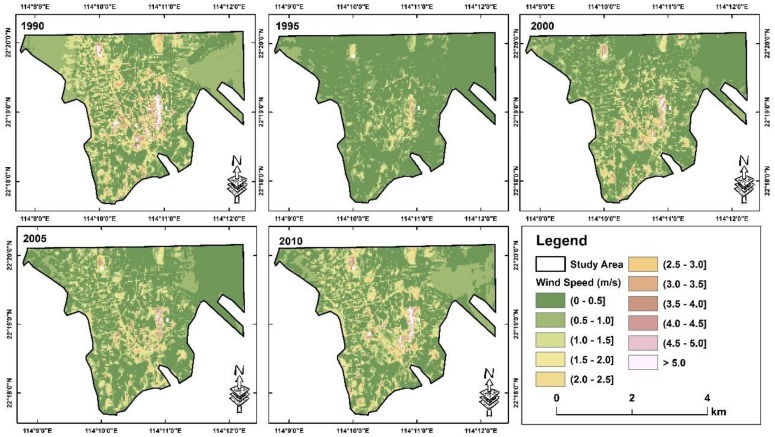
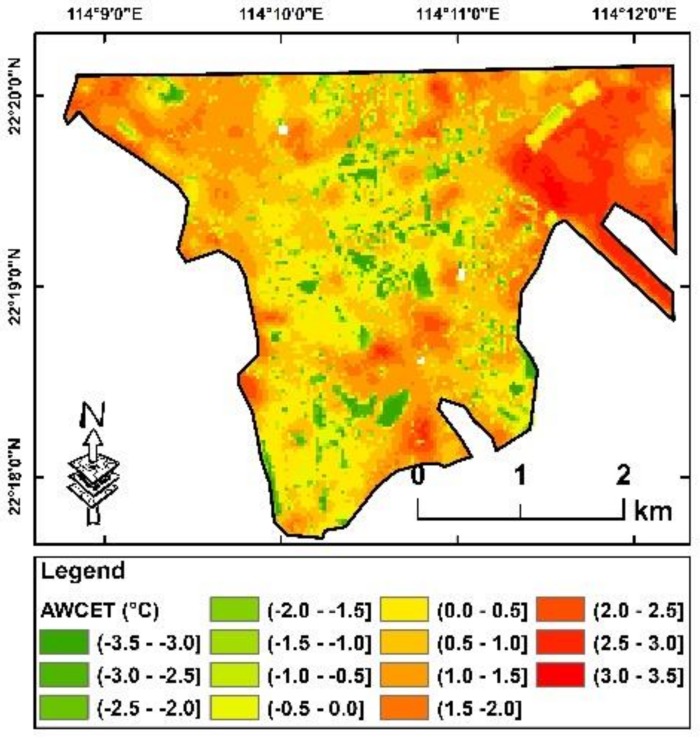
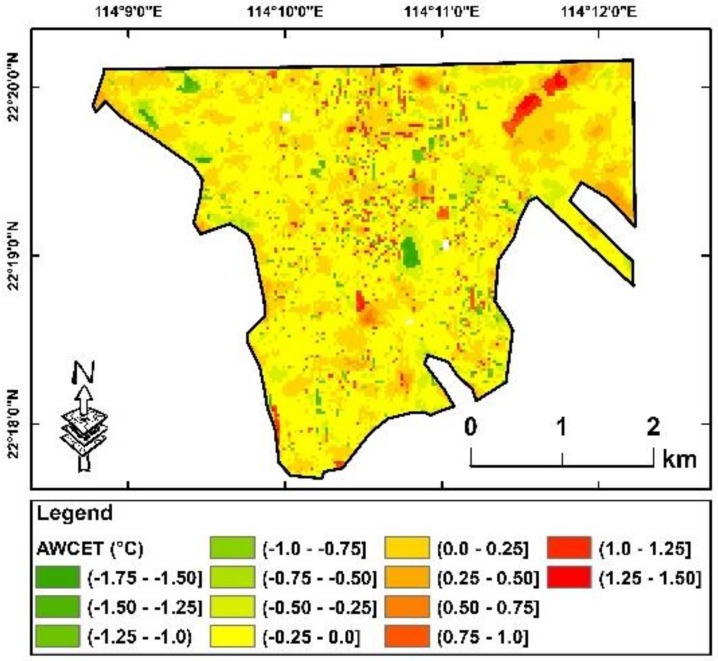
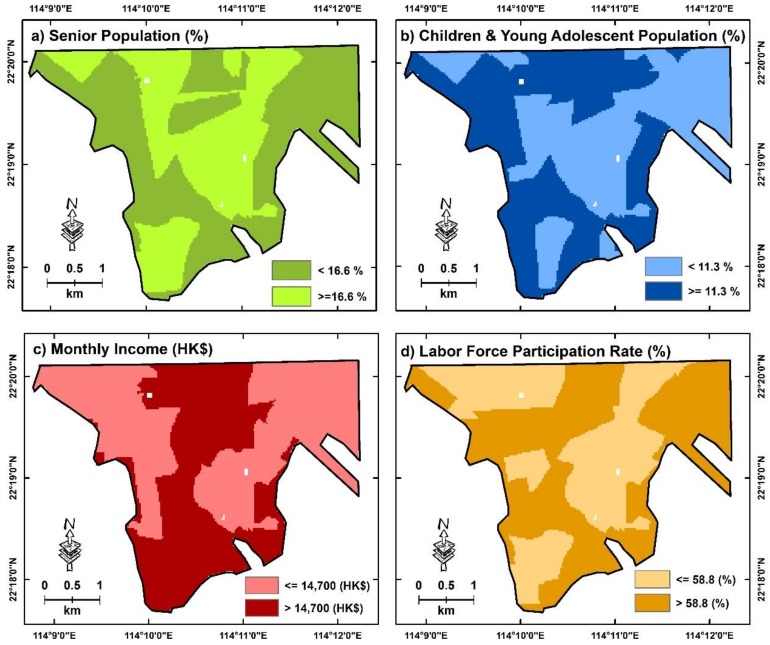
Climate variability has been documented as being key to influencing human wellbeing across cities as it is linked to mortality and illness due to changes in the perceived weather cycle. Many studies have investigated the impact of summer temperature on human health and have proposed mitigation strategies for summer heat waves. However, sub-tropical cities are still experiencing winter temperature variations. Increasing winter perceived temperature through the decades may soon affect city wellbeing, due to a larger temperature change between normal winter days and extreme cold events, which may cause higher health risk due to lack of adaptation and self-preparedness. Therefore, winter perceived temperature should also be considered and integrated in urban sustainable planning. This study has integrated the increasing winter perceived temperature as a factor for developing spatiotemporal protocols for mitigating the adverse impact of climate change. Land surface temperature (LST) derived from satellite images and building data extracted from aerial photographs were used to simulate the adjusted wind chill equivalent temperature (AWCET) particularly for sub-tropical scenarios between 1990 and 2010 of the Kowloon Peninsula, Hong Kong. Compared with perceived temperature based on the representative station located at the headquarters of the Hong Kong Observatory, the temperature of half the study area in the Kowloon Peninsula has raised by 1.5 °C. The areas with less green space and less public open space in 2010 show higher relative temperatures. Socioeconomically deprived areas (e.g., areas with lower median monthly income) may suffer more from this scenario, but not all types of socioeconomic disparities are associated with poor sustainable planning. Based on our results and the "no-one left behind" guideline from the United Nations, climate change mitigation should be conducted by targeting socioeconomic neighborhoods more than just aging communities.
Keywords: climate change; community design; socioeconomic deprivation; sustainable planning; urban morphology.
Conflict of interest statement
The authors declare that they have no competing interests.
Figures
Similar articles
-
Development of the Adjusted Wind Chill Equivalent Temperature (AWCET) for cold mortality assessment across a subtropical city: validation and comparison with a spatially-controlled time-stratified approach.BMC Public Health. 2019 Oct 15;19(1):1290. doi: 10.1186/s12889-019-7612-5. BMC Public Health. 2019. PMID: 31615481 Free PMC article.
-
Quantitative Study of Using Piloti for Passive Climate Adaptability in a Hot-Summer and Cold-Winter City in China.Int J Environ Res Public Health. 2018 Oct 9;15(10):2202. doi: 10.3390/ijerph15102202. Int J Environ Res Public Health. 2018. PMID: 30304857 Free PMC article.
-
Urban environmental influences on the temperature-mortality relationship associated mental disorders and cardiorespiratory diseases during normal summer days in a subtropical city.Environ Sci Pollut Res Int. 2019 Aug;26(23):24272-24285. doi: 10.1007/s11356-019-05594-0. Epub 2019 Jun 22. Environ Sci Pollut Res Int. 2019. PMID: 31230236
-
Climate change and temperature extremes: A review of heat- and cold-related morbidity and mortality concerns of municipalities.Maturitas. 2018 Aug;114:54-59. doi: 10.1016/j.maturitas.2018.06.002. Epub 2018 Jun 4. Maturitas. 2018. PMID: 29907247 Free PMC article. Review.
-
The potential impacts of climate variability and change on temperature-related morbidity and mortality in the United States.Environ Health Perspect. 2001 May;109 Suppl 2(Suppl 2):185-9. doi: 10.1289/ehp.109-1240665. Environ Health Perspect. 2001. PMID: 11359685 Free PMC article. Review.
Cited by
-
Estimation of surface thermal emissivity in a vineyard for UAV microbolometer thermal cameras using NASA HyTES hyperspectral thermal, Landsat and AggieAir optical data.Proc SPIE Int Soc Opt Eng. 2019;11008:10.1117/12.2518958. doi: 10.1117/12.2518958. Epub 2019 May 14. Proc SPIE Int Soc Opt Eng. 2019. PMID: 31359903 Free PMC article.
-
The associations between social, built and geophysical environment and age-specific dementia mortality among older adults in a high-density Asian city.Int J Health Geogr. 2020 Dec 4;19(1):53. doi: 10.1186/s12942-020-00252-y. Int J Health Geogr. 2020. PMID: 33276778 Free PMC article.
-
Development of the Adjusted Wind Chill Equivalent Temperature (AWCET) for cold mortality assessment across a subtropical city: validation and comparison with a spatially-controlled time-stratified approach.BMC Public Health. 2019 Oct 15;19(1):1290. doi: 10.1186/s12889-019-7612-5. BMC Public Health. 2019. PMID: 31615481 Free PMC article.
References
-
- Lafortezza R., Carrus G., Sanesi G., Davies C. Benefits and well-being perceived by people visiting green spaces in periods of heat stress. Urban For. Urban Green. 2009;8:97–108.
-
- Thorsson S., Lindberg F., Björklund J., Holmer B., Rayner D. Potential changes in outdoor thermal comfort conditions in Gothenburg, Sweden due to climate change: the influence of urban geometry. Int. J. Climatol. 2010;31:324–335. doi: 10.1002/joc.2231. - DOI
-
- Grigorieva E.A., de Freitas C.R. A comparison and appraisal of a comprehensive range of human thermal climate indices. Int. J. Biometeorol. 2016;61:487–512. - PubMed
Publication types
MeSH terms
LinkOut - more resources
Full Text Sources
Medical
