. 2019 Feb 11;16(3):505.
doi: 10.3390/ijerph16030505.

Removal of Paracetamol Using Effective Advanced Oxidation Processes

Affiliations

Removal of Paracetamol Using Effective Advanced Oxidation Processes

Francesca Audino et al. Int J Environ Res Public Health. .

Abstract

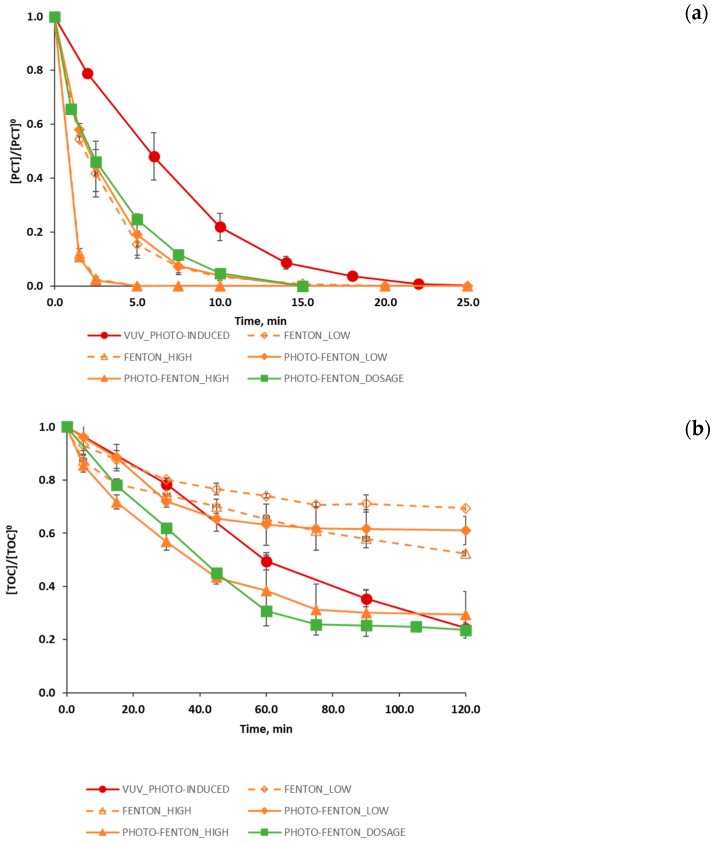
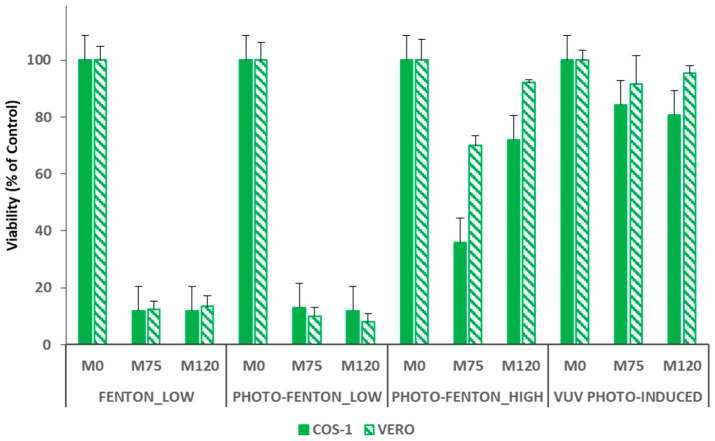
Fenton, photo-Fenton, and photo-induced oxidation, were investigated and compared for the treatment of 0.26 mmol L-1 of paracetamol (PCT) in a deionised water matrix, during a reaction span of 120.0 min. Low and high Fenton reagent loads were studied. Particularly, the initial concentration of Fe2+ was varied between 0.09 and 0.18 mmol L-1 while the initial concentration of H₂O₂ was varied between 2.78 and 11.12 mmol L-1. The quantitative performance of these treatments was evaluated by: (i) measuring PCT concentration; (ii) measuring and modelling TOC conversion, as a means characterizing sample mineralization; and (iii) measuring cytotoxicity to assess the safe application of each treatment. In all cases, organic matter mineralization was always partial, but PCT concentration fell below the detection limit within 2.5 and 20.0 min. The adopted semi-empirical model revealed that photo induced oxidation is the only treatment attaining total organic matter mineralization ( ξ MAX = 100% in 200.0 min) at the expense of the lowest kinetic constant (k = 0.007 min-1). Conversely, photo-Fenton treatment using high Fenton reagent loads gave a compromise solution ( ξ MAX = 73% and k = 0.032 min-1). Finally, cytotoxicity assays proved the safe application of photo-induced oxidation and of photo-Fenton treatments using high concentrations of Fenton reagents.

Keywords: Fenton; by-products; cytotoxicity; hydrogen peroxide dosage; kinetic model; paracetamol; photo-Fenton; photo-induced oxidation.


Conflict of interest statement

The authors declare no conflict of interest.

Figures

Figure 1
Figure 1
Evolution of the measured concentration of Fe2+ (◊,♦) and total iron (□,■) represented by a continuous line and of the calculated concentration of Fe3+ (∆,▲), represented by a dashed line, during (a) Fenton (empty symbols) and (b) photo-Fenton (solid symbols ) experiments performed with high concentrations of the Fenton reagents.
Figure 2
Figure 2
Evolution of the degradation of (a) PCT (normalized values), (b) TOC (normalized values) and (c) H2O2 (concentration, mmol L−1) for different process: photo induced advanced oxidation (●); Fenton, using low and high concentrations of Fenton reagents (◊,∆); photo-Fenton using low and high concentrations of Fenton reagents (♦,▲); and photo-Fenton process following a H2O2 dosage strategy (■). Figure 2c also shows the profile of the added hydrogen peroxide during the reaction span (concentration values, mmol L−1). The error bars display the standard deviation for the set of three experiments.
Figure 2
Figure 2
Evolution of the degradation of (a) PCT (normalized values), (b) TOC (normalized values) and (c) H2O2 (concentration, mmol L−1) for different process: photo induced advanced oxidation (●); Fenton, using low and high concentrations of Fenton reagents (◊,∆); photo-Fenton using low and high concentrations of Fenton reagents (♦,▲); and photo-Fenton process following a H2O2 dosage strategy (■). Figure 2c also shows the profile of the added hydrogen peroxide during the reaction span (concentration values, mmol L−1). The error bars display the standard deviation for the set of three experiments.
Figure 3
Figure 3
Reaction rate as a function of the maximum attainable conversion evaluated for photo induced advanced oxidation process (●); Fenton (◊) and photo-Fenton (♦) process without H2O2 dosage using low concentrations of the Fenton reagents; Fenton (∆) and photo-Fenton (▲) process without H2O2 dosage using high concentrations of the Fenton reagents; and photo-Fenton process following a H2O2 dosage strategy (■).
Figure 4
Figure 4
Evolution (HPLC AREA) of the degradation intermediate BZQ (○) during photo induced oxidation process (line and dots), photo-Fenton process using high (dotted line) and low (dashed line) concentrations of the Fenton reactants and without dosing the hydrogen peroxide, and photo-Fenton process following a H2O2 dosage strategy (solid line).
Figure 5
Figure 5
Results of the cytotoxicity assays performed using COS-1 (full symbols) and VERO (slashed symbols) and tested on samples taken after 0 (M0), 75 (M75) and 120 (M120) minutes of reaction.

References

    1. Daughton C.G., Ternes T.A. Pharmaceuticals and personal care products in the environment: Agents of subtle change? Environ. Health Perspec. 1999;107:907–938. doi: 10.1289/ehp.99107s6907. - DOI - PMC - PubMed
    1. Heberer T., Reddersen K., Mechlinski A. From municipal sewage to drinking water: Fate and removal of pharmaceutical residues in the aquatic environment in urban areas. Water Sci. Technol. 2002;46:81–88. doi: 10.2166/wst.2002.0060. - DOI - PubMed
    1. Jones O.A.H., Green P.G., Voulvoulis N., Lester J.N. Questioning the excessive use of advanced treatment to remove organic micropollutants from wastewater. Environ. Sci. Technol. 2007;41:5085–5089. doi: 10.1021/es0628248. - DOI - PubMed
    1. Joss A., Keller E., Alder A.C., Gobel A., McArdell C.S., Ternes T., Siegrist H. Removal of pharmaceuticals and fragrances in biological wastewater treatment. Water Res. 2005;39:3139–3152. doi: 10.1016/j.watres.2005.05.031. - DOI - PubMed
    1. Ternes T.A. Occurrence of drugs in German sewage treatment plants and rivers. Water Res. 1998;32:3245–3260. doi: 10.1016/S0043-1354(98)00099-2. - DOI

Publication types