. 2019 Feb;18(4):476-499.
doi: 10.1080/15384101.2019.1578133. Epub 2019 Feb 12.

Comparison of HepaRG cells following growth in proliferative and differentiated culture conditions reveals distinct bioenergetic profiles

Affiliations

Comparison of HepaRG cells following growth in proliferative and differentiated culture conditions reveals distinct bioenergetic profiles

Carolyn K J Young et al. Cell Cycle. 2019 Feb.

Abstract

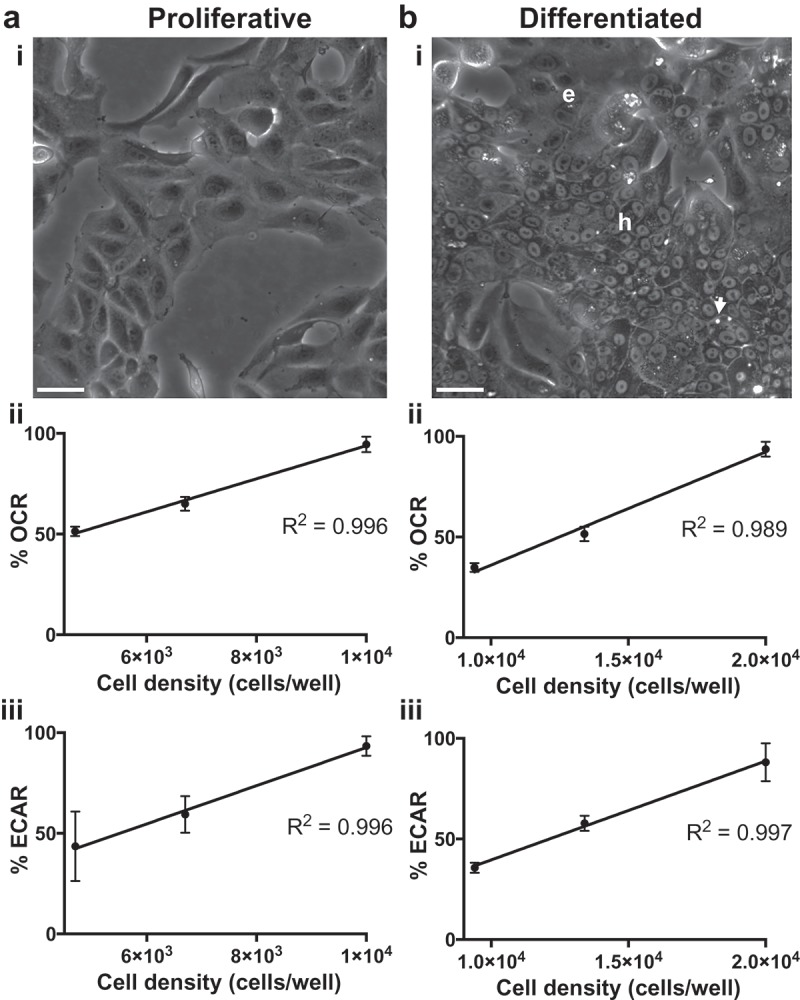
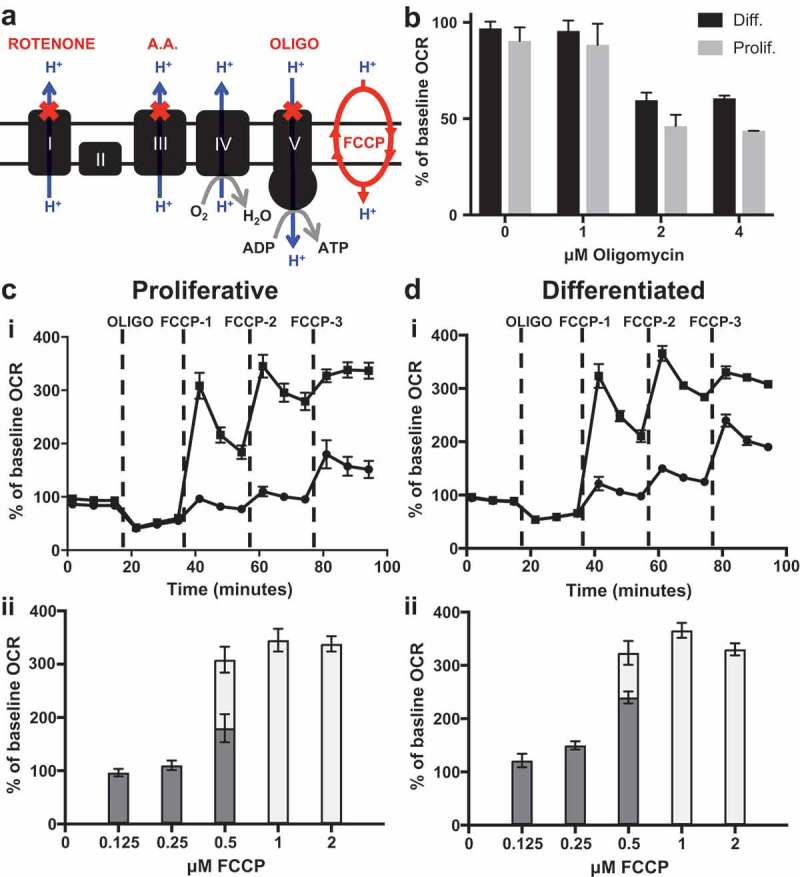
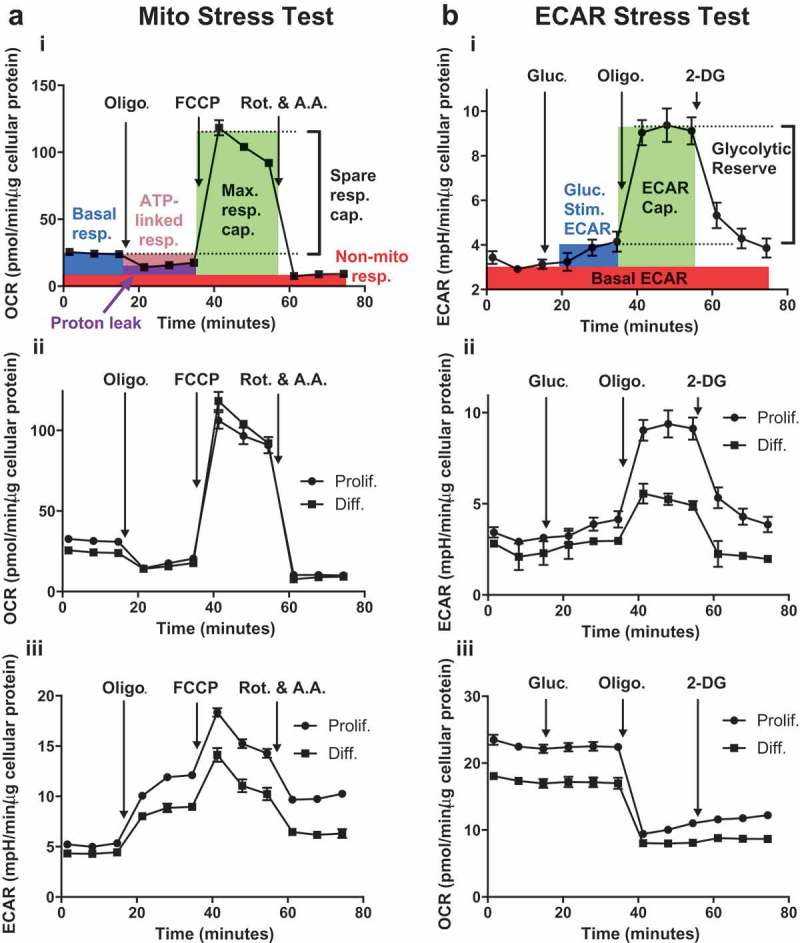
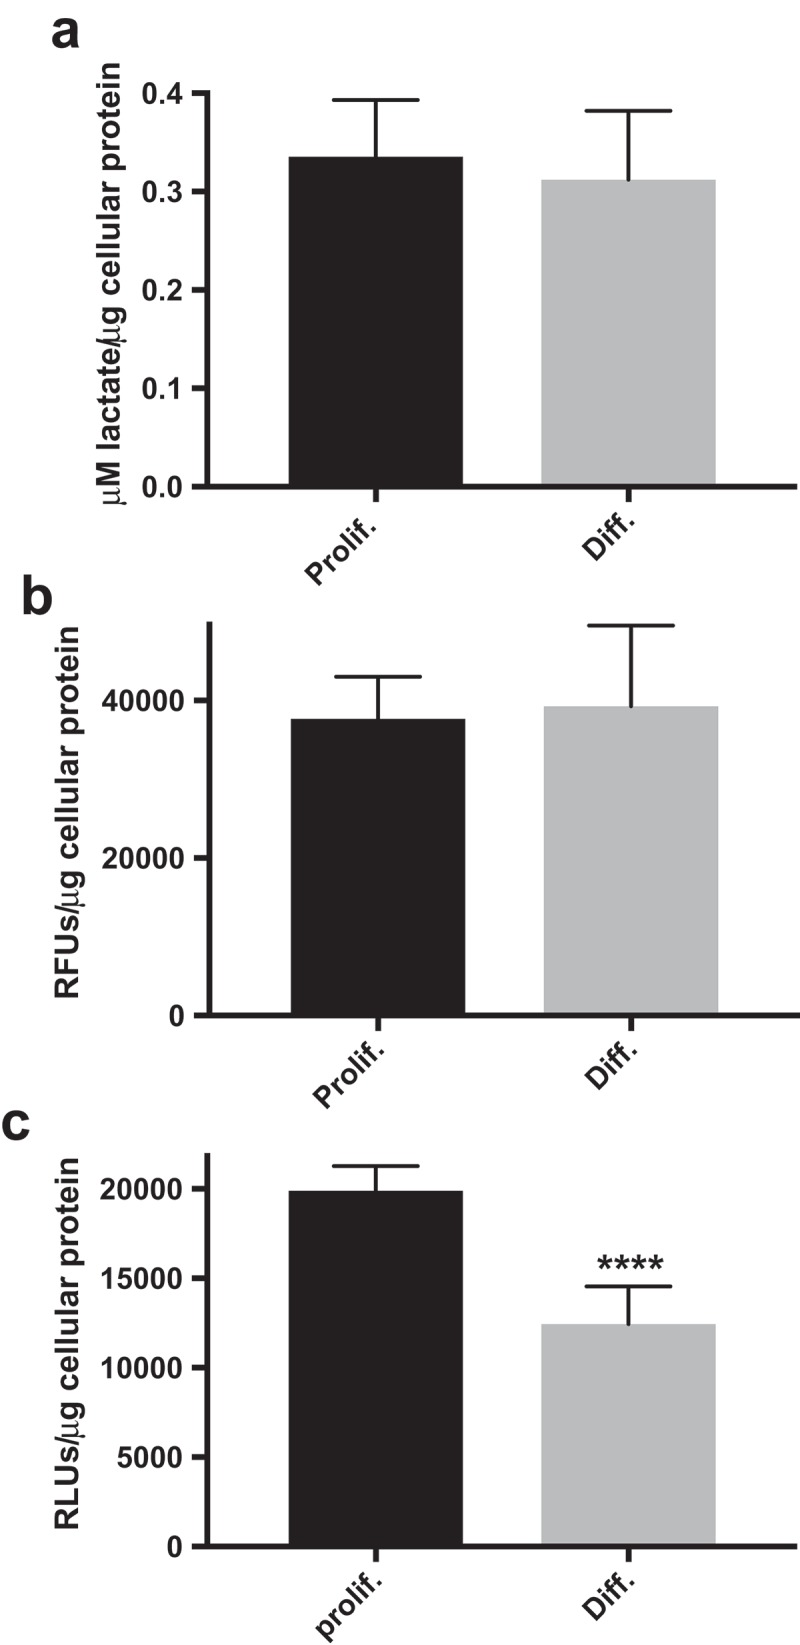
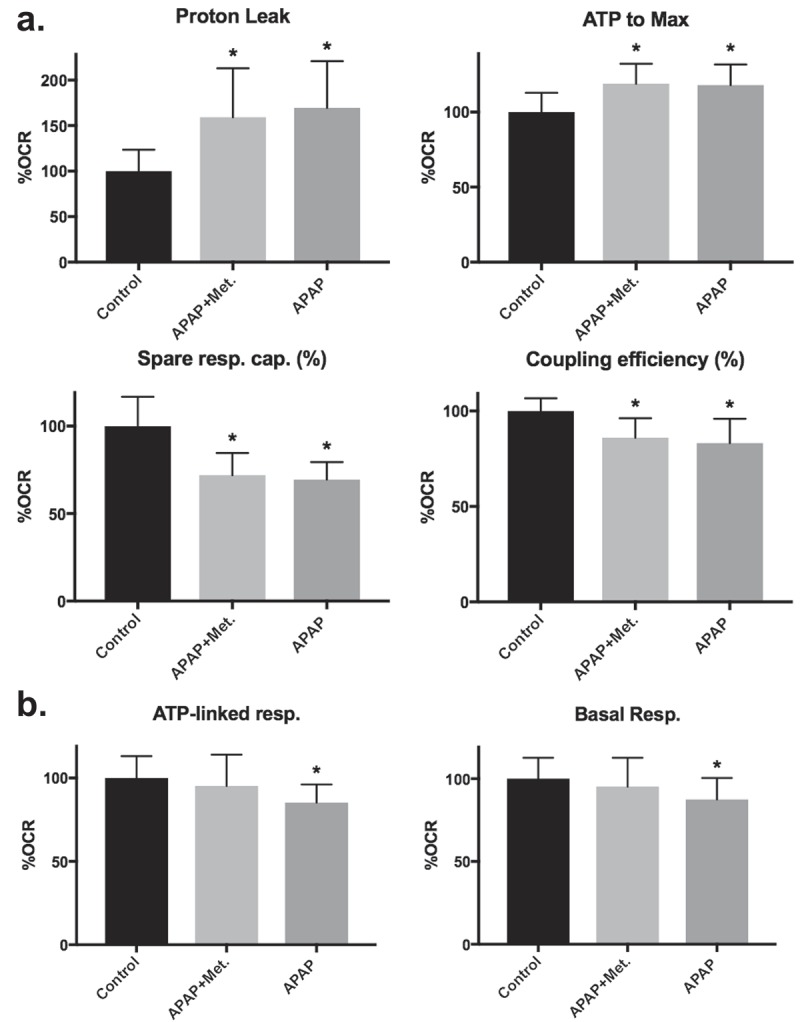
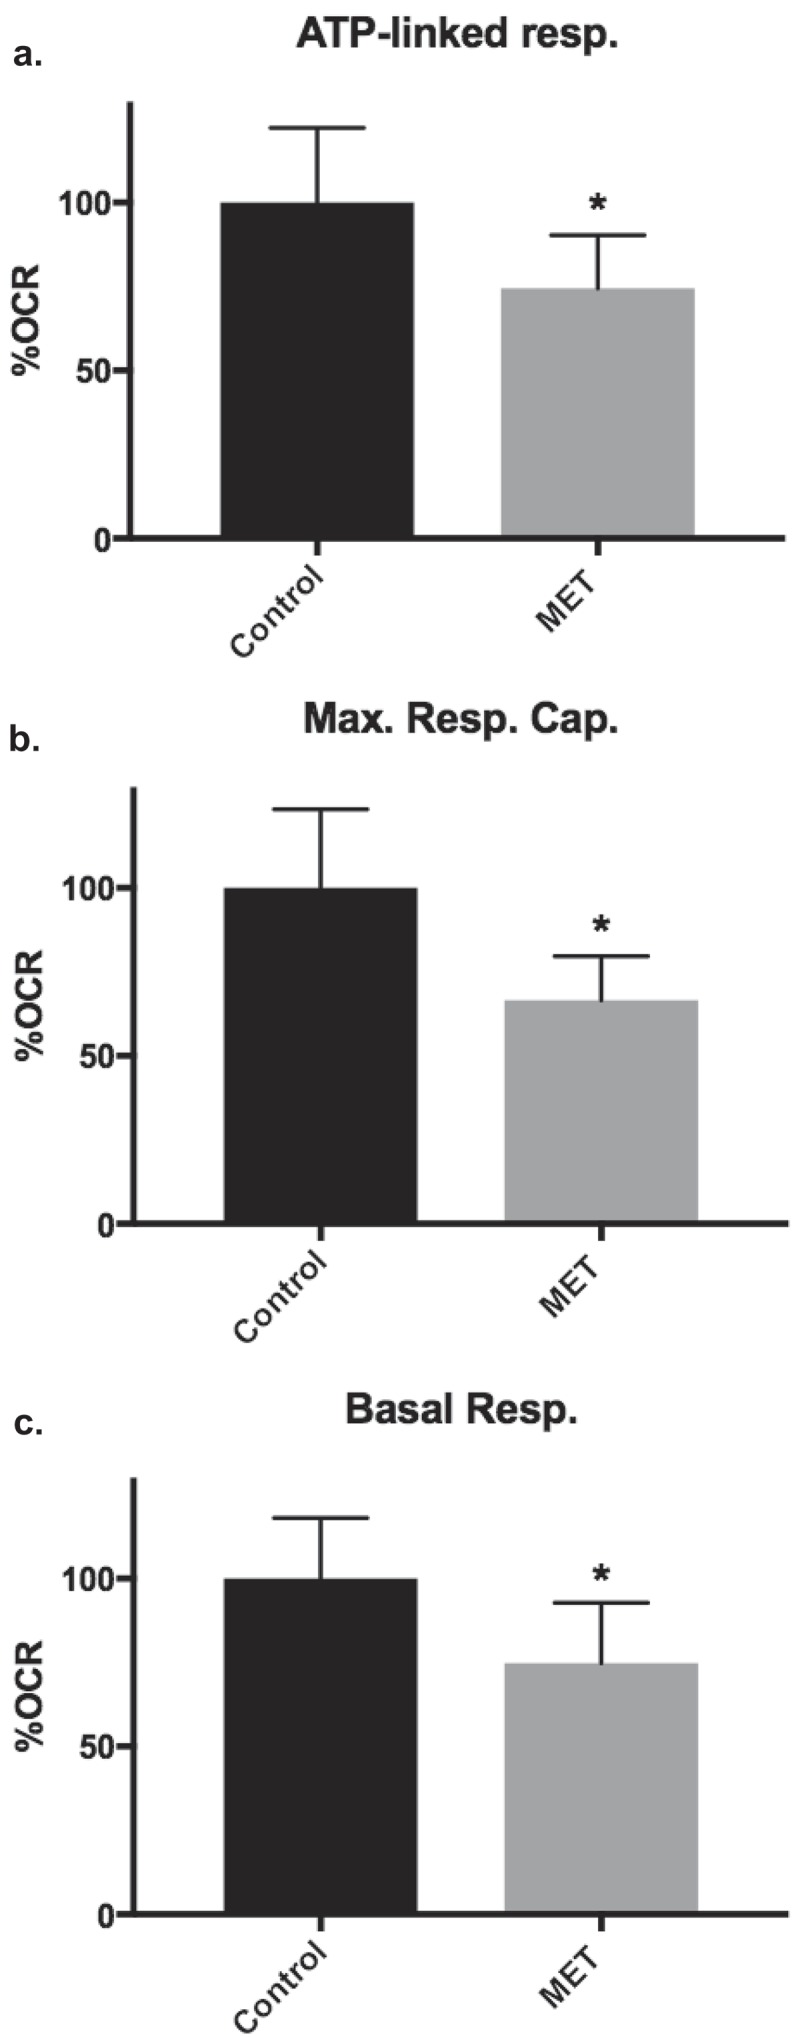
HepaRG is a proliferative human hepatoma-derived cell line that can be differentiated into hepatocyte-like and biliary-like cells. Differentiated HepaRG cultures maintain key hepatic functions including drug transporters and xenobiotic-metabolizing enzymes. To gain insight into proliferative and differentiated HepaRG metabolism we profiled various bioenergetic parameters and investigated cell culture levels of adenosine triphosphate (ATP), lactate, and lactate dehydrogenase (LDH) activity. Compared to differentiated-derived HepaRG, cells from proliferative cultures had increased basal and ATP-linked respiration and decreased maximal and spare respiratory capacities. Basal ATP levels but not lactate or LDH activity were increased in samples from proliferative-derived compared to differentiated-derived HepaRG. Further extracellular acidification rate (ECAR) experiments revealed parameters associated with glycolysis and oxidative phosphorylation. Under basal conditions, cells derived from both cultures had similar ECARs; however, under stressed conditions, proliferative-derived HepaRG had increases in ECAR capacity and apparent glycolytic reserve. The biguanide metformin has been reported to protect differentiated HepaRG against acetaminophen (APAP)-induced cell injury, as well as offer protection against bioenergetic deficiencies; therefore, we studied the outcome of exposure to these drugs in both culture conditions. Proliferative- and differentiated-derived cells were found to have distinct mitochondrial bioenergetic alterations when exposed to the hepatotoxic drug APAP. Metformin offered protection against loss of APAP-induced cellular viability and prevented APAP-induced decreases in bioenergetics in differentiated- but not proliferative-derived HepaRG. Distinguishingly, treatment with metformin alone reduced ATP-linked respiration, maximal respiratory capacity, and basal respiration in proliferative-derived HepaRG. Our results support that HepaRG represents an appropriate model to study drug-induced bioenergetic dysfunction.

Keywords: Extracellular flux analysis and bioenergetics; pharmacological stressors; proliferative and differentiated HepaRG.


Figures

Figure 1.
Figure 1.
HepaRG morphology and optimization of cell seeding density for XFp analysis. (a) i. Proliferative & (b) i. Differentiated HepaRG cell cultures. Hepatocyte-like and epithelial-like cells are indicated by “h” and “e” respectively. The arrow emphasizes a bile canaliculus-like structure. Scale bars, 40 μm. Various densities of viable cells per well were seeded into miniplate wells to determine basal oxygen consumption rates (OCRs) for (a) ii. Proliferative-derived and (b) ii. Differentiated-derived cells and basal extracellular acidification rates (ECARs) for (a) iii. Proliferative-derived and (b) iii. Differentiated-derived cells. Data are presented as mean ± SD, n = 4 (duplicates from two miniplates). R-squared values were ~0.99 as determined by linear regression analysis.
Figure 2.
Figure 2.
HepaRG cells are sensitive to OXPHOS metabolic stressors. (a) Cartoon of the mitochondrial inner membrane OXPHOS machinery targeted by key stressors of the Agilent Seahorse XFp Cell Mito Stress Test. (b) Optimization of the oligomycin concentration required to inhibit cellular OCRs. Data are presented as mean ± SD, n = 4 (duplicates from two miniplates). (c) & (d) FCCP dose-response tests to stimulate oxygen consumption are shown for (c) proliferative-derived and (d) differentiated-derived HepaRG. The three sequential injections of FCCP are represented by FCCP-1, −2, and −3 (c) & (d) i. OCR responses to low range FCCP concentrations are represented by black circles (i) and dark grey bars (ii) while responses to high range FCCP concentrations are represented by black squares (i) and light grey bars (ii). Mean % of baseline OCR values measured immediately post FCCP injections are graphed in (c) & (d) ii to emphasize stimulation of oxygen consumption. Data in (c) & (d) are presented as mean ± SD, n = 6 (triplicate from two miniplates). For several data points, error bars are not shown as the error bars are shorter than the height of the symbol. A.A., antimycin A; OLIGO, oligomycin.
Figure 3.
Figure 3.
HepaRG cells derived from proliferative and differentiated cultures have distinctive bioenergetic parameters. (a) Results from a representative Mito Stress test comparing proliferative- (Prolif.) and differentiated- (Diff.) derived HepaRG side-by-side on a cell culture miniplate. i. Description of mitochondrial bioenergetic parameters: basal respiration (Basal resp.), ATP-linked respiration (ATP-linked resp.), maximal respiratory capacity (Max. resp. cap.), spare respiratory capacity (Spare resp. cap.), proton leak, and non-mitochondrial respiration (Non-mito resp.). Metabolic stressors are injected sequentially from Ports A (2 μM oligomycin final well concentration), B (1 μM FCCP final well concentration), and C (0.5 μM antimycin A + 0.5 μM rotenone, final well concentrations). ii. OCR and iii. ECAR results for both cell types. (b) Results from a representative ECAR Stress test comparing Prolif. and Diff.-derived HepaRG side-by-side on a cell culture miniplate. i. Description of ECAR bioenergetic parameters: basal ECAR, Glucose-stimulated ECAR (Gluc.-Stim.), ECAR capacity (ECAR Cap.), and apparent glycolytic reserve (Glycolytic Reserve). First, final well concentrations of 10 mM glucose were injected from A ports, followed by 2 μM oligomycin (B ports), and ~51 mM 2-DG (C ports). ii. ECAR and iii. OCR results for both cell types. Data are presented as mean ± SD, n = 3. For several data points errors are not shown as the error bars are shorter than the height of the symbol. Oligo., oligomycin; Rot., rotenone; A.A., antimycin A; Gluc., glucose; 2-DG, 2-deoxyglucose.
Figure 4.
Figure 4.
Proliferative-derived HepaRG cell cultures have increased ATP levels. Quantitation of cell culture (a) lactate, (b) LDH activity, and (c) ATP levels in proliferative (Prolif.)- and differentiated (Diff.)-derived HepaRG. Lactate, LDH activity, and ATP levels were determined with Lactate-Glow,TM CytoTox-ONE,TM and CellTiter-Glo® 2.0 assays respectively (****, P < 0.0001). Data are presented as mean ± SD, n ≥ 24 (≥12 from two independent experiments performed on different days with different preparations of cells).
Figure 5.
Figure 5.
Metformin treatment of differentiated HepaRG blocks APAP-induced loss of cellular viability. Cells were treated with 20 mM APAP and 1 mM metformin (MET) was added 6 hours later. Cells were harvested 24 hours after the addition of APAP and cellular viability was determined by the trypan blue exclusion method. (a) Proliferative HepaRG cells are sensitive to APAP-induced loss of cellular viability in the absence or presence of MET (****, P < 0.0001 compared with control; $$$$, P < 0.0001 compared with MET). (b) Differentiated HepaRG cells are sensitive to APAP-induced loss of cellular viability. In the presence of MET the APAP-induced loss of viability is prevented (*, P < 0.05 compared with control; $, P < 0.05 compared with MET; #, P < 0.05 compared with APAP + MET). In (a) and (b) the number of viable cells treated with vehicle (control) was set to 100%. Data are presented as mean ± SD, n ≥ 8 (≥quadruplicate from two independent experiments performed on different days with different preparations of cells) relative to control.
Figure 6.
Figure 6.
Metformin treatment prevents APAP-induced alterations in differentiated-derived HepaRG mitochondrial bioenergetics but not in proliferative-derived cultures. (a) Proliferative-derived HepaRG were separately treated with media containing vehicle control, 20 mM APAP + 1 mM metformin, and 20 mM APAP then seeded into miniplate wells for comparative analysis of bioenergetic parameters. For each experiment, two consecutive Mito Stress tests were run. Data are presented as mean ± SD, n ≥ 7 (triplicate or quadruplicate from two independent experiments using different preparations of cells) relative to vehicle control (set to 100% OCR). (b) Differentiated-derived cells were treated with drugs and seeded into miniplate wells as described in (a). For each experiment, at least two consecutive Mito Stress tests were run. Data are presented as mean ± SD, n ≥ 14 (≥triplicate from three independent experiments using different preparations of cells) relative to vehicle control (set to 100% OCR); *, P < 0.05 compared with control.
Figure 7.
Figure 7.
Metformin reduced proliferative-derived HepaRG mitochondrial bioenergetics. Proliferative-derived cells were separately treated with media containing vehicle control or 1 mM metformin then seeded into miniplate wells and Mito Stress tests were run. (a) ATP-linked respiration (ATP-linked resp.), (b) maximal respiratory capacity (Max. Resp. Cap.), and (c) basal respiration (Basal Resp.). Data are presented as mean ± SD, n = 7 (triplicate and quadruplicate from two independent experiments using different preparations of cells) relative to vehicle control (set to 100% OCR); *, P < 0.05 compared with control.

Similar articles

Cited by

References

    1. Zhang J, Nuebel E, Wisidagama DRR, et al. Measuring energy metabolism in cultured cells, including human pluripotent stem cells and differentiated cells. Nat Protoc. 2012;7:1068–1085. - PMC - PubMed
    1. Dar S, Chhina J, Mert I, et al. Bioenergetic adaptations in chemoresistant ovarian cancer cells. Sci Rep. 2017;7:8760. - PMC - PubMed
    1. Kalyanaraman B, Cheng G, Hardy M, et al. A review of the basics of mitochondrial bioenergetics, metabolism, and related signaling pathways in cancer cells: therapeutic targeting of tumor mitochondria with lipophilic cationic compounds. Redox Biol. 2018;14:316–327. - PMC - PubMed
    1. Marrache S, Pathak RK, Dhar S.. Detouring of cisplatin to access mitochondrial genome for overcoming resistance. Proc Natl Acad Sci U S A. 2014;111:10444–10449. - PMC - PubMed
    1. Liyanage SU, Hurren R, Voisin V, et al. Leveraging increased cytoplasmic nucleoside kinase activity to target mtDNA and oxidative phosphorylation in AML. Blood. 2017;129:2657–2666. - PMC - PubMed

Publication types

MeSH terms