. 2019 Apr 18;133(16):1729-1741.
doi: 10.1182/blood-2018-07-860726. Epub 2019 Feb 12.

PHF6 regulates hematopoietic stem and progenitor cells and its loss synergizes with expression of TLX3 to cause leukemia

Affiliations

PHF6 regulates hematopoietic stem and progenitor cells and its loss synergizes with expression of TLX3 to cause leukemia

Helen M McRae et al. Blood. .

Abstract

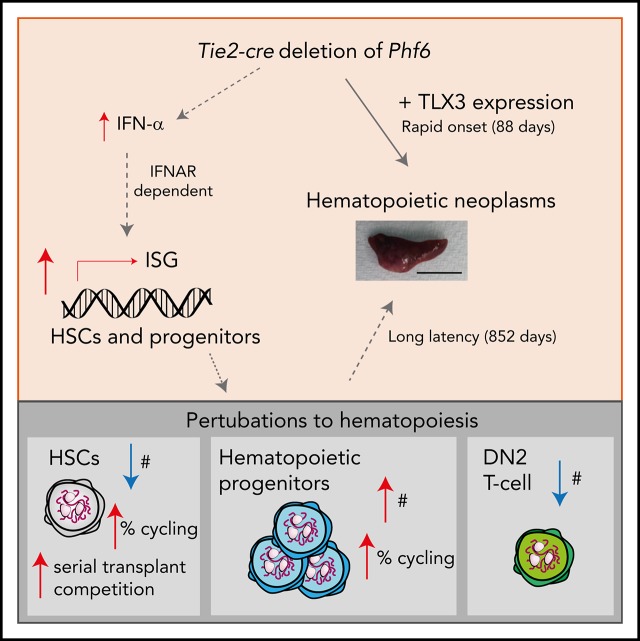
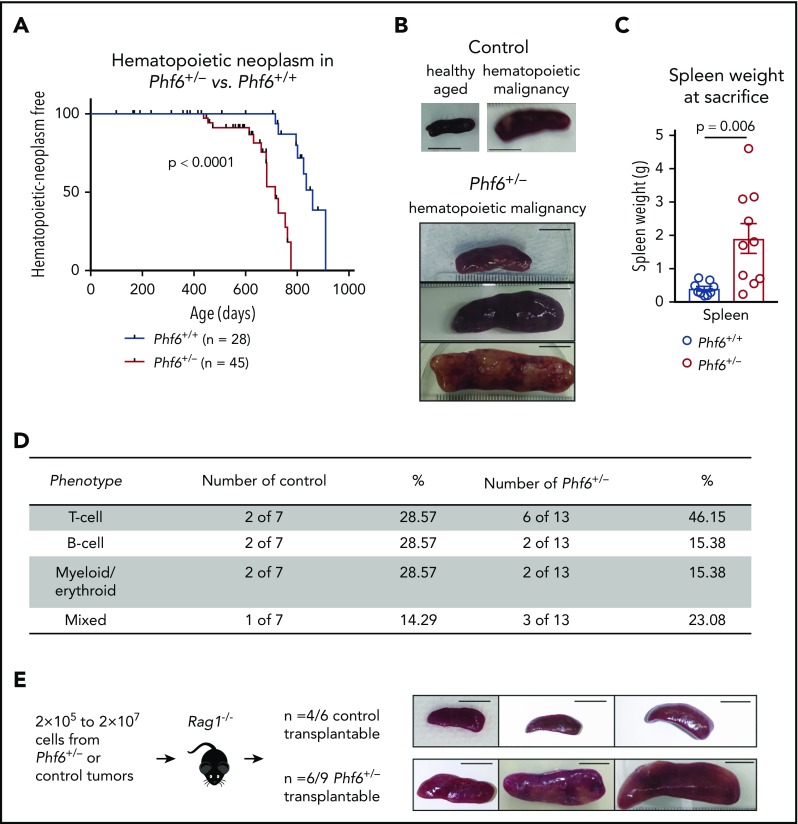
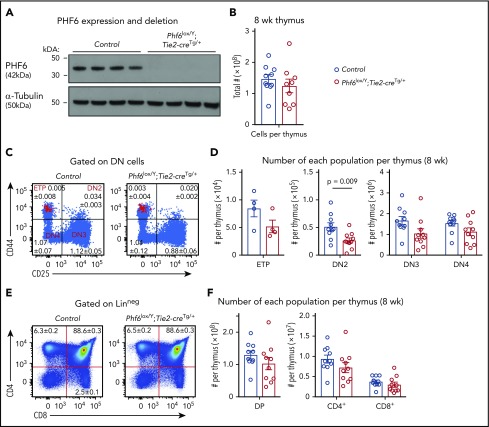
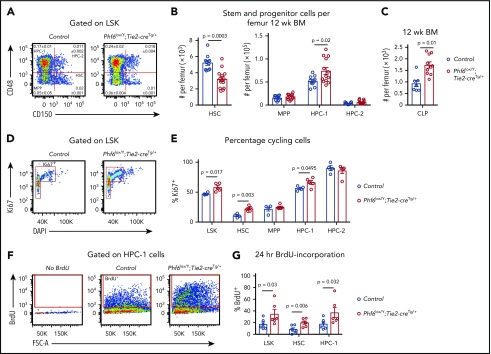
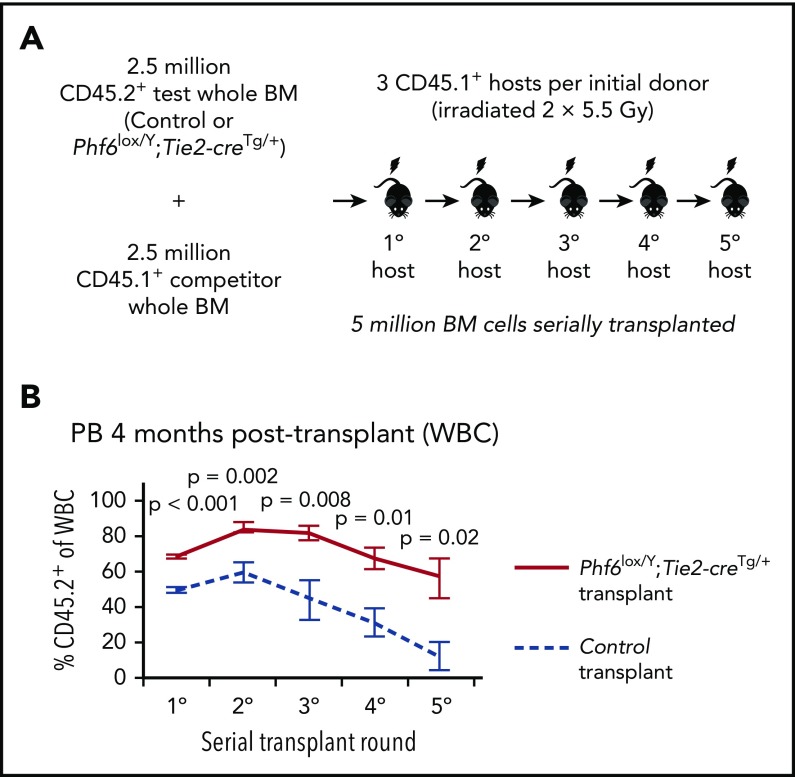
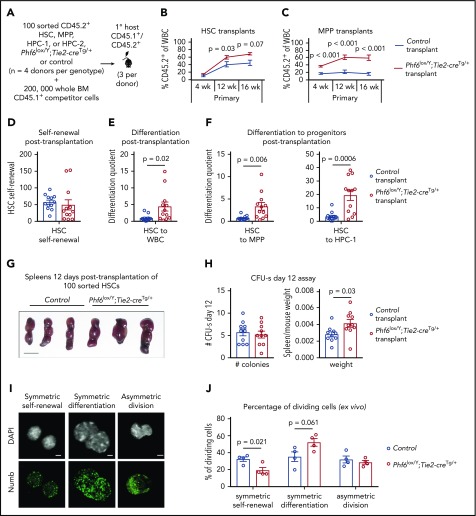
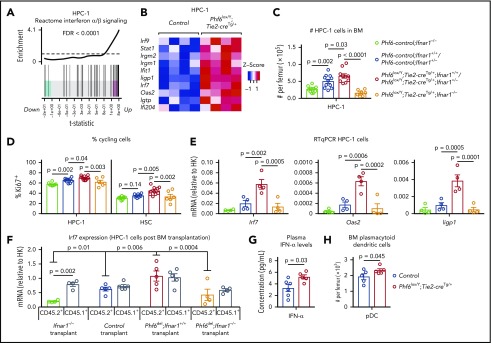
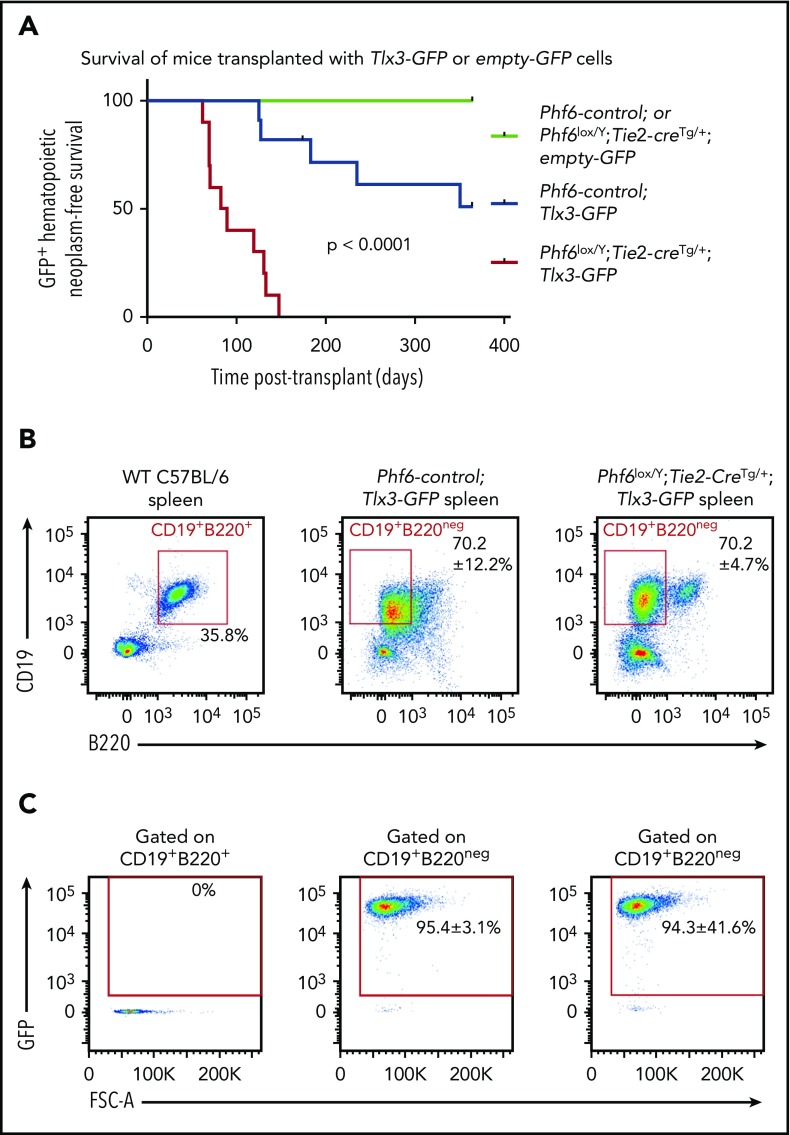
Somatically acquired mutations in PHF6 (plant homeodomain finger 6) frequently occur in hematopoietic malignancies and often coincide with ectopic expression of TLX3. However, there is no functional evidence to demonstrate whether these mutations contribute to tumorigenesis. Similarly, the role of PHF6 in hematopoiesis is unknown. We report here that Phf6 deletion in mice resulted in a reduced number of hematopoietic stem cells (HSCs), an increased number of hematopoietic progenitor cells, and an increased proportion of cycling stem and progenitor cells. Loss of PHF6 caused increased and sustained hematopoietic reconstitution in serial transplantation experiments. Interferon-stimulated gene expression was upregulated in the absence of PHF6 in hematopoietic stem and progenitor cells. The numbers of hematopoietic progenitor cells and cycling hematopoietic stem and progenitor cells were restored to normal by combined loss of PHF6 and the interferon α and β receptor subunit 1. Ectopic expression of TLX3 alone caused partially penetrant leukemia. TLX3 expression and loss of PHF6 combined caused fully penetrant early-onset leukemia. Our data suggest that PHF6 is a hematopoietic tumor suppressor and is important for fine-tuning hematopoietic stem and progenitor cell homeostasis.


Conflict of interest statement

Conflict-of-interest disclosure: The authors declare no competing financial interests.

Figures

None
Graphical abstract
Figure 1.
Figure 1.
Development of leukemia in mice with targeted Phf6 deletion. (A) Kaplan-Meier survival curve showing deaths due to hematopoietic neoplasm in Phf6+/− mice vs Phf6+/+ control mice. Note, a proportion (42% in the female cohort described here) of aged wild-type C57BL/6 mice develop spontaneous hematopoietic neoplasms. A vertical dash on the survival curve indicates deaths due to other causes. Data were analyzed using the Gehan–Breslow–Wilcoxon test. (B) Representative disease-free wild-type control spleen and spleens from Phf6+/+ control mice and Phf6+/− mice with hematopoietic malignancy. (C) Spleen weight of Phf6+/− mice (n = 10) compared with sick Phf6+/+ mice (n = 9), both with hematopoietic malignancy. Data were analyzed using the 2-tailed Student t test and are displayed as individual data points with mean ± standard error of the mean (SEM). (D) Table showing immunophenotype of Phf6+/ and control tumors. There was no significant effect of Phf6 heterozygous mutation. Data were analyzed using the χ2 test. (E) Outcome of transplantation of malignant splenocytes from Phf6+/− and Phf6+/+ mice and photographs of spleens from Rag1−/− recipient mice. Scale bars, 1 cm.
Figure 2.
Figure 2.
Perturbation in early T-cell differentiation caused by loss of PHF6. (A) Western blot of whole-cell lysates from Phf6lox/Y;Tie2-creTg/+ or control (Phf6+/Y) thymi probed with anti-PHF6 antibody, followed by an anti–α-tubulin antibody. Each lane represents thymocytes from 1 animal; a total of 8 animals is shown. (B) Thymocytes per 8-week-old thymus. (C) Gating strategy of early T-cell development. ETP (early thymic progenitor) cells are cKIThi cells within the CD44+CD25neg quadrant and are overlaid in red. DN2, DN3, and DN4 populations are defined by CD44 and CD25 expression, as indicated. Mean percentages ± SEM of each population as a proportion of thymocytes are displayed within the plots. There was a significant decrease in the percentage of DN2 and DN3 cells (P = .006 and P = .0009, respectively). (D) Quantification of each T-cell population indicated per thymus. (E) Gating strategy for late T-cell development showing mean percentages ± SEM for each population in the plot as a proportion of thymocytes. Linneg refers to lack of CD19, B220, MAC1, GR1, and TER119 expression. (F) Quantification of the numbers of thymic double-positive (DP), CD4+, or CD8+ cells. In panels B-F, n = 10 controls (Phf6+/Y;Tie2-creTg/+) and n = 9 Phf6lox/Y;Tie2-creTg/+ mice for all other populations, with the exception of the ETP population (n = 4 per genotype). The color corresponding to genotype is shown in (B). Data are from 8-week-old mice and were analyzed using the 2-tailed Student t test. Bar graphs are presented as individual data points (each circle represents 1 animal), with mean ± SEM.
Figure 3.
Figure 3.
Loss of PHF6 affects HSC and lymphoid progenitor cell populations. (A) Bone marrow LSK cells subdivided based on CD48/CD150 expression, showing HSC, MPP, HPC-1, and HPC-2 cells. The mean percentage ± SEM of each population as a proportion of live bone marrow cells is shown within the plots. The percentage of HSC and HPC-1 cells was significantly different between genotypes (n = as in panel B; P = .0003 and P = .03, respectively). (B) Quantification of the total numbers of HSC, MPP, HPC-1, and HPC-2 cells per femur. n = 10 controls (9 Phf6+/Y;Tie2-creTg/+ and 1 Phf6+/Y); n = 13 Phf6lox/Y;Tie2-creTg/+ mice from 3 experiments combined. (C) Quantification of the numbers of CLPs per femur (CLPs: LinnegSCA1INTcKITINTIL7Rα+). n = 7 controls (6 Phf6+/Y;Tie2-creTg/+, 1 Phf6+/Y), n = 10 Phf6lox/Y;Tie2-creTg/+. Data are from 2 experiments combined. (D) Representative plot showing Ki67 and DAPI staining. (E) Quantification of the percentages of Ki67+ cells among LSK cells and each indicated subpopulation. n = 4 controls (Phf6+/Y;Tie2-creTg/+), n = 5 Phf6lox/Y;Tie2-creTg/+. (F) Plots showing gating for BrdU incorporation after 24 hours of BrdU treatment. (G) BrdU incorporation in HSCs and the indicated progenitor populations over a 24-hour period. n = 6 controls (Phf6+/Y;Tie2-creTg/+), n = 6 Phf6lox/Y;Tie2-creTg/+. Data in panels A-E were analyzed with a 2-tailed Student t test. Data in panel G were analyzed with a 1-tailed Student t test. All bar graphs are presented as individual data points (each circle represents 1 animal), with mean ± SEM.
Figure 4.
Figure 4.
Bone marrow cells lacking PHF6 repopulate the hematopoietic system more efficiently and retain stem cell capacity through serial transplantations. (A) Schematic diagram showing the experimental design for competitive serial hematopoietic transplantation. (B) Percentages of donor cell contribution to long-term reconstitution 4 months after transplantation in each round of serial transplantation. n = 5 control (Phf6+/Y;Tie2-creTg/+), n = 6 Phf6lox/Y;Tie2-creTg/+ donors. All donors were 8 weeks old. Data were arcsine transformed and averaged by donor prior to analysis with a 2-tailed Student t test and are displayed as mean ± SEM. BM, bone marrow.
Figure 5.
Figure 5.
Enhanced hematopoietic reconstitution caused by loss of PHF6 is due to increased production of differentiated progeny. (A) Experimental design for transplants of each indicated population. (B) Contribution of CD45.2+ HSCs to peripheral blood. (C) Contribution of CD45.2+ MPP cells to peripheral blood. (D) Self-renewal of transplanted CD45.2+ HSCs, as calculated by dividing the final number of CD45.2+ HSCs per femur primary transplants by the input (100). (E) Differentiation of transplanted CD45.2+ HSCs to WBCs, calculated by dividing the final number of CD45.2+ WBCs per microliter of blood by the final number of CD45.2+ HSCs per femur. (F) Differentiation of transplanted CD45.2+ HSCs to progenitor populations, calculated by dividing the final number of each CD45.2+ progenitor population per femur by the final number of CD45.2+ HSCs per femur. (G) Representative images of spleens 12 days posttransplantation of 100 control or Phf6lox/Y;Tie2-creTg/+ HSCs. Scale bars, 1 cm. (H) Number of colonies counted on spleens and spleen weight (divided by host mouse weight) 12 days posttransplantation of control or Phf6lox/Y;Tie2-creTg/+ HSCs. (I) Images showing example of symmetric self-renewal (low Numb expression), symmetric differentiation (high Numb expression), and asymmetric differentiation (asymmetric Numb distribution). Scale bars, 2 µm. (J) Frequency of symmetric self-renewing, symmetric differentiating, and asymmetric divisions, as determined by Numb staining in control vs Phf6lox/Y;Tie2-creTg/+ HSCs, cultured for 48 hours, with addition of the mitosis inhibitor nocodazole after 24 hours. n = 4 control (3 Phf6+/Y;Tie2-creTg/+, 1 Phf6+/Y), n = 4 Phf6lox/Y;Tie2-creTg/+ donors in panels A-F. n = 3 control (Phf6+/Y;Tie2-creTg/+), n = 3 Phf6lox/Y;Tie2-creTg/+ donors in panels G-H. n = 4 control (2 Phf6+/Y;Tie2-creTg/+, 1 Phf6+/Y, 1 Phf6lox/Y), n = 4 Phf6lox/Y;Tie2-creTg/+ mice in panels I-J. All donors were 12 weeks old. Data in panels B-C were arcsine transformed prior to being analyzed by the 2-tailed Student t test and are displayed as mean ± SEM. Data in panels D-F,H were analyzed by the 2-tailed Student t test and are mean ± SEM, with individual data points shown for each transplant recipient. Data in panel J were analyzed by the 2-tailed Student t test and are mean ± SEM.
Figure 6.
Figure 6.
PHF6 regulates ISG expression in hematopoietic stem and progenitor cells. (A) Barcode enrichment plots showing positive correlation between the reactome IFN α/β signaling pathway and the gene-expression changes in Phf6-deleted vs control HPC-1 cells. The horizontal axis shows t statistics for all genes in the Phf6-deleted dataset, whereas vertical lines represent genes in the reactome IFN α/β signaling pathway. Red and blue shaded areas indicate genes that are upregulated and downregulated, respectively, in the Phf6-deleted cells, and worms show the relative enrichment of the IFN signature. The IFN signature is enriched among upregulated genes on the right of the plot. (B) Heat maps of a subset of IFN-stimulated genes comparing Phf6-deleted HPC-1 cells with control HPC-1 cells. Each column represents 1 animal. n = 4 controls (Phf6+/Y;Tie2-creTg/+), n = 4 Phf6lox/Y;Tie2-creTg/+. (C) Number of HPC-1 cells in the bone marrow. n = 10 Phf6-control;Ifnar1−/− (3 Phf6+/Y;Tie2-creTg/+;Ifnar1−/−, 5 Phf6lox/Y;Ifnar1−/−, 2 Phf6+/Y;Ifnar1−/−), n = 11 controls (6 Phf6+/Y;Tie2-creTg/+;Ifnar1+/+, 1 Phf6+/Y;Ifnar1+/+, 1 Phf6lox/Y;Ifnar1+/+, 3 Phf6+/Y;Tie2-creTg/+;Ifnar1+/), n = 6 Phf6lox/Y;Tie2-creTg/+;Ifnar1+/+, n = 4 Phf6lox/Y;Tie2-creTg/+;Ifnar1+/, and n = 7 Phf6lox/Y;Tie2-creTg/+;Ifnar1−/−. (D) Percentage of Ki67+ cells in the indicated populations. n = 8 Phf6-control;Ifnar1−/− (3 Phf6+/Y;Tie2-creTg/+;Ifnar1−/−, 3 Phf6lox/Y;Ifnar1−/−, 2 Phf6+/Y;Ifnar1−/−), n = 10 controls (6 Phf6+/Y;Tie2-creTg/+;Ifnar1+/+, 1 Phf6+/Y;Ifnar1+/+, 1 Phf6lox/Y;Ifnar1+/, 2 Phf6+/Y;Tie2-creTg/+;Ifnar1+/), n = 7 Phf6lox/Y;Tie2-creTg/+;Ifnar1+/+, n = 3 Phf6lox/Y;Tie2-creTg/+;Ifnar1+/, and n = 6 Phf6lox/Y;Tie2-creTg/+;Ifnar1−/−. Genotype colors are shown in panel C. (E) RT-qPCR analysis showing mRNA levels of Irf7, Oas2, and Iigp1 in HPC-1 cells of the indicated genotypes relative to mRNA levels in housekeeping genes (HK; Gapdh, Actb, and Pgk1). n = 4 Phf6+/Y;Tie2-creTg/+;Ifnar1−/−, n = 4 Phf6+/Y;Tie2-creTg/+;Ifnar1+/+, n = 4 Phf6lox/Y;Tie2-creTg/+;Ifnar1+/+, and n = 4 Phf6lox/Y;Tie2-creTg/+;Ifnar1−/−. Genotype colors are shown in panel C. (F) RT-qPCR analysis showing mRNA levels of Irf7 in CD45.1+ and CD45.2+ HPC-1 cells isolated from irradiated CD45.1+ host mice 4 months posttransplantation with 2.5 million whole bone marrow cells of the indicated genotype, along with 2.5 million CD45.1+ wild-type competitor cells. n = 4 Phf6+/Y;Tie2-creTg/+;Ifnar1−/− donors, n = 5 control donors (2 Phf6+/Y;Tie2-creTg/+;Ifnar1+/+, 2 Phf6+/Y;Ifnar1+/+, 1 Phf6lox/Y;Ifnar1+/+), n = 5 Phf6lox/Y;Tie2-creTg/+;Ifnar1+/+ donors, and n = 4 Phf6lox/Y;Tie2-creTg/+;Ifnar1−/− donors. Average expression of donors was calculated prior to statistical analysis. Note that 1 host mouse transplanted with control cells was excluded from the analysis because expression of Irf7 was >3 standard deviations above the values of the other control transplants in CD45.1+ and CD45.2+ cells (values of 7.1 and 5.2 arbitrary units relative to HK, respectively). Thus, the average of the other 2 host mice receiving bone marrow from the same donor was used. (G) Concentration of IFN-α in plasma of untreated mice. n = 6 controls (3 Phf6+/Y;Tie2-creTg/+, 3 Phf6+/Y) and n = 5 Phf6lox/Y;Tie2-creTg/+. (H) Number of pDCs in the bone marrow of control mice (n = 5 Phf6+/Y;Tie2-creTg/+) compared with Phf6lox/Y;Tie2-creTg/+ mice (n = 5), as defined by cell surface expression of PDCA1 and Siglec H. (A-B) See “Materials and methods” for details on RNA sequencing analysis. Data in panels C-F were analyzed by 1-way analysis of variance and are individual data points with mean ± SEM showing significant results from multiple comparisons using the Fisher’s least significant difference test. Data in panels G-H were analyzed by the 2-tailed Student t test and are shown as individual points for each animal with mean ± SEM.
Figure 7.
Figure 7.
Loss of PHF6 synergizes with ectopic TLX3 expression to drive leukemogenesis. (A) Kaplan-Meier survival curve of host mice transplanted with Phf6-deleted or Phf6 control cells expressing MSCV-empty-GFP (empty-GFP) or MSCV-Tlx3-GFP (Tlx3-GFP) retrovirus. n = 11 Phf6-control;Tlx3-GFP, n = 10 Phf6lox/Y;Tie2-creTg/+;Tlx3-GFP, n = 6 Phf6-control;empty-GFP, and n = 6 Phf6lox/Y;Tie2-creTg/+;empty-GFP from 4 donors per genotype. Data were analyzed using the Gehan–Breslow–Wilcoxon test. (B) Cell surface phenotype of Tlx3-GFP tumors of indicated Phf6 genotype with comparison with wild-type spleen cells, showing expression of CD19 and B220. (C) Plots showing no GFP expression in normal B cells of a wild-type spleen and GFP+CD19+B220neg cells in Tlx3-GFP transplants. (B-C) The phenotype and quantification ± standard error of the mean are representative of all analyzed Tlx3-GFP tumors (n = 3 Phf6-control;Tlx3-GFP, n = 10 Phf6lox/Y;Tie2-creTg/+;Tlx3-GFP).

Comment in

Similar articles

Cited by

References

    1. Van Vlierberghe P, Palomero T, Khiabanian H, et al. . PHF6 mutations in T-cell acute lymphoblastic leukemia. Nat Genet. 2010;42(4):338-342. - PMC - PubMed
    1. Van Vlierberghe P, Patel J, Abdel-Wahab O, et al. . PHF6 mutations in adult acute myeloid leukemia. Leukemia. 2011;25(1):130-134. - PMC - PubMed
    1. Li X, Yao H, Chen Z, Wang Q, Zhao Y, Chen S. Somatic mutations of PHF6 in patients with chronic myeloid leukemia in blast crisis. Leuk Lymphoma. 2013;54(3):671-672. - PubMed
    1. Xiao W, Pastore F, Getta B, et al. . PHF6 mutations defines a subgroup of mixed phenotype of acute leukemia with aberrant T-cell differentiation [abstract]. Blood. 2017;130(suppl 1). Abstract 1384.
    1. Alexander TB, Gu Z, Iacobucci I, et al. . The genetic basis and cell of origin of mixed phenotype acute leukaemia. Nature. 2018;562(7727):373-379. - PMC - PubMed

Publication types