. 2019 Jun 1;25(11):3430-3442.
doi: 10.1158/1078-0432.CCR-18-0440. Epub 2019 Feb 12.

Combined Aurora Kinase A (AURKA) and WEE1 Inhibition Demonstrates Synergistic Antitumor Effect in Squamous Cell Carcinoma of the Head and Neck

Affiliations

Combined Aurora Kinase A (AURKA) and WEE1 Inhibition Demonstrates Synergistic Antitumor Effect in Squamous Cell Carcinoma of the Head and Neck

Jong Woo Lee et al. Clin Cancer Res. .

Abstract

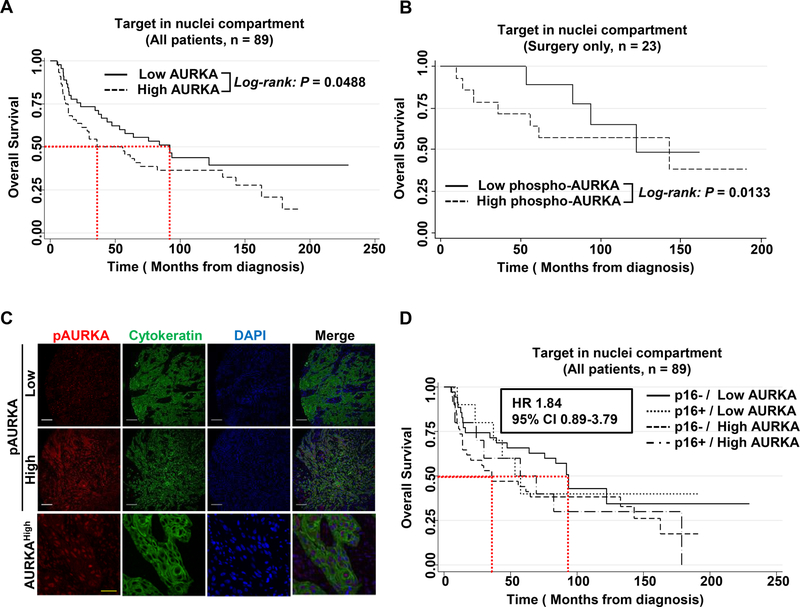
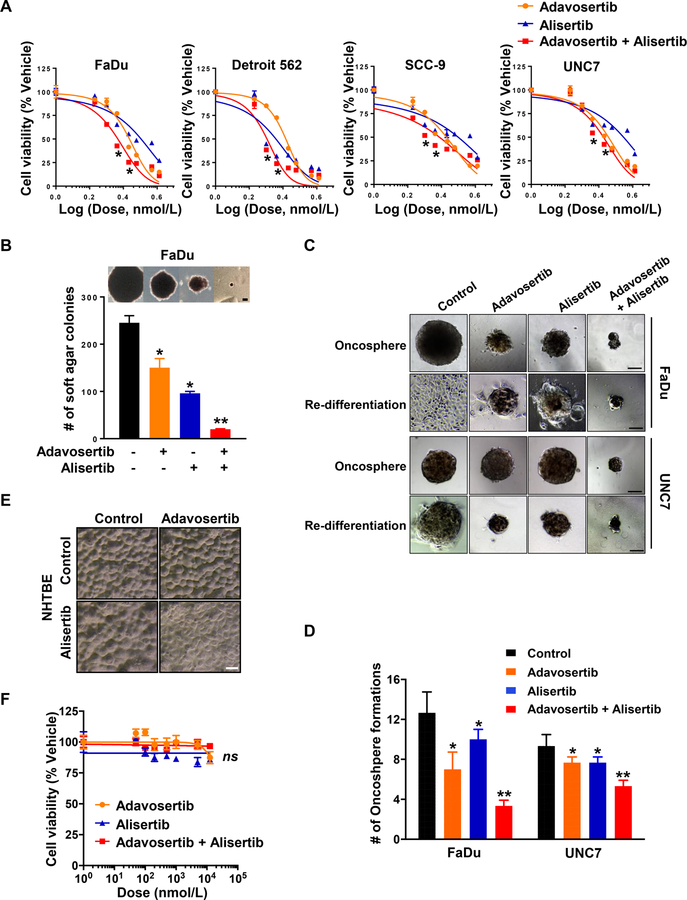
Purpose: Human papillomavirus (HPV)-negative head and neck squamous cell carcinomas (HNSCC) commonly bear disruptive mutations in TP53, resulting in treatment resistance. In these patients, direct targeting of p53 has not been successful, but synthetic lethal approaches have promise. Although Aurora A kinase (AURKA) is overexpressed and an oncogenic driver, its inhibition has only modest clinical effects in HPV-negative HNSCC. We explored a novel combination of AURKA and WEE1 inhibition to overcome intrinsic resistance to AURKA inhibition.Experimental Design: AURKA protein expression was determined by fluorescence-based automated quantitative analysis of patient specimens and correlated with survival. We evaluated treatment with the AURKA inhibitor alisertib (MLN8237) and the WEE1 inhibitor adavosertib (AZD1775), alone or in combination, using in vitro and in vivo HNSCC models.

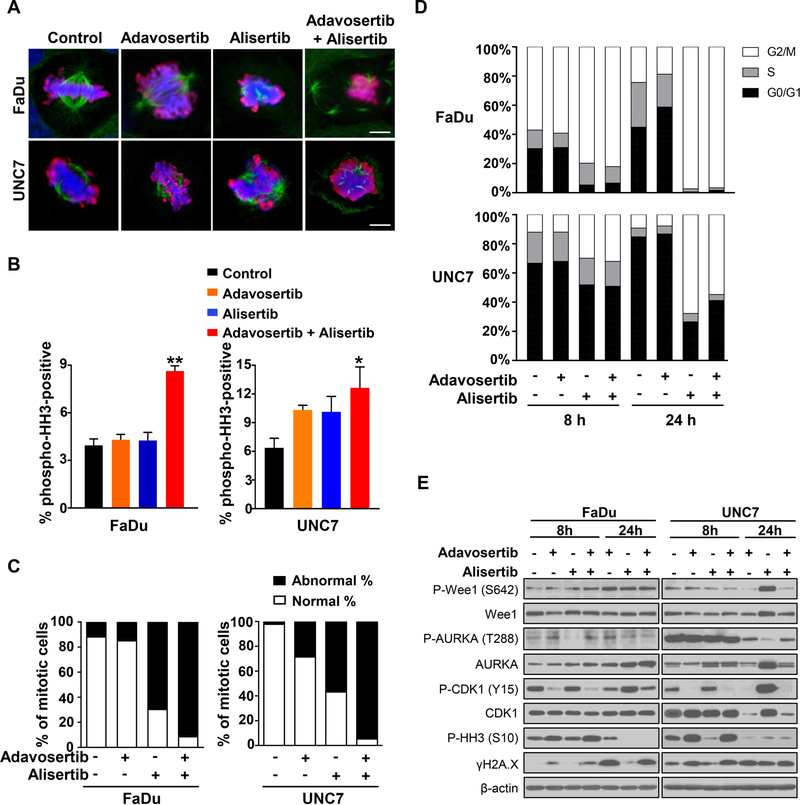
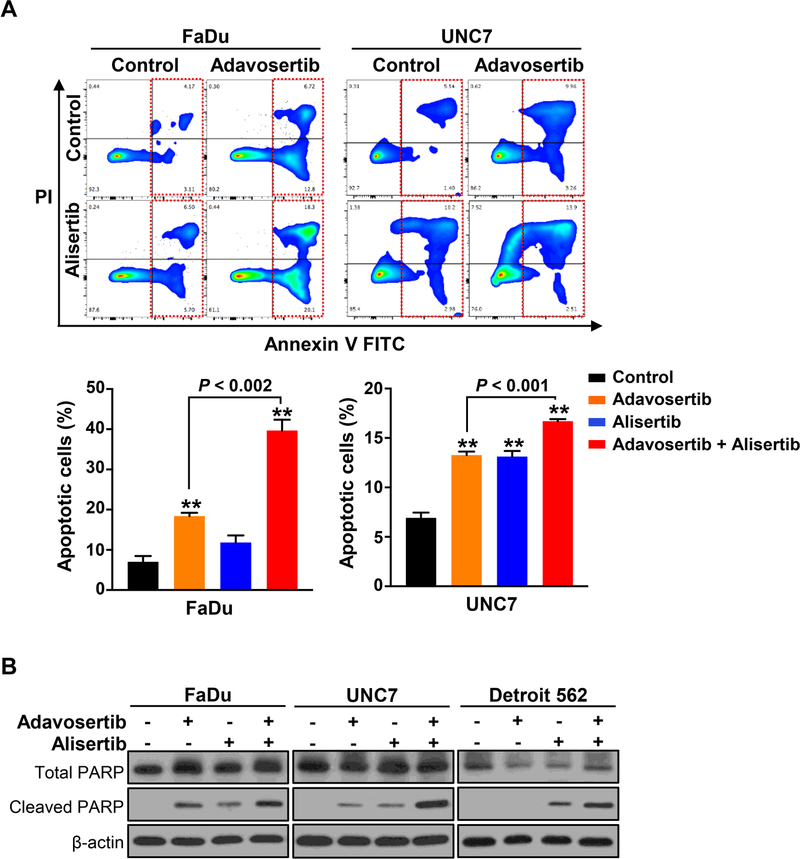
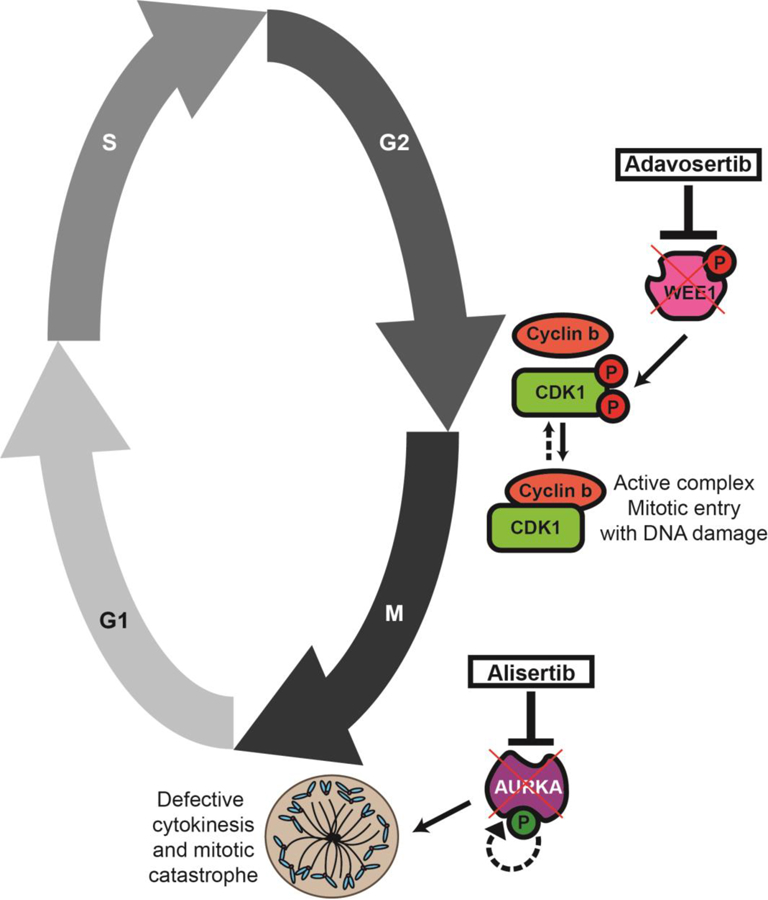
Results: Elevated nuclear AURKA correlated with worse survival among patients with p16(-) HNSCC. Alisertib caused spindle defects, G2-M arrest and inhibitory CDK1 phosphorylation, and cytostasis in TP53 mutant HNSCC FaDu and UNC7 cells. Addition of adavosertib to alisertib instead triggered mitotic entry and mitotic catastrophe. Moreover, in FaDu and Detroit 562 xenografts, this combination demonstrated synergistic effects on tumor growth and extended overall survival compared with either vehicle or single-agent treatment.

Conclusions: Combinatorial treatment with adavosertib and alisertib leads to synergistic antitumor effects in in vitro and in vivo HNSCC models. These findings suggest a novel rational combination, providing a promising therapeutic avenue for TP53-mutated cancers.


Conflict of interest statement

Disclosure of Potential Conflicts of Interest: Barbara Burtness reports consulting fees from Astra-Zeneca.

Figures

Figure 1
Figure 1. Overexpressed nuclear AURKA is associated with a poor overall survival of HPV-negative HNSCC patients.
Nuclear expression of pAURKA/AURKA was assessed in 89 HNSCC surgical specimens using AQUA analysis. AURKA expression was classified into high or low AURKA expression based on relation to median AURKA levels. (A) Kaplan Meier curves were generated for all patients (n = 89) regarding AURKA level in nucleus regardless HPV positivity (HR 1.9, 95% CI 1.05–3.46). (B) Kaplan Meier curves were generated for 23 patients who got surgery only regarding pAURKA status after adjustment for T stage. (C) Representative AQUA images of pAURKA (top) and AURKA (bottom) in HNSCC surgical specimens. Scale bars: white: 100 µm, yellow: 10 µm. (D) Kaplan Meier curve for all patients (n = 89) who were grouped into 4 categories: p16-/Low AURKA; p16+/Low AURKA; p16−/High AURKA; p16+/High AURKA- classified by HPV positivity (p16) and AURKA status (HR 1.84, 95% CI 0.89–3.79).
Figure 2
Figure 2. Concomitant inhibition of AURKA and WEE1 synergistically suppresses cell growth and survival of HNSCC cells.
(A) Dose-response curve of human HNSCC cell lines, FaDu, Detroit 562, SCC-9 and UNC7 treated with adavosertib (AZD1775, orange), alisertib (MLN8237, blue), and adavosertib + alisertib (red), from a 3-day CellTiter-Glo assay. Cell viability was normalized to vehicle-treated control cells. (B) FaDu cells were plated with low density of agarose (0.4 %) and treated with the indicated drugs in anchorage-independent growth condition. A colony was defined as anything containing more than 10 cells, as indicated >50 pixels in Image J. Representative image of colony formation in soft agar. Scale bar: 100 µm. (C and D) FaDu and UNC7 cells were cultured with the conditioned media for oncosphere formation assay for 7–9 days and then formed spheres were transferred to standard tissue culture condition for additional 2 days. (C) Representative image of oncospheres (top) and re-differentiated spheres (bottom). Scale bar: 100 µm. (D) The number of oncospheres were counted using light microscopy. (E) Representative image of NHTBE cells morphology captured at 3 days after exposure to vehicle, adavosertib (500 nM), alisertib (250 nM), or adavosertib + alisertib in organotypic air-liquid interface culture condition. Scale bar: 100 µm. (F) Dose-response curve of NHTBE cells treated with adavosertib (orange), alisertib (blue), and adavosertib + alisertib (red), from a 3-day CellTiter-Glo assay. Cell viability was normalized to vehicle-treated control cells. Graphs depict Mean ± SEM from triplicated and/or three times repeated independent experiments. Statistical significance was assessed by Student’s t-test (ns: not significant; *: P < 0.05; **: P < 0.005).
Figure 3
Figure 3. Combined inhibition of AURKA and WEE1 affects mitotic morphology in HNSCC cells.
(A–C) FaDu and UNC7 cells were treated with adavosertib (500 nM), alisertib (250 nM), or adavosertib + alisertib for 24 hours and followed by immunofluorescent staining with anti-tubulin (Green) and anti-pHH3 (S10; Red). Nucleus was stained with DAPI. (A) Representative images of mitotic cells were captured by confocal microscopy. Scale bar: 10 µm. (B) Percentage of pHH3-positive cells in all DAPI-positive FaDu (left) and UNC7 (right) cells. Fields were randomly captured and counted DAPI-positive cells at least over 400 cells. (C) Percentage of normal or abnormal mitotic cells in pHH3-positive FaDu (left) and UNC7 (right) cells. (D) Cells were treated with the indicated drug singly or in combination for 8 and 24 hours and followed by assessing cell cycle distribution of FaDu (top) and UNC7 (bottom) cells by FACS analysis. (E) Cells were treated with the indicated drug singly or in combination for 8 and 24 hours. Cell lysates were subjected to SDS-PAGE and immunoblotting with the indicated antibodies.
Figure 4
Figure 4. Combined treatment of adavosertib and alisertib synergistically triggers apoptosis induction in HNSCC cells.
(A) FaDu (left) or UNC7 (right) cells were treated with adavosertib (500 nM), alisertib (250 nM), or adavosertib + alisertib for 24 hours and followed by staining with Annexin V and PI for apoptosis by FACS analysis. Representative image of apoptosis induction responding to the treatments determined by FACS analysis (top) and percentage of apoptotic cells (bottom). Graphs depict Mean ± SEM from three times repeated independent experiments. Statistical significance was assessed by Student’s t-test (**: P < 0.005). (B) The indicated cell lines were exposed to the drugs singly or in combination for 24 hours. Cell lysates were subjected to SDS-PAGE and immunoblotting with anti-cleaved PARP antibody for apoptosis induction.
Figure 5
Figure 5. Co-inhibition of AURKA and WEE1 enhances the antitumor efficacy and extends survival of HNSCC in vivo model.
(A) Representative image and weight (g) of FaDu-xenografted tumors (n = 8–9) exposed to vehicle, adavosertib (ADV; 30 mg/kg or 90 mg/kg, daily, p.o.), alisertib (ALI; 30 mg/kg, daily, p.o.), or the combinations of alisertib with either adavosertib (30 mg/kg) or adavosertib (90 mg/kg). Scale bar: 1 cm. (B) Tumor volume was monitored twice a week. Humane endpoint was considered when tumor volume reached 1,000 mm3 following IACUC policy. (C) Overall survival of FaDu-xenografted mice treated with the drugs as single or combination (n = 8–9). (D) Representative image and weight (g) of Detroit 562-xenografted tumors (n = 6) exposed to vehicle, adavosertib (ADV; 30 mg/kg, daily, p.o.), alisertib (ALI; 30 mg/kg, daily, p.o.), or the combinations of alisertib with adavosertib (30 mg/kg). Scale bar: 1 cm. Graphs depict Mean ± SEM. Significant differences between the combinations and drug alone are exhibited. Statistical significance was assessed by Student’s t-test (**: P < 0.005). (E) Tumor volume was monitored every other day. Graphs depict Mean ± SEM. Significant differences between the combinations and drug alone are shown. Statistical significance was assessed by Student’s t-test (*: P < 0.05; **: P < 0.005) (F) Overall survival of Detroit 562-xenografted mice treated with the drugs as single or combination (n = 6). Log-rank (Mantel-Cox) testing was calculated by Prism 7. Significant differences between the combinations and drug alone are exhibited. (H) Representative IHC staining images of Ki-67 and cleaved-caspase 3 in FaDu-xenografted mice treated with the indicated drugs. Scale bar: 100 µm. (G) Representative immunofluorescent staining images of pCDK1 (Y15; Red), cytokeratin (Green) and DAPI (blue) in the FaDu-xenografted mice treated with the indicated drugs. Images in small box were enlarged with high power. Scale bars: 100 µm (large images) and 50 µm (small images).
Figure 6
Figure 6. Schematic model of the effect by the combined inhibition of AURKA and WEE1 in this study.
The addition of the WEE1 inhibitor adavosertib would prevent the checkpoint kinase WEE1 with dephosphorylating CDK1 therefore leading to mitotic entry in the presence of DNA damage. When the AURKA inhibitor alisertib is concomitantly added, a failure in cytokinesis including spindle formation and centrosome maturation would in turn lead to mitotic catastrophe and cell death.

Similar articles

Cited by

References

    1. Siegel RL, Miller KD, Jemal A. Cancer Statistics, 2017. CA Cancer J Clin 2017;67:7–30. - PubMed
    1. Comprehensive genomic characterization of head and neck squamous cell carcinomas. Nature 2015;517:576–82. - PMC - PubMed
    1. Moser R, Xu C, Kao M, Annis J, Lerma LA, Schaupp CM, et al. Functional kinomics identifies candidate therapeutic targets in head and neck cancer. Clinical cancer research : an official journal of the American Association for Cancer Research 2014;20:4274–88. - PMC - PubMed
    1. Mehra R, Serebriiskii IG, Burtness B, Astsaturov I, Golemis EA. Aurora kinases in head and neck cancer. Lancet Oncol 2013;14:e425–35. - PMC - PubMed
    1. Astsaturov I, Ratushny V, Sukhanova A, Einarson MB, Bagnyukova T, Zhou Y, et al. Synthetic lethal screen of an EGFR-centered network to improve targeted therapies. Science signaling 2010;3:ra67. - PMC - PubMed

MeSH terms