. 2019 Apr 15;79(8):1952-1966.
doi: 10.1158/0008-5472.CAN-18-1604. Epub 2019 Feb 12.

Acidification of Tumor at Stromal Boundaries Drives Transcriptome Alterations Associated with Aggressive Phenotypes

Affiliations

Acidification of Tumor at Stromal Boundaries Drives Transcriptome Alterations Associated with Aggressive Phenotypes

Nazanin Rohani et al. Cancer Res. .

Abstract

Acidosis is a fundamental feature of the tumor microenvironment, which directly regulates tumor cell invasion by affecting immune cell function, clonal cell evolution, and drug resistance. Despite the important association of tumor microenvironment acidosis with tumor cell invasion, relatively little is known regarding which areas within a tumor are acidic and how acidosis influences gene expression to promote invasion. Here, we injected a labeled pH-responsive peptide to mark acidic regions within tumors. Surprisingly, acidic regions were not restricted to hypoxic areas and overlapped with highly proliferative, invasive regions at the tumor-stroma interface, which were marked by increased expression of matrix metalloproteinases and degradation of the basement membrane. RNA-seq analysis of cells exposed to low pH conditions revealed a general rewiring of the transcriptome that involved RNA splicing and enriched for targets of RNA binding proteins with specificity for AU-rich motifs. Alternative splicing of Mena and CD44, which play important isoform-specific roles in metastasis and drug resistance, respectively, was sensitive to histone acetylation status. Strikingly, this program of alternative splicing was reversed in vitro and in vivo through neutralization experiments that mitigated acidic conditions. These findings highlight a previously underappreciated role for localized acidification of tumor microenvironment in the expression of an alternative splicing-dependent tumor invasion program. SIGNIFICANCE: This study expands our understanding of acidosis within the tumor microenvironment and indicates that acidosis induces potentially therapeutically actionable changes to alternative splicing.


Conflict of interest statement

Conflict of interest:

The authors declare no potential conflicts of interest.

Figures
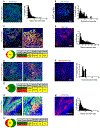
Figure 1:
Figure 1:
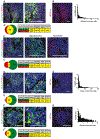
Tumor-stroma interface is acidic. Immunofluorescence detection of pHLIP-Cy7, in primary tumors (A) and metastatic lesions (B) from PyMT mice. Graphs show localization of pHLIP positive cells relative to tumor dimensions. X axis: distance in pixels from tumor edge; Y axis: mean percentage of (3+) cells (highest levels of pHLIP membrane positivity). C) Carbonic anhydrase (CA9) expressing cells overlap cells with pHLIP-labeled membranes. D) Spatial distribution of CA9-positive cells within the tumor. Highest expressing cells located proximal to the tumor-stroma interface. E) Degree of overlap between acidic and hypoxic areas. Cell based co-localization analysis for images co-stained to detect hypoxic areas using piminidazol and acidic areas in tumors collected from mice injected with both probes. F). Spatial distribution of hypoxic areas relative to the tumor-stroma interface. G) Immunofluorescence labeling for LDHA and pHLIP. H) The spatial distribution of LDHA positive cells. C’, E’, G’) Summary of cell-based segmentation and co-localization analyses. Venn diagrams show average cell numbers. Tables show the percentage of single and double positive cells for each marker. p value and odds ratio indicate significance and degree of association for the two marker, Pearson r measures degree of cell-wise intensity correlation across samples. Pearson p values were quantified using two-tailed Student’s t test. (***=< 0.001, *=<0.05). Scale bars=100um.
Figure 2:
Figure 2:
Acidic front is invasive and proliferative. A) Immunofluorescence labeling of PyMT tumor tissues for MMP9 and pHLIP. A’) Cell-based overlap and signal intensity correlation of MMP9 and pHLIP. B) MMP9 distribution relative to tumor dimension. C) Laminin is absent from cells that are pHLIP-positive. C’) Cell-based analysis of laminin (basement membrane) relative to acidic areas marked by pHLIP. D’-F’) Immunofluoresnce of Ki67 and pHLIP. E-G) Ki67 positive cells are enriched at the tumor-stroma interface. Pearson p values were quantified using two-tailed Student’s t test. (***=< 0.001, *=<0.05). Scale bars=100um.
Figure 3:
Figure 3:
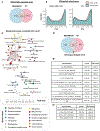
Transcriptomic alterations in response to low extracellular pH. A) The expression of 2752 genes (padj < 0.05, log2 fold change > 0.5, mean control read count > 10) in MDA-MB-231 and 4T1 cells significantly overlap (Hypergeometric statistics, p = 10−419). A’) The overlapping genes, ranked by mean log2 fold change analyzed by Gene Set Enrichment Analysis using GO biological process (BP) terms. Enrichment network visualized for gene sets with FDR < 0.01. Node sizes correspond to the number of genes in the GO term gene sets that also occur in the fold-change gene input list. Clusters of similar ontologies were manually assigned a group name based on high-level biological processes shared among nodes. B) Global profiling of splicing changes in response to pH in mouse and human dataset. Percent spliced in (PSI= Inclusion ratio/Inclusion ratio +exclusion ratio) of all exons in normal pH (pH7.4) and acidic pH (pH6.4). B’) 298 orthologous exons (padj < 0.05, FDR < 0.01 and abs Δ PSI> 0.05) significantly spliced in mouse and human datasets (Hypergeometric statistics, p = 10−30). B”) Gene set enrichment analysis of orthologous exons. B’”) Gene set enrichment analysis of same list for identification of associated pathways.
Figure 4:
Figure 4:
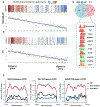
Targets of RNA binding proteins with AU-rich motifs are enriched in genes upregulated in response to low pH. A) Spectrum plot generated by Transite, suggests a highly non-random arrangement of putative binding sites across all transcripts. The transcripts from RNA-seq data set for MDA-MB-231 and 4T1 sorted by log2 fold change pH7.4 / pH 6.4 in ascending order; transcripts with highest expression in low pH 6.4 (negative fold change) are on the left, down-regulated transcripts on the right. Putative ELAVL1 binding sites are enriched in transcripts upregulated in low pH 6.4 (shown in red) and depleted in transcripts downregulated (shown in blue). B) Venn diagram depicts the overlap amongst the RBPs with a significant overrepresentation of putative binding sites in transcripts upregulated in low pH conditions in human and mouse datasets. C) The enrichment of CLIP peaks for HUR, TIA1, and KHSRP at 3’UTR of transcripts up-regulated in low pH indicate the binding sites of these RBPs are enriched in acidosis condition Metaplots of CLIP densities in 3’UTRs are plotted for: genes up in low pH (>1.5-fold relative to control) down in pH6, genes down in low pH (>1.5 fold relative to control) and control genes, where the fold-change in gene expression was less than 1.1 fold between both conditions. Significance of putative binding site enrichment values per bin indicated in spectrum plots as (***=< 0.001, **=<0.01, *=<0.05).
Figure 5:
Figure 5:
Candidate splicing events are pH responsive. A) Inclusion/exclusion ratio relative fold change of candidate events 48hrs after exchange of low-pH medium with pH7.4 medium. B) Inclusion/exclusion ratio relative fold change of candidate events after culture in 0.2% oxygen +/− 50mM HEPES. B’) pH of media in which cells were cultured for 3 days or 10 days in 0.2% oxygen +/− HEPES. B”.) Hif1 and Hif2 mRNA expression levels in hypoxic conditions +/− 50mM HEPES. C) Inclusion/exclusion ratio fold change of candidate events following lactate acidosis induction by metformin +/− HEPES addition. C’) pH of the culture medium following metformin treatment +/− HEPES addition. N=4 experiments, 2 technical replicates, Student’s t-test p < 0.05 *, p <0.01 **
Figure 6:
Figure 6:
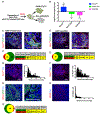
In vivo validation of pH-responsive transcriptomic changes. A) Schematic of workflow for isolating cells from the low pH tumor areas. B) Inclusion/exclusion ratio relative fold change of candidate events in sorted pHLIP positive vs. pHLIP negative cells. C, E) Expression and colocalization analysis of MenaINV immunofluorescence relative to pHLIP labeled acidic areas in primary and metastatic lesions from PyMT mice. C’,E’) Cell based overlap and Pearson correlation coefficient analysis of MenaINV and pHLIP positive cells. D, F) Spatial distribution of MenaINV (3+) expressing cells relative to tumor-stroma interfaces in primary tumor and metastatic lesions. G) Immunofluorence of HDAC2 and pHLIP in PyMT tumor. G’) Cell based overlap and Pearson correlation coefficient of HDAC2 and pHLIP. H) Spatial distribution of HDAC (3+) expressing cells relative to tumor-stroma interface in primary tumor. N=5 experiments 2 technical replicates (Students’ t-test p<0.05 *, p<0.01 **). Scale bars=100um.
Figure 7:
Figure 7:
Buffering tumor acidity significantly modulates the expression of candidate splicing events. A-A’) Immunofluorescence of MenaINV isoform and pHLIP in control or alkalinized tumors collected from PyMT mice (n=7 per group, scale bar = 4mm). A”) Percentages of total MenaINV positive cells measured by immunostaining. B-C) qPCR analysis on bulk tumors collected from control and bicarbonated water treated MMTV-PyMT and xenograft tumor from NOD SCID mice.

References

    1. Gatenby RA, Smallbone K, Maini PK, Rose F, Averill J, Nagle RB, et al. Cellular adaptations to hypoxia and acidosis during somatic evolution of breast cancer. Br J Cancer. 2007;97:646–53. - PMC - PubMed
    1. Damaghi M, Tafreshi NK, Lloyd MC, Sprung R, Estrella V, Wojtkowiak JW, et al. Chronic acidosis in the tumour microenvironment selects for overexpression of LAMP2 in the plasma membrane Nat Commun. Nature Publishing Group; 2015;6:8752. - PMC - PubMed
    1. Robertson-Tessi M, Gillies RJ, Gatenby RA, Anderson ARA. Impact of metabolic heterogeneity on tumor growth, invasion, and treatment outcomes. Cancer Res. 2015;75:1567–79. - PMC - PubMed
    1. Andreucci E, Peppicelli S, Carta F, Brisotto G, Biscontin E, Ruzzolini J, et al. Carbonic anhydrase IX inhibition affects viability of cancer cells adapted to extracellular acidosis. J Mol Med. Journal of Molecular Medicine; 2017;95:1341–53. - PubMed
    1. Wojtkowiak JW, Verduzco D, Schramm KJ, Gillies RJ. Drug resistance and cellular adaptation to tumor acidic pH microenvironment. Mol Pharm. 2011;8:2032–8. - PMC - PubMed

Publication types

MeSH terms