. 2019 Apr 1;218(4):1235-1249.
doi: 10.1083/jcb.201810058. Epub 2019 Feb 12.

Quantitative phosphoproteomics reveals mitotic function of the ATR activator ETAA1

Affiliations

Quantitative phosphoproteomics reveals mitotic function of the ATR activator ETAA1

Thomas E Bass et al. J Cell Biol. .

Abstract

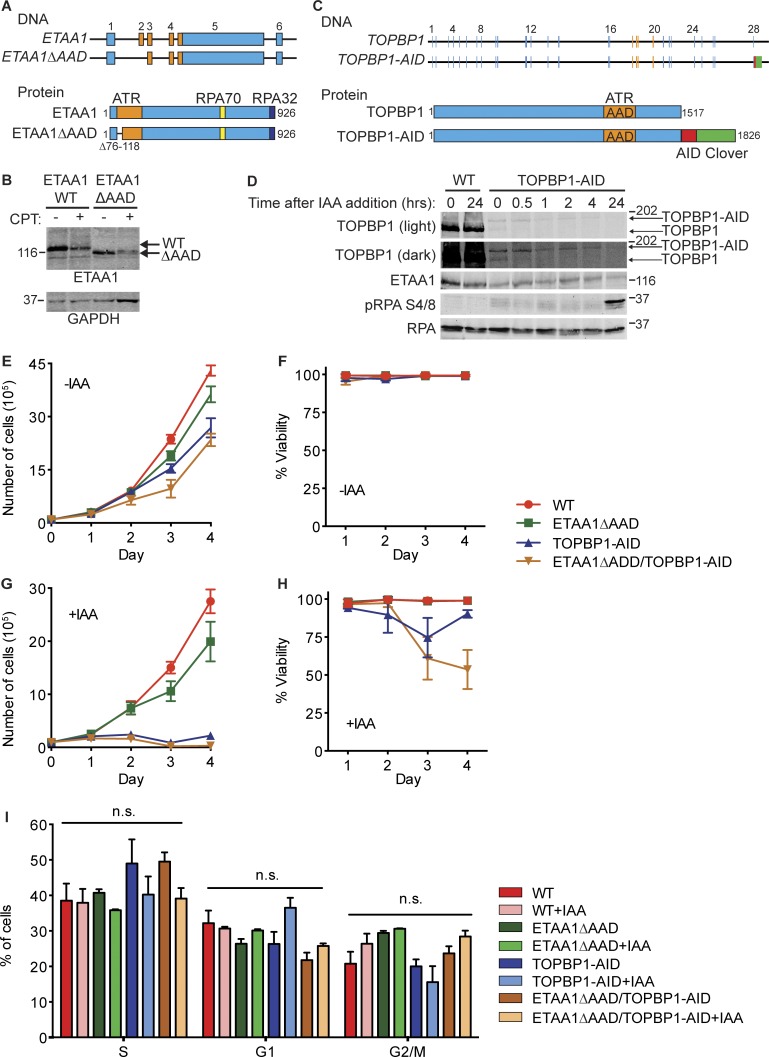
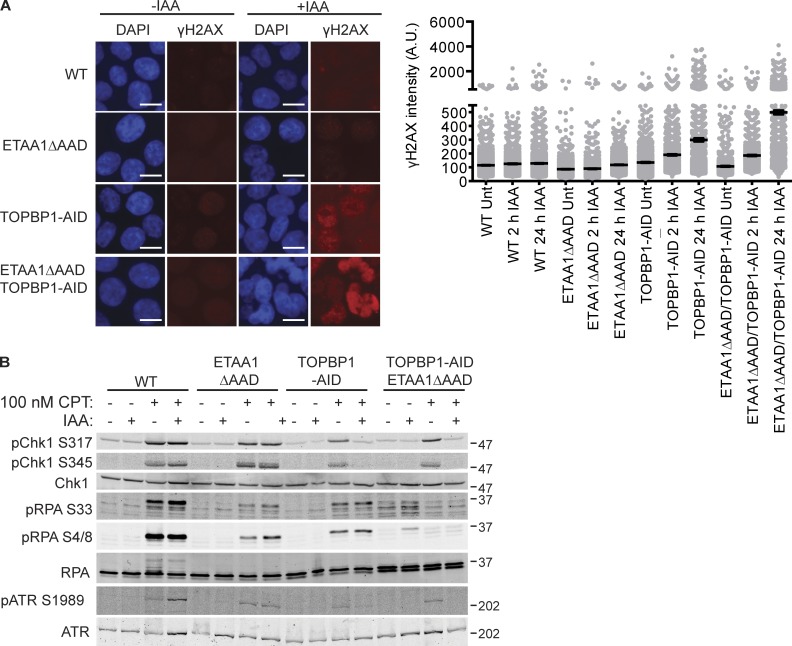
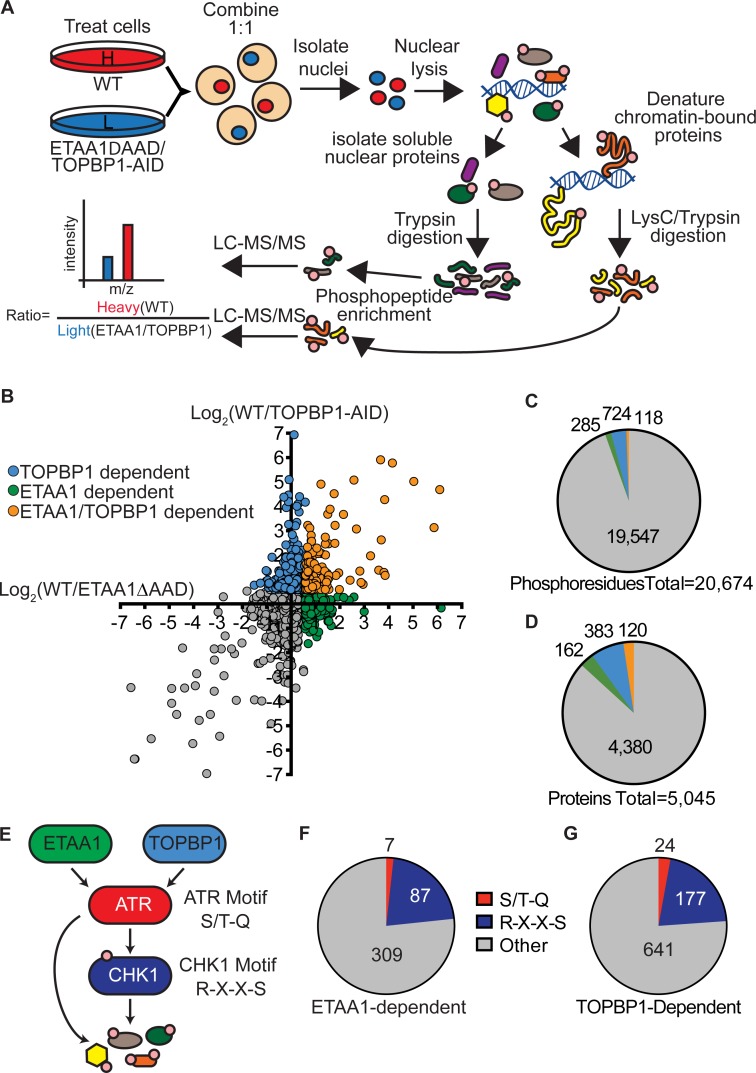
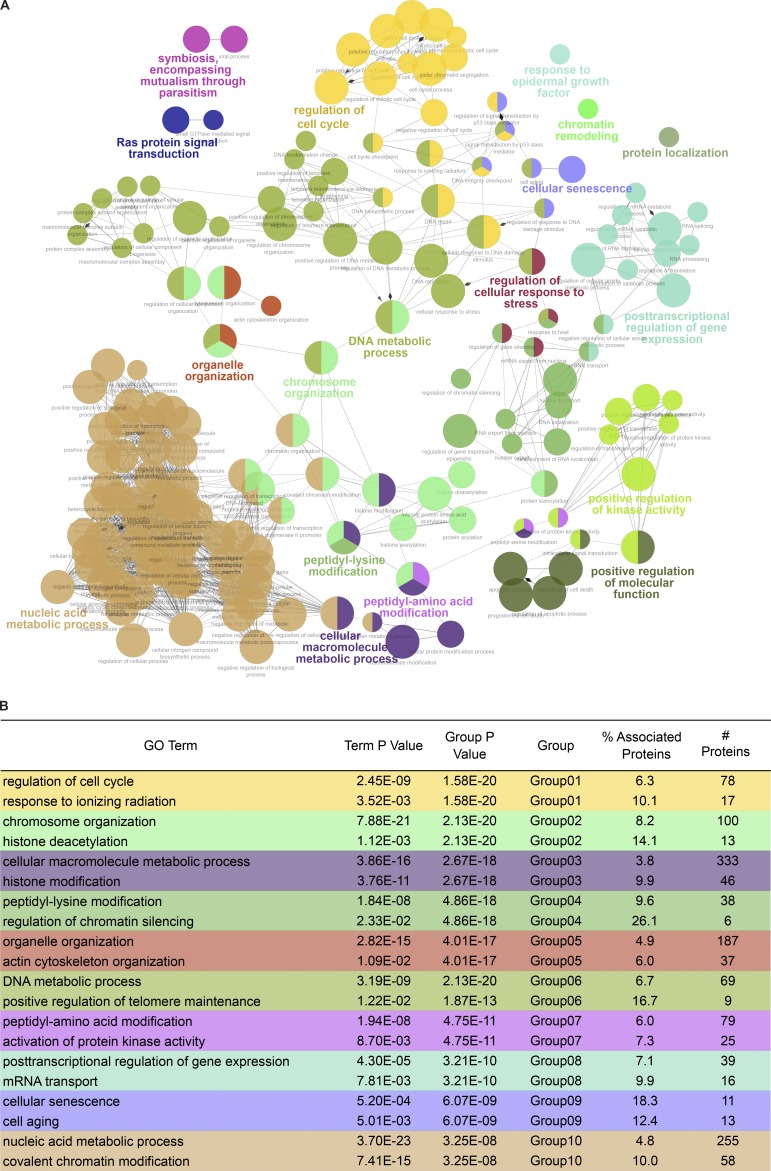
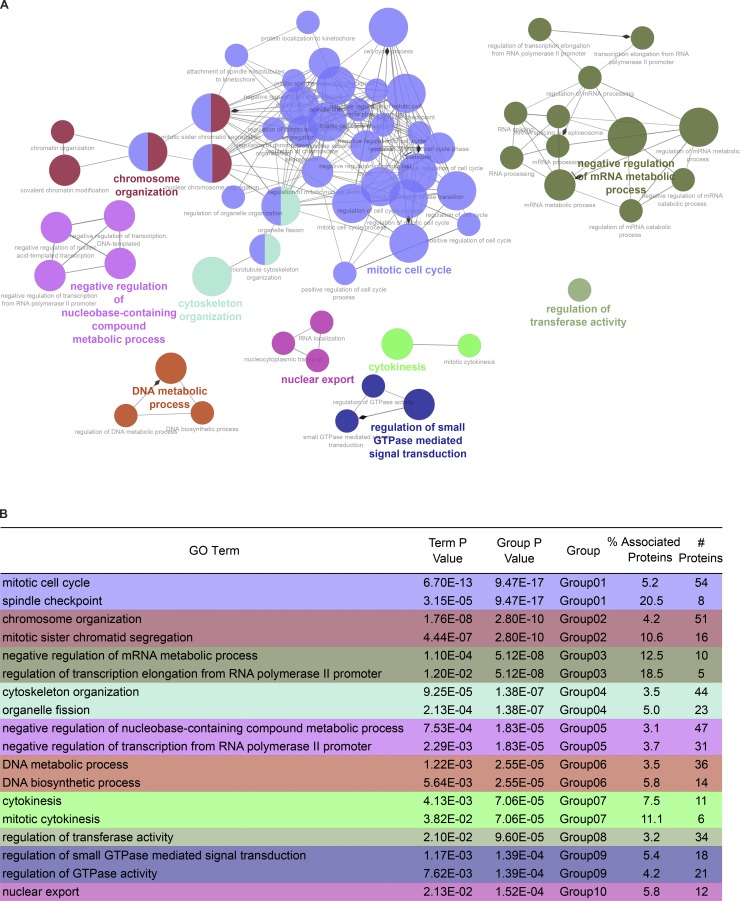
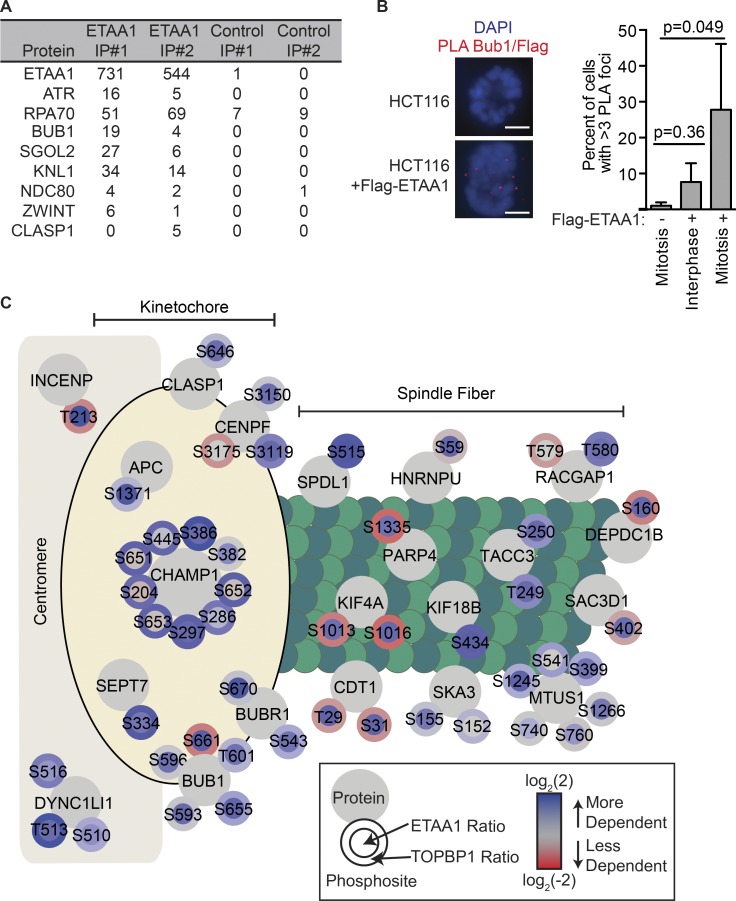
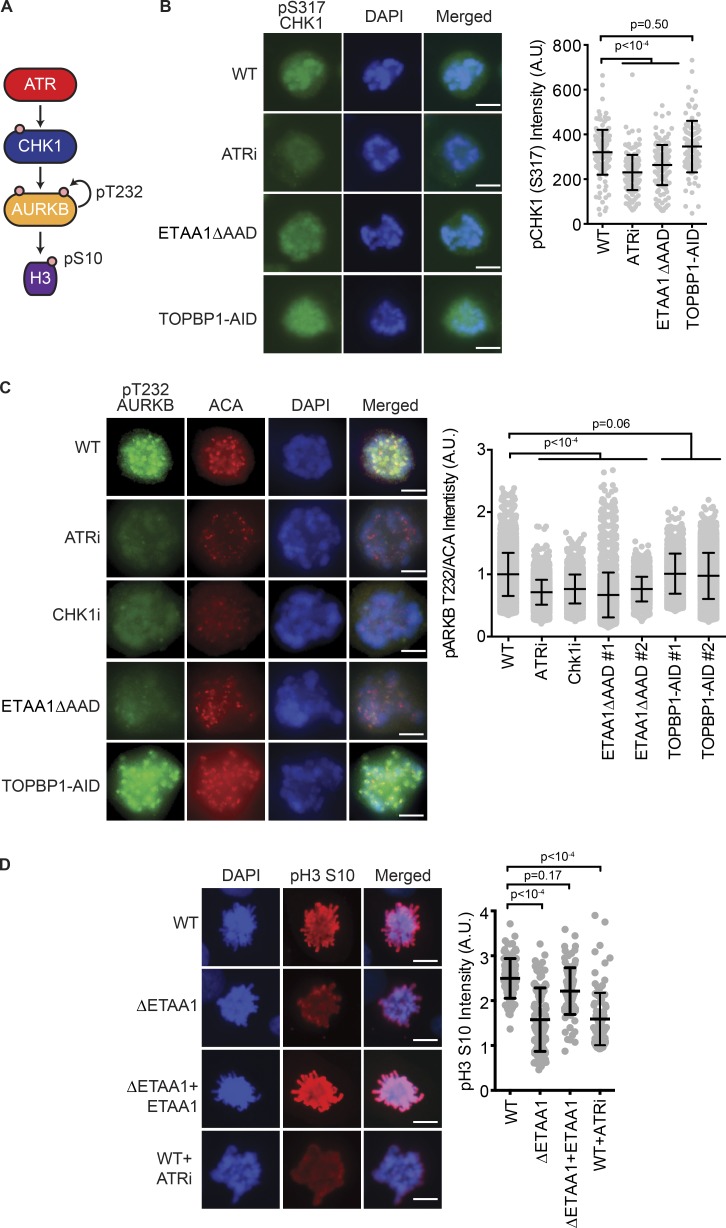
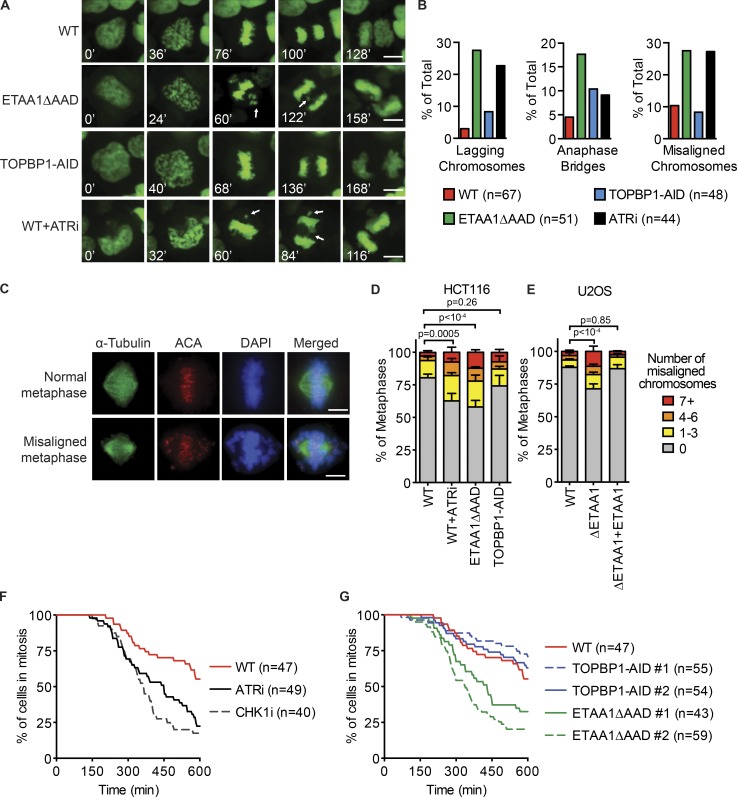
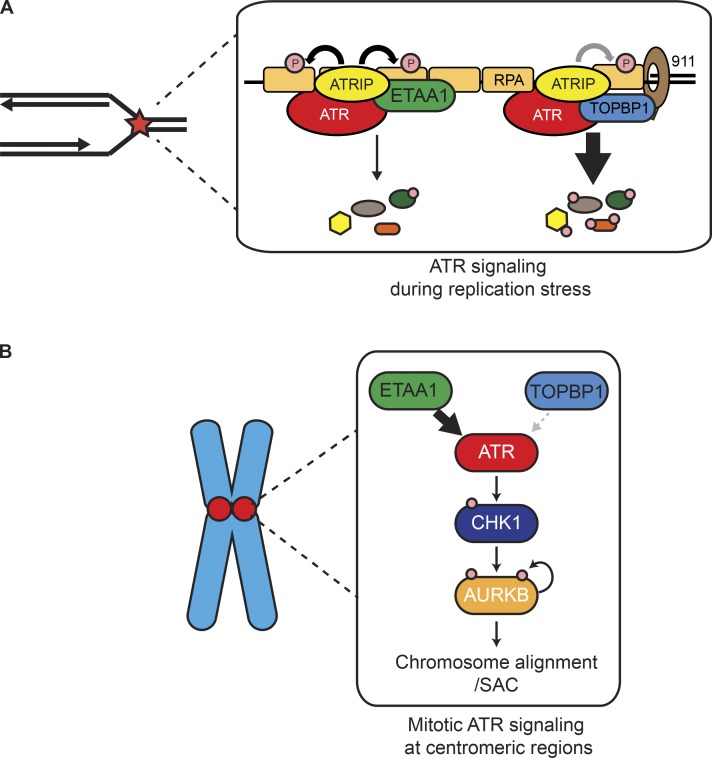
The ATR kinase controls cell cycle transitions and the DNA damage response. ATR activity is regulated through two ATR-activating proteins, ETAA1 and TOPBP1. To examine how each activator contributes to ATR signaling, we used quantitative mass spectrometry to identify changes in protein phosphorylation in ETAA1- or TOPBP1-deficient cells. We identified 724, 285, and 118 phosphosites to be regulated by TOPBP1, ETAA1, or both ATR activators, respectively. Gene ontology analysis of TOPBP1- and ETAA1-dependent phosphoproteins revealed TOPBP1 to be a primary ATR activator for replication stress, while ETAA1 regulates mitotic ATR signaling. Inactivation of ATR or ETAA1, but not TOPBP1, results in decreased Aurora B kinase activity during mitosis. Additionally, ATR activation by ETAA1 is required for proper chromosome alignment during metaphase and for a fully functional spindle assembly checkpoint response. Thus, we conclude that ETAA1 and TOPBP1 regulate distinct aspects of ATR signaling with ETAA1 having a dominant function in mitotic cells.


Figures

Figure 1.
Figure 1.
Production and characterization of ETAA1 and TOPBP1-deficient cell lines. (A) Schematic of the ETAA1ΔAAD gene and protein. (B) HCT116 and HCT116 ETAA1ΔAAD cells were lysed and immunoblotted with ETAA1 antibodies. ETAA1 electrophoretic mobility is altered following CPT treatment. (C) Schematic of the TOPBP1-AID gene and protein. (D) HCT116 WT and TOPBP1-AID cells were treated with 500 µM IAA for the indicated times. Cells were lysed and immunoblotted with the indicated antibodies. Upper band is full-length TOPBP1-AID, and lower band is TOPBP1. (E–H) HCT116 WT, ETAA1ΔAAD, TOPBP1-AID, and ETAA1ΔAAD/TOPBP1-AID cells were left untreated (E and F) or treated (G and H) with 500 µM IAA. Viable cells numbers were measured by staining with trypan blue. Data points and error bars are mean and standard deviation of three experiments. (I) HCT116 WT, ETAA1ΔAAD, TOPBP1-AID, and ETAA1ΔAAD/TOPBP1-AID cells were left untreated or treated with 500 µM IAA for 2 h before examining cell cycle distribution by flow cytometry. Data points and error bars are the mean and standard deviation of three experiments. n.s., not significant. Molecular weight is given in kilodaltons.
Figure 2.
Figure 2.
ATR signaling in ETAA1 and TOPBP1-deficient cell lines. (A) HCT116 (WT), ETAA1ΔAAD, TOPBP1-AID, and ETAA1ΔAAD/TOPBP1-AID cells were treated with DMSO or IAA for 2 or 24 h and γH2AX induction measured by immunofluorescence imaging. Representative images and quantification of two independent experiments are show. Displayed is mean and SEM for each sample with >1,000 cells measured for each condition. Bar, 10 µm. (B) Cells were treated with 100 nM CPT for 4 h following a 2-h pretreatment with IAA or DMSO as indicated, then lysed and immunoblotted with the indicated antibodies. Molecular weight is given in kilodaltons.
Figure 3.
Figure 3.
Quantitative phosphoproteomics identifies ETAA1- and TOPBP1-dependent phosphorylation sites. (A) Schematic of SILAC-phosphoproteomics approach. (B) Scatter plot of phosphoproteomic data. Each point represents a phosphosite, and the x and y value corresponds to the log2 transformed ratios of ETAA1- and TOPBP1-dependent phosphorylation events. Higher ratio values correspond to more phosphorylation in WT cells than in ETAA1ΔAAD or TOPBP1-AID cells. (C and D) Number of phosphosites (C) and phosphoproteins (D) dependent on ETAA1, TOPBP1, or both ATR activators. (E) Diagram of ATR signaling pathway with preferred phosphorylation motifs of ATR and CHK1. (F and G) Abundance of ATR and CHK1 motifs in ETAA1- and TOPBP1-dependent phosphorylation sites.
Figure 4.
Figure 4.
TOPBP1-dependent phosphorylation GO analysis. (A) Functional GO network displaying grouping of GO terms enriched in TOPBP1-dependent phosphoproteins. Phosphoproteins and their corresponding GO terms were assigned functional groups after iterative merging of groups containing 50% of the same proteins. Each node in the network represents a GO term with a P value <0.05. A larger node size corresponds to more significant enrichment. Functional groups are indicated by color and represented in colored text by the most significant term in that group. Nodes with multiple colors belong to multiple groups. (B) Table displaying the 10 most highly enriched GO groups. The first term for each group represents the GO term with the highest significant enrichment. The second term for each group had the highest percentage of associated proteins for that GO group.
Figure 5.
Figure 5.
ETAA1-dependent phosphorylation GO analysis. (A) Functional GO network displaying grouping of GO terms enriched in ETAA1-dependent phosphoproteins. Network parameters are same as described in Fig. 2 A. (B) Table displaying the 10 most highly enriched GO groups. The first term for each group represents the GO term with the highest significant enrichment. The second term for each group had the highest percentage of associated genes for that GO group.
Figure 6.
Figure 6.
ETAA1 regulates phosphoproteins at kinetochores and spindles. (A) Flag-ETAA1 was exogenously expressed in 293T cells, immunopurified, and copurifying proteins were identified by mass spectrometry. Shown are the peptide counts for two experiments with two negative controls and two Flag purifications from parental cells lacking Flag-ETAA1. (B) HCT116 cells with or without stable expression of Flag-ETAA1 were treated with 100 nM taxol for 2 h and fixed, and Flag/BUB1 PLA signals were measured in mitotic and interphase cells. Bar, 5 µm. Quantification is the mean and standard deviation of three independent experiments in which at least 100 cells were analyzed for each condition. Significance was determined by ANOVA with a Dunnett multiple comparison post-test. (C) Diagram depicting the kinetochore- and spindle-associated phosphoproteins and sites detected in the ETAA1-dependent phosphoproteome. Each large gray circle contains the protein name with the smaller surrounding circles containing the observed phosphosites. The inner and outer phosphosite circle colors indicates the quantitative dependency on ETAA1 and TOPBP1, respectively.
Figure 7.
Figure 7.
ETAA1-dependent ATR activation regulates Aurora B kinase activity. (A) Diagram of mitotic ATR signaling to Aurora B (AURKB). (B and C) CHK1 pS317 (B) or Aurora B (C) pT232 levels were measured by imaging of mitotic cells. To avoid induction of replication stress, cells were arrested in G2 by the addition of the CDK1 inhibitor (RO-3306; 10 µM) for 16 h before addition of ATRi or IAA for 2 h and then release into fresh media containing taxol. Cells were fixed 1 h after release. ACAs were used to confirm kinetochore localization of Aurora B. Shown are representative immunofluorescent images and quantification of three independent experiments with at least 100 cells analyzed per condition. Error bars represent standard deviation. (D) pH3 S10 was measured in synchronized U2OS WT, ETAA1-null (ΔETAA1), and ΔETAA1 cells stably complemented with an ETAA1 expression vector. Shown are representative immunofluorescent images and quantification of three independent experiments with at least 100 cells analyzed per condition. Error bars represent standard deviation. Significance for B–D was determined by ANOVA with a Dunnett multiple comparison post-test. Bars: 5 µm (B–D).
Figure 8.
Figure 8.
ETAA1 activation of ATR is required for proper chromosome alignment and a fully functional SAC. (A and B) HCT116 WT, ETAA1ΔAAD, and TOPBP1-AID cells expressing GFP-H2B for chromatin visualization were examined by live cell imaging and scored for defects during mitosis. ATRi or IAA was added 1.5 h before beginning imaging. Representative time-lapse images are shown in A. White arrows indicate anaphase bridges and misaligned or lagging chromosomes. (B) Quantification of mitotic defects from live cell imaging experiments. Total number of cells examined for each cell type from three independent experiments is indicated in parentheses. (C) Representative immunofluorescence images of normal and misaligned chromosomes during metaphase. (D) HCT116 WT, ETAA1ΔAAD, and TOPBP1-AID cells were arrested for 16 h with CDK1i, treated with IAA or ATRi for 2 h, released from CDK1i, and fixed. Metaphase cells were scored for the number of misaligned chromosomes. (E) U2OS WT, ΔETAA1, and ΔETAA1 cells stably expressing ETAA1 were examined for chromosome misalignment as in D. D and E display the mean and standard deviation of three independent experiments in which at least 100 metaphases were examined per condition. (F) Synchronized HCT116 cells expressing H2B-GFP were released from a double thymidine block, and taxol, ATRi, or CHK1i were added 1.5 h before starting imaging. (G) Same as in F, but HCT116 WT and two clones of ETAA1ΔAAD and TOPBP1-AID cells were examined for ability to sustain mitotic arrest during taxol treatment. (F and G) The total number of cells examined for each cell type from three independent experiments is listed in parentheses. Bars: 5 µm (A and C).
Figure 9.
Figure 9.
Models for ATR activation. (A) ATR is primarily activated by TOPBP1 in response to replication stress leading to phosphorylation of hundreds of proteins. ETAA1 contributes to ATR activation in response to replication stress, but regulates a smaller fraction of ATR substrates. (B) ETAA1 activates ATR localized to centromeric regions promoting full Aurora B activity, correct chromosome alignment, and a fully functional SAC.

Comment in

Similar articles

Cited by

References

    1. Bass T.E., Luzwick J.W., Kavanaugh G., Carroll C., Dungrawala H., Glick G.G., Feldkamp M.D., Putney R., Chazin W.J., and Cortez D.. 2016. ETAA1 acts at stalled replication forks to maintain genome integrity. Nat. Cell Biol. 18:1185–1195. 10.1038/ncb3415 - DOI - PMC - PubMed
    1. Bastos de Oliveira F.M., Kim D., Cussiol J.R., Das J., Jeong M.C., Doerfler L., Schmidt K.H., Yu H., and Smolka M.B.. 2015. Phosphoproteomics reveals distinct modes of Mec1/ATR signaling during DNA replication. Mol. Cell. 57:1124–1132. 10.1016/j.molcel.2015.01.043 - DOI - PMC - PubMed
    1. Bindea G., Mlecnik B., Hackl H., Charoentong P., Tosolini M., Kirilovsky A., Fridman W.-H., Pagès F., Trajanoski Z., and Galon J.. 2009. ClueGO: a Cytoscape plug-in to decipher functionally grouped gene ontology and pathway annotation networks. Bioinformatics. 25:1091–1093. 10.1093/bioinformatics/btp101 - DOI - PMC - PubMed
    1. Broderick R., Nieminuszczy J., Blackford A.N., Winczura A., and Niedzwiedz W.. 2015. TOPBP1 recruits TOP2A to ultra-fine anaphase bridges to aid in their resolution. Nat. Commun. 6:6572 10.1038/ncomms7572 - DOI - PMC - PubMed
    1. Cimprich K.A., and Cortez D.. 2008. ATR: an essential regulator of genome integrity. Nat. Rev. Mol. Cell Biol. 9:616–627. 10.1038/nrm2450 - DOI - PMC - PubMed

Publication types

MeSH terms