

An immunoproteomic approach to characterize the CAR interactome and signalosome
- PMID: 30755478
- PMCID: PMC6506216
- DOI: 10.1126/scisignal.aap9777
An immunoproteomic approach to characterize the CAR interactome and signalosome
Abstract
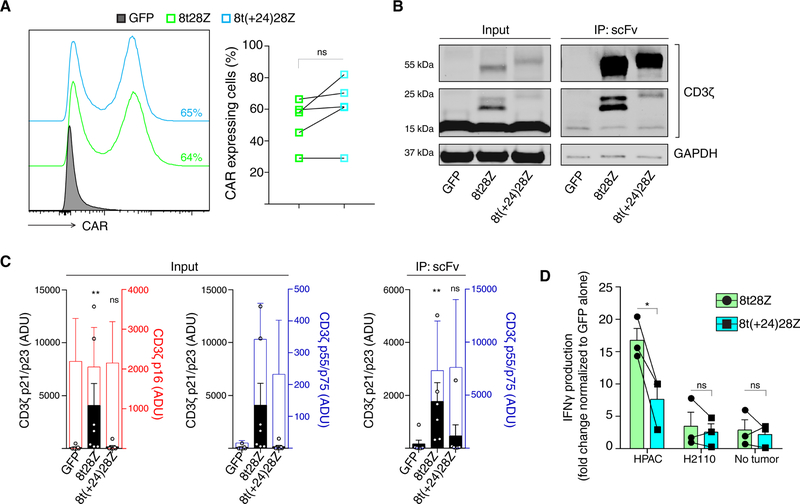
Adoptive transfer of T cells that express a chimeric antigen receptor (CAR) is an approved immunotherapy that may be curative for some hematological cancers. To better understand the therapeutic mechanism of action, we systematically analyzed CAR signaling in human primary T cells by mass spectrometry. When we compared the interactomes and the signaling pathways activated by distinct CAR-T cells that shared the same antigen-binding domain but differed in their intracellular domains and their in vivo antitumor efficacy, we found that only second-generation CARs induced the expression of a constitutively phosphorylated form of CD3ζ that resembled the endogenous species. This phenomenon was independent of the choice of costimulatory domains, or the hinge/transmembrane region. Rather, it was dependent on the size of the intracellular domains. Moreover, the second-generation design was also associated with stronger phosphorylation of downstream secondary messengers, as evidenced by global phosphoproteome analysis. These results suggest that second-generation CARs can activate additional sources of CD3ζ signaling, and this may contribute to more intense signaling and superior antitumor efficacy that they display compared to third-generation CARs. Moreover, our results provide a deeper understanding of how CARs interact physically and/or functionally with endogenous T cell molecules, which will inform the development of novel optimized immune receptors.
Copyright © 2019 The Authors, some rights reserved; exclusive licensee American Association for the Advancement of Science. No claim to original U.S. Government Works.
Conflict of interest statement
Figures


Similar articles
-
Phosphoproteomic analysis of chimeric antigen receptor signaling reveals kinetic and quantitative differences that affect cell function.Sci Signal. 2018 Aug 21;11(544):eaat6753. doi: 10.1126/scisignal.aat6753. Sci Signal. 2018. PMID: 30131370 Free PMC article.
-
Multispecific Targeting with Synthetic Ankyrin Repeat Motif Chimeric Antigen Receptors.Clin Cancer Res. 2019 Dec 15;25(24):7506-7516. doi: 10.1158/1078-0432.CCR-19-1479. Epub 2019 Sep 23. Clin Cancer Res. 2019. PMID: 31548346 Free PMC article.
-
Chimeric Antigen Receptor Designed to Prevent Ubiquitination and Downregulation Showed Durable Antitumor Efficacy.Immunity. 2020 Aug 18;53(2):456-470.e6. doi: 10.1016/j.immuni.2020.07.011. Epub 2020 Aug 5. Immunity. 2020. PMID: 32758419
-
Chimeric antigen-receptor T-cell therapy for hematological malignancies and solid tumors: Clinical data to date, current limitations and perspectives.Curr Res Transl Med. 2017 Sep;65(3):93-102. doi: 10.1016/j.retram.2017.08.003. Curr Res Transl Med. 2017. PMID: 28988742 Review.
-
Paving New Roads for CARs.Trends Cancer. 2019 Oct;5(10):583-592. doi: 10.1016/j.trecan.2019.09.005. Epub 2019 Oct 19. Trends Cancer. 2019. PMID: 31706506 Review.
Cited by
-
Engineering a Programmed Death-Ligand 1-Targeting Monobody Via Directed Evolution for SynNotch-Gated Cell Therapy.ACS Nano. 2024 Mar 19;18(11):8531-8545. doi: 10.1021/acsnano.4c01597. Epub 2024 Mar 8. ACS Nano. 2024. PMID: 38456901 Free PMC article.
-
How the Discovery of the CD4/CD8-p56lck Complexes Changed Immunology and Immunotherapy.Front Cell Dev Biol. 2021 Mar 15;9:626095. doi: 10.3389/fcell.2021.626095. eCollection 2021. Front Cell Dev Biol. 2021. PMID: 33791292 Free PMC article. Review.
-
TRAIL-R1-Targeted CAR-T Cells Exhibit Dual Antitumor Efficacy.Front Mol Biosci. 2021 Dec 20;8:756599. doi: 10.3389/fmolb.2021.756599. eCollection 2021. Front Mol Biosci. 2021. PMID: 34988114 Free PMC article.
-
SILAC Phosphoproteomics Reveals Unique Signaling Circuits in CAR-T Cells and the Inhibition of B Cell-Activating Phosphorylation in Target Cells.J Proteome Res. 2022 Feb 4;21(2):395-409. doi: 10.1021/acs.jproteome.1c00735. Epub 2022 Jan 11. J Proteome Res. 2022. PMID: 35014847 Free PMC article.
-
γδ-Enriched CAR-T cell therapy for bone metastatic castrate-resistant prostate cancer.Sci Adv. 2023 May 3;9(18):eadf0108. doi: 10.1126/sciadv.adf0108. Epub 2023 May 3. Sci Adv. 2023. PMID: 37134157 Free PMC article.
References
-
- Brown CE, Alizadeh D, Starr R, Weng L, Wagner JR, Naranjo A, Ostberg JR, Blanchard MS, Kilpatrick J, Simpson J, Kurien A, Priceman SJ, Wang X, Harshbarger TL, D’Apuzzo M, Ressler JA, Jensen MC, Barish ME, Chen M, Portnow J, Forman SJ, Badie B, Regression of Glioblastoma after Chimeric Antigen Receptor T-Cell Therapy. N Engl J Med 375, 2561–2569 (2016). - PMC - PubMed
-
- Gross G, Gorochov G, Waks T, Eshhar Z, Generation of effector T cells expressing chimeric T cell receptor with antibody type-specificity. Transplant Proc 21, 127–130 (1989). - PubMed
-
- Finney HM, Lawson AD, Bebbington CR, Weir AN, Chimeric receptors providing both primary and costimulatory signaling in T cells from a single gene product. J Immunol 161, 2791–2797 (1998). - PubMed
Publication types
MeSH terms
Substances
Grants and funding
LinkOut - more resources
Full Text Sources
Other Literature Sources
Molecular Biology Databases
