. 2019 Apr 24;39(17):3217-3233.
doi: 10.1523/JNEUROSCI.2335-18.2019. Epub 2019 Feb 12.

Perturbation of Macaque Supplementary Motor Area Produces Context-Independent Changes in the Probability of Movement Initiation

Affiliations

Perturbation of Macaque Supplementary Motor Area Produces Context-Independent Changes in the Probability of Movement Initiation

Andrew J Zimnik et al. J Neurosci. .

Abstract

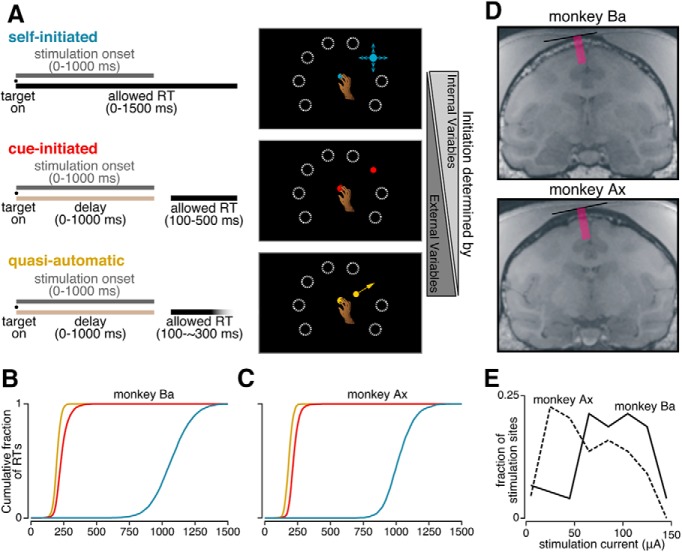
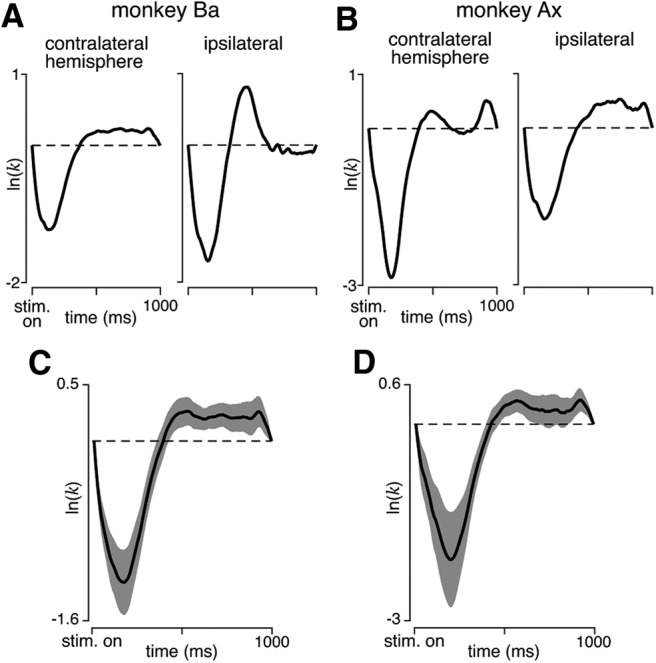
The contribution of the supplementary motor area (SMA) to movement initiation remains unclear. SMA exhibits premovement activity across a variety of contexts, including externally cued and self-initiated movements. Yet SMA lesions impair initiation primarily for self-initiated movements. Does SMA influence initiation across contexts or does it play a more specialized role, perhaps contributing only when initiation is less dependent on external cues? To address this question, we perturbed SMA activity via microstimulation at variable times before movement onset. Experiments used two adult male rhesus monkeys trained on a reaching task. We used three contexts that differed regarding how tightly movement initiation was linked to external cues. Movement kinematics were not altered by microstimulation. Instead, microstimulation induced a variety of changes in the timing of movement initiation, with different effects dominating for different contexts. Despite their diversity, these changes could be explained by a simple model where microstimulation has a stereotyped impact on the probability of initiation. Surprisingly, a unified model accounted for effects across all three contexts, regardless of whether initiation was determined more by external cues versus internal considerations. All effects were present for stimulation both contralateral and ipsilateral to the moving arm. Thus, the probability of initiating a pending movement is altered by perturbation of SMA activity. However, changes in initiation probability are independent of the balance of internal and external factors that establish the baseline initiation probability.SIGNIFICANCE STATEMENT The role of the supplementary motor area (SMA) in initiating movement remains unclear. Lesion experiments suggest that SMA makes a critical contribution only for self-initiated movements. Yet SMA is active before movements made under a range of contexts, suggesting a less-specialized role in movement initiation. Here, we use microstimulation to probe the role of SMA across a range of behavioral contexts that vary in the degree to which movement onset is influenced by external cues. We demonstrate that microstimulation produces a temporally stereotyped change in the probability of initiation that is independent of context. These results argue that SMA participates in the computations that lead to movement initiation and does so across a variety of contexts.

Keywords: macaque; microstimulation; reaching; supplementary motor area.


Figures

Figure 1.
Figure 1.
Overview of task and stimulation. A, Overview of the three task contexts. Each context required the monkey to complete a reach from a central position to one of eight targets, arranged radially as shown at right. In the self-initiated context, the target was blue and grew steadily with time. In the cue-initiated context, the target was red and remained small until enlarging suddenly, which provided the go cue. In the quasi-automatic context, the target was yellow and the go cue was the onset of target motion. Left, Timing of key events. Gray bars represent times when stimulation could begin. Tan bars represent a variable-duration delay period, present only for the cue-initiated and quasi-automatic contexts. Black bars represent times when movement initiation was allowed. For the self-initiated context, initiation was allowed anytime from target onset until 300 ms after the target stopped growing at 1200 ms. Thus, visual cues placed only broad constraints on when movement should be initiated. The more important determinant was available reward, which grew as the target grew. For the cue-initiated context, initiation was allowed only from 100 to 500 following the go cue (RTs < 100 ms were disallowed to discourage attempts to anticipate the go cue). These requirements were the same for the quasi-automatic context, although in practice capturing the target mid-flight typically necessitated RTs < ∼300 ms. B, C, Cumulative RT distributions for the three contexts in the absence of stimulation. Blue represents self-initiated. Red represents cue-initiated. Yellow represents quasi-automatic. D, Targeted region of SMA for the left (contralateral) hemisphere. Most stimulation sites lay within the medial wall. E, Distribution of stimulation currents used during experiments.
Figure 2.
Figure 2.
Microstimulation produces complex changes in RT, but not reach kinematics. A, B, Cumulative RT distributions for trials with no stimulation (dashed gray traces), early stimulation (light colored traces), and late stimulation (dark colored traces). C, D, Summary of the above effects in terms of changes in mean RT. Error bars indicate SEs. The mean ± SE were computed across trials. For all comparisons, the RT of nonstimulated trials was computed using only trials where the delay period length and RT would have allowed stimulation to be delivered. This eliminates potential biases; for example, late stimulation might otherwise appear to increase RT simply because late stimulation implies that movement has not yet been initiated. E, F, Mean speed profiles for reaches to one representative target (target located rightward of central position) for the three contexts. Dashed gray represents no stimulation. Light colored traces represent early stimulation. Dark colored traces represent late stimulation. G, Movement kinematics for trials with no, early, and late stimulation. Symbols plot mean values. Error bars indicate SEs, computed across conditions. Initial reach direction was measured relative to target direction. Endpoint variability was measured as the SD of reach endpoint within each condition.
Figure 3.
Figure 3.
Framework relating the underlying neural state to behavioral measures of movement initiation. The underlying neural state evolves over time (purple box). At each time, there is a probability of initiation, P0 (yellow box), produced by that underlying state. (More generally, at a particular time, there is a distribution of possible neural states which determine P0 at that time.) The values of P0 are not directly observed on a single trial. Rather, one observes multiple time points where initiation does not occur (0 in green box) and then a time when initiation does occur (1 in green box). These observations are summarized as the RT: the time from when movement was first allowed until it was initiated. Across many trials, one can compute the mean RT, which then becomes a summary of the tendency to initiate. However, a more direct summary can be produced by estimating P0 for each time where sufficient data are available.
Figure 4.
Figure 4.
Impact of microstimulation on initiation probability for Monkey Ba. A, Heat-plots of P0 (top) and Pstim (bottom) for the self-initiated context. Time is plotted relative to target onset. For Pstim(t,ts), each row plots the probability of initiation, as a function of time since target onset, for a particular time of stimulation. White line indicates the onset of microstimulation for each row. Gray and black contour lines indicate P = 0.25 and P = 0.65, respectively. B, ΔPstim for the self-initiated context. C, D, P0, Pstim, and ΔPstim for the cue-initiated context. Time is plotted relative to the go cue. E, F, P0, Pstim, and ΔPstim for the quasi-automatic context. Time is plotted relative to the go cue.
Figure 5.
Figure 5.
A–F, Impact of microstimulation on initiation probability for Monkey Ax. Same format as in Figure 3.
Figure 6.
Figure 6.
A single, multiplicative kernel predicts Pstim for early, middle, and late stimulation in the self-initiated context. A, Data and predictions for stimulation delivered starting 220 ms after target onset. Gray trace represents P0(t), the baseline probability of initiation without stimulation, for all values of t. Black trace represents Pstim(t,220): the probability of initiation following stimulation starting 220 ms after target onset. Dashed orange trace represents stim(t,220), the predicted effect of stimulation at that time. This prediction is based on the kernel, k, plotted at top (orange trace) aligned to stimulation onset. The log of the kernel is shown, such that a doubling and halving of odds are plotted equidistant from 0, which indicates no change in odds. B, Similar plot for stimulation starting 570 ms after target onset. The kernel is thus shifted to begin at 570 ms. C, Similar plot for stimulation starting 740 ms after target onset.
Figure 7.
Figure 7.
Model predictions of ΔPstim for Monkey Ba. A, Context-specific kernels, found when fitting to each context separately: self-initiated (blue), cue-initiated (red), and quasi-automatic (yellow). As in Figure 6, the log of the kernel is plotted. Dashed line at 0 thus indicates no change in initiation odds. B, Unified kernel, found when fitting to all contexts simultaneously. Shaded region represents 95% CIs of kernels fit to dummy stimulation data (see Materials and Methods). C, Empirical (left) and predicted changes in the probability of initiation following stimulation in the self-initiated context. Predictions in the middle heat plot are based on the context-specific kernel (A, yellow kernel). Predictions in the right heat plot are based on the unified kernel (B, black kernel). Prediction performance is quantified at right. A rough benchmark on the fit performance that could be provided by a good model was estimated via bootstrap. Horizontal line and shaded region represent mean and 95% CIs of that estimate. D, Same as for C, but for the cue-initiated context. E, Same as for C, but for the quasi-automatic context.
Figure 8.
Figure 8.
A–E, Model predictions of ΔPstim for Monkey Ax. Same format as in Figure 7.
Figure 9.
Figure 9.
Predicting ΔRT from stim. Predicted ΔRT following early or late stimulation. Predictions were made using the unified kernel (found by fitting simultaneously to all contexts). To mirror the analysis in Figure 2, the values of ts used to predict the effect of early and late stimulation were 700 and 300 ms, respectively, before the reference time: the time when movement had begun on 10% of nonstimulated trials in that context. Because of the 150 ms window used when originally estimating ΔPstim, this effectively produced stimulation windows of 700–550 ms and 300–150 ms before the reference time, matching the windows used in the original analysis.
Figure 10.
Figure 10.
Movement-enhancing effects of microstimulation are strongest when a site is first stimulated. A–D, Results for Monkey Ba. E–H, Results for Monkey Ax. Kernels were the “unified” kernel fit to all contexts simultaneously. A, Stimulation kernel fit to first 25 stimulation trials at each site (black line) and all stimulation trials (gray line). B, Empirical (left) and predicted (right) changes in the probability of initiation following stimulation in the self-initiated context, after restricting to the first 25 stimulation trials at each site. C, Same as for B, but for the cue-initiated context. D, Same as for B, but for the quasi-automatic context. E–H, Same as for A–D, but for Monkey Ax.
Figure 11.
Figure 11.
Analysis of potential heterogeneity of effects across sites. A, Stimulation kernels for stimulation sites in contralateral (left subpanel) and ipsilateral (right subpanel) SMA. Kernels were the “unified” kernel fit to all contexts simultaneously. Data are for Monkey Ba. B, Same as for A, but for Monkey Ax. C, Reliability of stimulation kernel estimated by resampling stimulation sites. Black trace represents the original stimulation kernel. Gray region represents the 95% CI across resamplings. Data are for Monkey Ba. D, Same as for C, but for Monkey Ax.
Figure 12.
Figure 12.
Schematic illustration of how the impact of stimulation may depend primarily on the proportion of neural states near a movement-initiating region. A, Possible distribution of neural states in one context. Gray region represents a “movement-initiating region” where activity becomes strongly movement-promoting. Light blue represents a baseline (without stimulation) distribution. A possible movement-promoting impact of stimulation, moving the distribution slightly rightward, is illustrated (dark blue). B, Possible distribution of neural states in another context. Although the baseline distribution differs from than in A, there are a similar proportion of states near the movement-initiating region. Thus, the number of trials where the state is “poised” to initiate movement is similar, yielding a similar probability of initiating in the near future. Because the impact of microstimulation is a small rightward shift, the proportion of states shifted into the movement-initiating region is also similar to that in A. C, Similar conception but extended to multiple dimensions. Activity is strongly context-dependent. Purple and orange distributions of neural states represent two contexts. Yet the proportion of states shifted into the movement-initiating region is similar in the two contexts.

Similar articles

Cited by

References

    1. Boccardi E, Della Sala S, Motto C, Spinnler H (2002) Utilisation behaviour consequent to bilateral SMA softening. Cortex 38:289–308. 10.1016/S0010-9452(08)70661-0 - DOI - PubMed
    1. Cadena-Valencia J, García-Garibay O, Merchant H, Jazayeri M, de Lafuente V (2018) Entrainment and maintenance of an internal metronome in supplementary motor area. Elife 7:e38983. 10.7554/eLife.38983 - DOI - PMC - PubMed
    1. Carlsen AN, Chua R, Inglis JT, Sanderson DJ, Franks IM (2004) Can prepared responses be stored subcortically? Exp Brain Res 159:301–309. 10.1007/s00221-004-1924-z - DOI - PubMed
    1. Carlsen AN, Eagles JS, MacKinnon CD (2015) Transcranial direct current stimulation over the supplementary motor area modulates the preparatory activation level in the human motor system. Behav Brain Res 279:68–75. 10.1016/j.bbr.2014.11.009 - DOI - PMC - PubMed
    1. Chen X, Scangos KW, Stuphorn V (2010) Supplementary motor area exerts proactive and reactive control of arm movements. J Neurosci 30:14657–14675. 10.1523/JNEUROSCI.2669-10.2010 - DOI - PMC - PubMed

Publication types

LinkOut - more resources