. 2019 Feb 12;10(1):e02323-18.
doi: 10.1128/mBio.02323-18.

Repression of Human Papillomavirus Oncogene Expression under Hypoxia Is Mediated by PI3K/mTORC2/AKT Signaling

Affiliations

Repression of Human Papillomavirus Oncogene Expression under Hypoxia Is Mediated by PI3K/mTORC2/AKT Signaling

Felicitas Bossler et al. mBio. .

Abstract

Hypoxia is linked to therapeutic resistance and poor clinical prognosis for many tumor entities, including human papillomavirus (HPV)-positive cancers. Notably, HPV-positive cancer cells can induce a dormant state under hypoxia, characterized by a reversible growth arrest and strong repression of viral E6/E7 oncogene expression, which could contribute to therapy resistance, immune evasion and tumor recurrence. The present work aimed to gain mechanistic insights into the pathway(s) underlying HPV oncogene repression under hypoxia. We show that E6/E7 downregulation is mediated by hypoxia-induced stimulation of AKT signaling. Ablating AKT function in hypoxic HPV-positive cancer cells by using chemical inhibitors efficiently counteracts E6/E7 repression. Isoform-specific activation or downregulation of AKT1 and AKT2 reveals that both AKT isoforms contribute to hypoxic E6/E7 repression and act in a functionally redundant manner. Hypoxic AKT activation and consecutive E6/E7 repression is dependent on the activities of the canonical upstream AKT regulators phosphoinositide 3-kinase (PI3K) and mechanistic target of rapamycin (mTOR) complex 2 (mTORC2). Hypoxic downregulation of E6/E7 occurs, at least in part, at the transcriptional level. Modulation of E6/E7 expression by the PI3K/mTORC2/AKT cascade is hypoxia specific and not observed in normoxic HPV-positive cancer cells. Quantitative proteome analyses identify additional factors as candidates to be involved in hypoxia-induced activation of the PI3K/mTORC2/AKT signaling cascade and in the AKT-dependent repression of the E6/E7 oncogenes under hypoxia. Collectively, these data uncover a functional key role of the PI3K/mTORC2/AKT signaling cascade for viral oncogene repression in hypoxic HPV-positive cancer cells and provide new insights into the poorly understood cross talk between oncogenic HPVs and their host cells under hypoxia.IMPORTANCE Oncogenic HPV types are major human carcinogens. Under hypoxia, HPV-positive cancer cells can repress the viral E6/E7 oncogenes and induce a reversible growth arrest. This response could contribute to therapy resistance, immune evasion, and tumor recurrence upon reoxygenation. Here, we uncover evidence that HPV oncogene repression is mediated by hypoxia-induced activation of canonical PI3K/mTORC2/AKT signaling. AKT-dependent downregulation of E6/E7 is only observed under hypoxia and occurs, at least in part, at the transcriptional level. Quantitative proteome analyses identify additional factors as candidates to be involved in AKT-dependent E6/E7 repression and/or hypoxic PI3K/mTORC2/AKT activation. These results connect PI3K/mTORC2/AKT signaling with HPV oncogene regulation, providing new mechanistic insights into the cross talk between oncogenic HPVs and their host cells.

Keywords: AKT; cervical cancer; human papillomavirus; tumor virus.


Figures

FIG 1
FIG 1
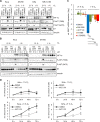
Hypoxia-induced AKT phosphorylation precedes and correlates with E6/E7 repression in a glucose-sensitive manner. (A) Time-course of hypoxia-induced AKT phosphorylation and E6/E7 repression. HeLa and SiHa cells were cultured for the indicated time periods under hypoxia, and protein expression of HIF-1α (hypoxia-linked marker), phosphorylated AKT (P-AKT T308 and P-AKT S473), pan-AKT (AKT), HPV16/-18 E6, and HPV16/-18 E7 was analyzed by immunoblotting (note that the phospho-AKT-specific antibodies recognize all three AKT isoforms, AKT1 to -3, when phosphorylated at corresponding sites, but for simplification, only the phosphorylation sites of AKT1 are indicated throughout the text). Vinculin, loading control. (B) Immunoblot analyses of HeLa, SW756, and SiHa cells cultured for 24 h under normoxia (21% O2) or hypoxia (1% O2) in medium containing 5.5 mM or 25 mM glucose. β-Actin, loading control.
FIG 2
FIG 2
Inhibition of hypoxia-induced AKT phosphorylation counteracts E6/E7 repression. (A) HPV-positive HeLa, SW756, SiHa, and MRI-H-186 cervical cancer cells were treated with 10 µM AKTi VIII, 20 µM LY294002, or solvent control (DMSO) and incubated at the indicated O2 concentrations for 24 h. Immunoblot analyses of HIF-1α, phosphorylated AKT (P-AKT T308 and P-AKT S473), and HPV16/-18 E7 are shown. Vinculin, loading control. (B) HeLa and SW756 cells were treated with increasing concentrations of MK-2206 and PX-866 for 24 h and analyzed by immunoblotting. (C) qRT-PCR analyses of HPV18 E6/E7 mRNA levels in HeLa cells treated with 3 µM MK-2206, 10 µM AKTi VIII, 3 µM PX-866, or 20 µM LY294002 for 24 h. Data shown are the mean expression levels under hypoxia relative to the expression levels in solvent (DMSO)-treated control cells under normoxia (log2). Standard deviations are depicted (n = 3). Asterisks indicate statistically significant differences as determined by one-way ANOVA (***, P < 0.001). (D) HeLa and SiHa cells were treated with 10 µM AKTi VIII and grown for the indicated time periods under hypoxia (top) or normoxia (bottom). Cell numbers relative to the time point 0 h after treatment were determined by quantitative crystal violet staining. Depicted are the mean values with standard deviations from 3 individual experiments.
FIG 3
FIG 3
mTORC2 activity is required for repression of E6/E7 under hypoxia. (A) HeLa cells were treated with the indicated concentrations of rapamycin or KU-0063794, incubated for 1 h, and then cultured for an additional 23 h at the indicated O2 concentrations. The levels of HIF-1α, P-AKT T308, P-AKT S473, P-4E-BP1, 4E-BP1, P-S6, P-p70S6K, p70S6K, and HPV18 E7 were determined by immunoblotting. Vinculin, loading control. (B) Concomitant qRT-PCR analyses of HPV18 E6/E7 mRNA levels in HeLa cells treated as described in the legend to panel A. Data shown are the mean expression levels relative to the expression levels in solvent (DMSO)-treated control cells under normoxia (log2). Standard deviations are depicted (n = 3). Asterisks indicate statistically significant differences as determined by one-way ANOVA (**, P < 0.01; ***, P < 0.001; ns, not significant). (C) Rictor expression was silenced in HeLa cells using CRISPR-Cas9 (Rictor gRNA1), and the cells cultured for 24 h at the indicated O2 concentrations. Control cells were transfected with the empty vector (vector ctrl). Immunoblot analyses show expression of HIF-1α, P-AKT T308, P-AKT S473, Rictor, P-S6, and HPV18 E6 and E7. β-Actin, loading control.
FIG 4
FIG 4
Repression of E6/E7 expression under hypoxia is mediated by AKT1 and AKT2. (A) HeLa cells transfected with control vector (pLNCX1) or expression vectors for constitutively active AKT1 and AKT2 (myrAKT1 and myrAKT2), alone or in combination, were treated with the indicated concentrations of AKTi VIII and cultured for 24 h at 21% or 1% O2. Immunoblot analyses of HIF-1α, P-AKT T308, P-GSK3-α/β, and HPV18 E6 and E7 are shown. Vinculin, β-actin, loading controls. (B) HeLa AKT1 knockdown single-cell clones (AKT1 gRNA1 and AKT1 gRNA4) of HeLa cells or controls containing the empty gRNA expression vector LentiCRISPRv1 (vector ctrl.) were transfected with siRNAs targeting AKT2 and cultured for 24 h at the indicated O2 concentrations. Protein expression of HIF-1α, P-AKT T308, P-AKT S473, pan-AKT (AKT), AKT2, and HPV18 E7 were analyzed by immunoblotting. β-Actin, loading control.
FIG 5
FIG 5
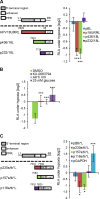
Regulation of E6/E7 transcription under hypoxia. (A) Top left, schematic presentation of the 825-bp HPV18 URR with the central 230-bp enhancer and the promoter proximal region (PPR) containing the E6/E7 promoter at the 3′ terminus (45). Bottom left, luciferase reporter constructs containing the firefly luciferase gene under the control of the complete HPV18 URR (p18URRL) or deletion constructs thereof (p436/18L and p232/18L). Nucleotide positions are according to reference . pBL, basic luciferase plasmid (45). Right, luciferase reporter constructs were analyzed in HeLa cells cultured for 24 h under hypoxia or normoxia. Shown are the relative luciferase activities (RLA) of the individual reporter plasmids under hypoxia compared to the RLA under normoxia (log2). Standard deviations are depicted (n = 4). Asterisks above bars show statistically significant differences from the results for pBL as determined by one-way ANOVA (***, P < 0.001). (B) Effects of 1 µM KU-00637794, 10 µM AKTi VIII, and 25 mM glucose on the hypoxic repression of p436/18L. Shown are the RLA under hypoxia compared to the RLA of solvent (DMSO)-treated control cells under normoxia (log2). Standard deviations are depicted (n = 5). Asterisks above columns show statistically significant differences compared to the results for DMSO-treated cells as determined by one-way ANOVA (***, P < 0.001). (C) Reporter assays (n = 5) of the HPV18 enhancer (p230s/tk*L) or deletion constructs thereof (p157s/tk*L and p116s/tk*L) upstream from the HSV TK promoter. pBtk*L, control vector devoid of HPV enhancer sequences (45). Shown are the RLA of the individual reporter plasmids under hypoxia compared to the RLA under normoxia (log2). Asterisks above columns show statistically significant differences compared to the results for pBtk*L as determined by one-way ANOVA (*, P < 0.05; ***, P < 0.001). pGAPDH, positive control.
FIG 6
FIG 6
Proteome analyses of proteins differentially expressed under normoxia and hypoxia. TMT-mass spectrometry analyses of SiHa cells cultured under normoxia and hypoxia and under hypoxia in the presence of 10 µM AKTi VIII or 25 mM glucose. (A) Schematic illustration of the four treatment conditions (conditions 1 to 4) and the corresponding regulation of E6/E7 expression. (B) Accompanying immunoblot showing protein expression of HIF-1α, P-AKT T308, and HPV16 E7 under the four treatment conditions (numbered as in panel A) used for proteome analyses. β-Actin, loading control. (C) Heat map (hierarchical clustering) depicting relative protein expression levels (log2 fold change), filtered for differentially expressed proteins (FDR < 0.05) under hypoxia (condition 2) compared to normoxia (condition 1) with a log2 fold change of ≥+1 or ≤−1. Upregulation is shown in red, downregulation in blue (see color scheme at the lower left). The left three columns reflect protein expression under the three different hypoxic conditions analyzed (untreated [condition 2] or in the presence of AKTi VIII [condition 3] or 25 mM glucose [condition 4]), relative to untreated control cells under normoxia (condition 1). The right two columns show comparisons of hypoxic cells treated with AKTi VIII (condition 3) or high glucose (condition 4) relative to untreated hypoxic cells (condition 2).
FIG 7
FIG 7
Cross talk between oncogenic HPVs and the PI3K/mTOR/AKT signaling cascade. Top, normoxia. Top right, experimental repression of E6/E7 (e.g., by RNA interference [RNAi] or by the viral transrepressor E2) leads to rapid senescence of HPV-positive cancer cells (8–10). The efficiency of senescence induction is dependent on intact mTORC1 signaling (11). HIF-1α is unstable under normoxia. Top left, canonical PI3K/mTORC2/AKT signaling. PI3K via PDK1 (phosphoinositide dependent kinase-1) and mTORC2 activates AKT signaling through mediating the phosphorylation of AKT1 at amino acids T308 and S473 (and of T309 and S474 for AKT2) (15). Bottom, hypoxia. Bottom right, HIF-1α is stabilized and stimulates mTORC1-inhibitory REDD1 expression (77). The resulting interference with mTORC1 signaling leads to impaired senescence (11). Bottom left, E6/E7 repression in hypoxic HPV-positive cancer cells depends on the hypoxia-induced increase of AKT1 and AKT2 phosphorylation. This regulation requires the function of the canonical upstream AKT activators PI3K and mTORC2.

Similar articles

Cited by

References

    1. Zur Hausen H. 2002. Papillomaviruses and cancer: from basic studies to clinical application. Nat Rev Cancer 2:342–350. doi:10.1038/nrc798. - DOI - PubMed
    1. de Martel C, Plummer M, Vignat J, Franceschi S. 2017. Worldwide burden of cancer attributable to HPV by site, country and HPV type. Int J Cancer 141:664–670. doi:10.1002/ijc.30716. - DOI - PMC - PubMed
    1. Schiller J, Lowy D. 2018. Explanations for the high potency of HPV prophylactic vaccines. Vaccine 36:4768–4773. doi:10.1016/j.vaccine.2017.12.079. - DOI - PMC - PubMed
    1. Hellner K, Munger K. 2011. Human papillomaviruses as therapeutic targets in human cancer. J Clin Oncol 29:1785–1794. doi:10.1200/JCO.2010.28.2186. - DOI - PMC - PubMed
    1. Hoppe-Seyler K, Bossler F, Braun JA, Herrmann AL, Hoppe-Seyler F. 2018. The HPV E6/E7 oncogenes: key factors for viral carcinogenesis and therapeutic targets. Trends Microbiol 26:158–168. doi:10.1016/j.tim.2017.07.007. - DOI - PubMed

Publication types

MeSH terms

Substances

LinkOut - more resources