. 2019 Feb 12;10(1):e02856-18.
doi: 10.1128/mBio.02856-18.

Herpes Simplex Virus 1 Lytic Infection Blocks MicroRNA (miRNA) Biogenesis at the Stage of Nuclear Export of Pre-miRNAs

Affiliations

Herpes Simplex Virus 1 Lytic Infection Blocks MicroRNA (miRNA) Biogenesis at the Stage of Nuclear Export of Pre-miRNAs

Dongli Pan et al. mBio. .

Abstract

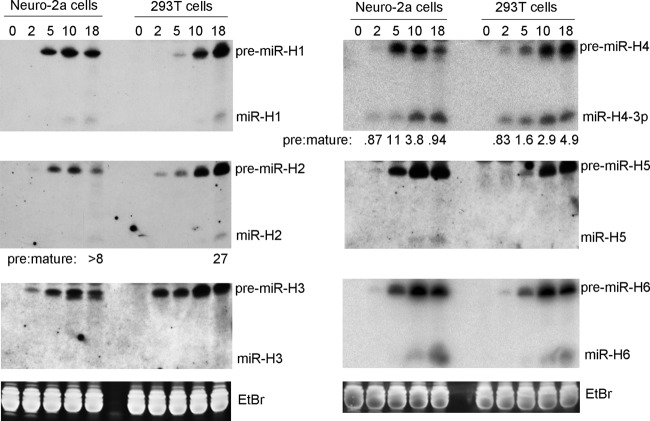
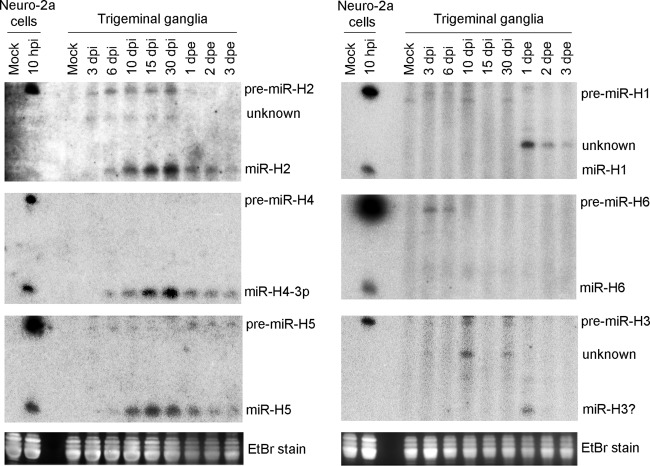
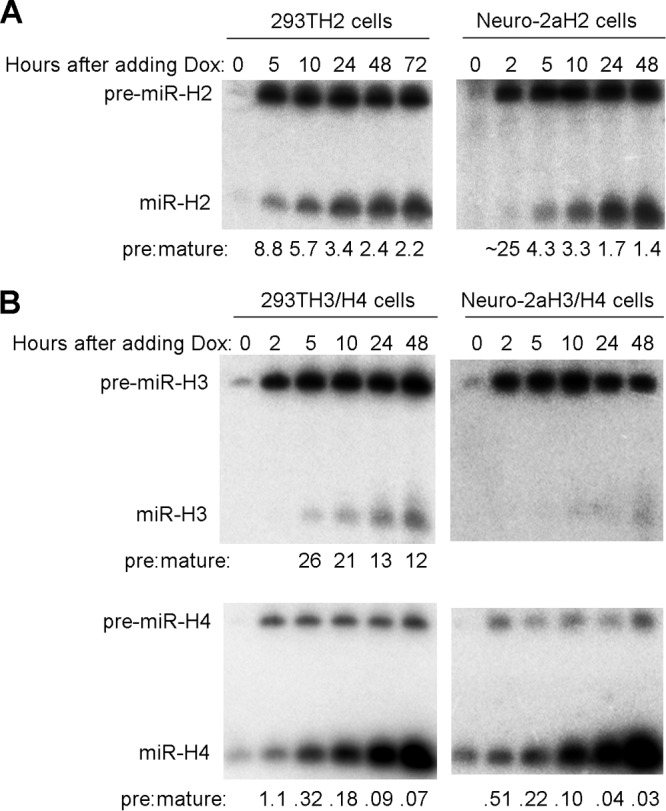
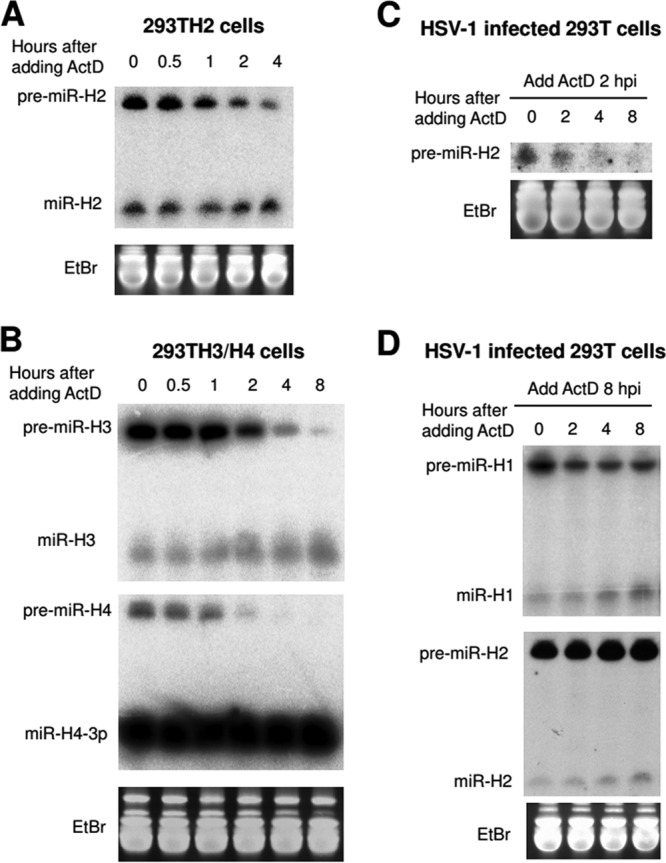
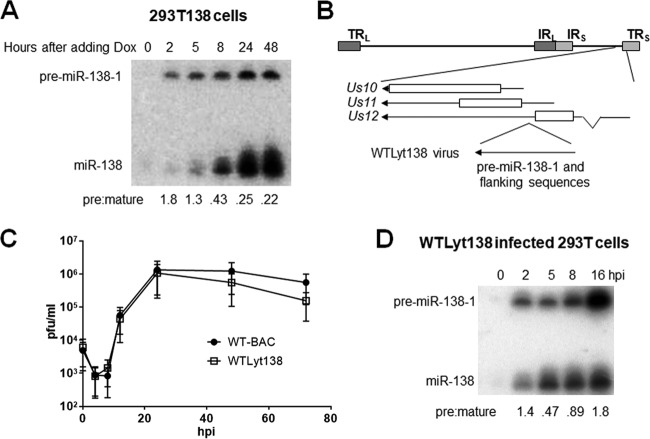
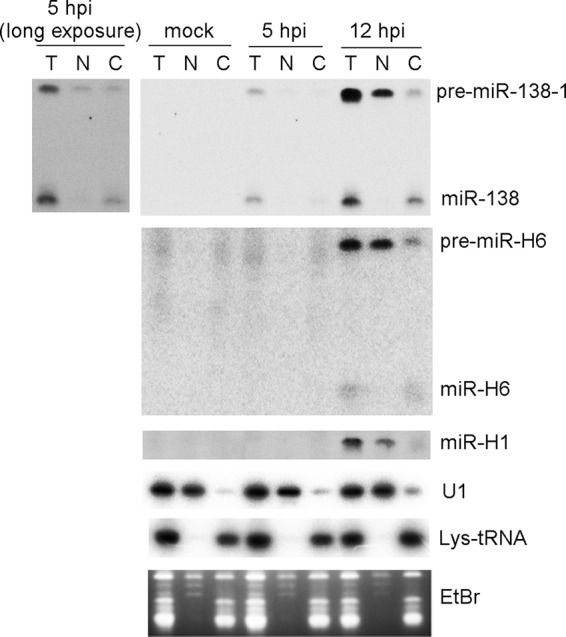
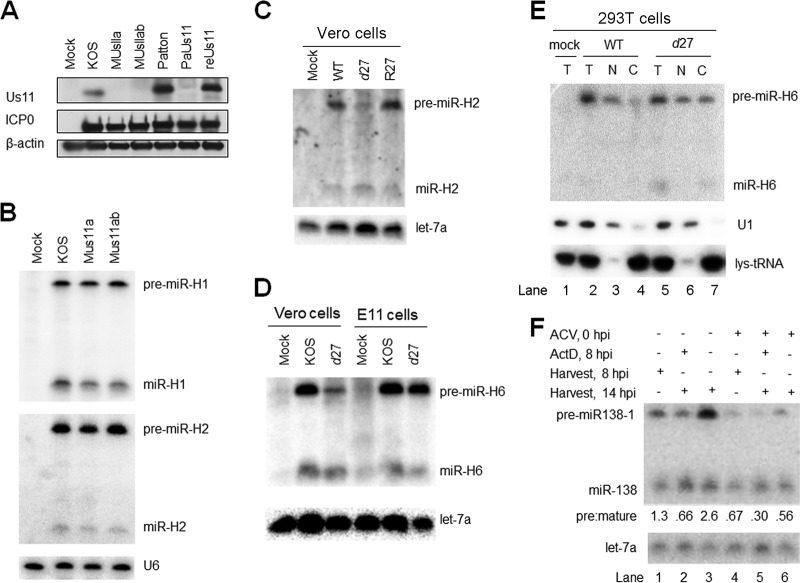
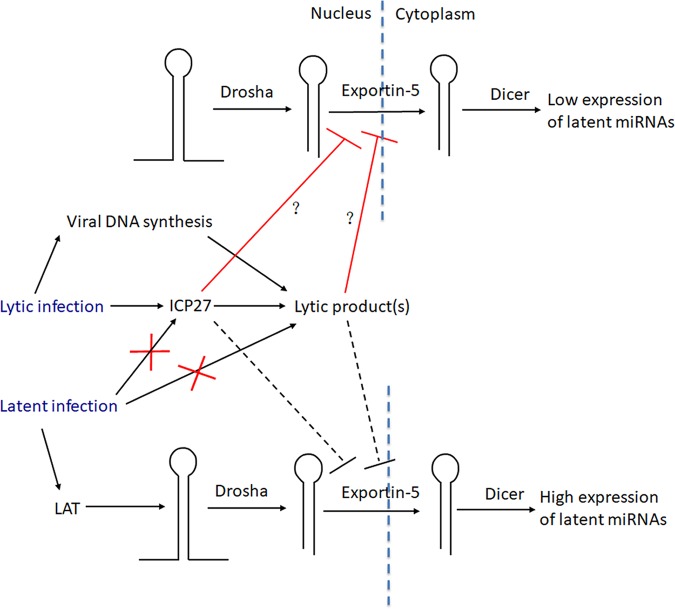
Herpes simplex virus 1 (HSV-1) switches between two infection programs, productive ("lytic") and latent infection. Some HSV-1 microRNAs (miRNAs) have been hypothesized to help control this switch, and yet little is known about regulation of their expression. Using Northern blot analyses, we found that, despite inherent differences in biogenesis efficiency among six HSV-1 miRNAs, all six exhibited high pre-miRNA/miRNA ratios during lytic infection of different cell lines and, when detectable, in acutely infected mouse trigeminal ganglia. In contrast, considerably lower ratios were observed in latently infected ganglia and in cells transduced with lentiviral vectors expressing the miRNAs, suggesting that HSV-1 lytic infection blocks miRNA biogenesis. This phenomenon is not specific to viral miRNAs, as a host miRNA expressed from recombinant HSV-1 also exhibited high pre-miRNA/miRNA ratios late during lytic infection. The levels of most of the mature miRNAs remained stable during infection in the presence of actinomycin D, indicating that the high ratios are due to inefficient pre-miRNA conversion to miRNA. Cellular fractionation experiments showed that late (but not early) during infection, pre-miRNAs were enriched in the nucleus and depleted in the cytoplasm, indicating that nuclear export was blocked. A mutation eliminating ICP27 expression or addition of acyclovir reduced pre-miRNA/miRNA ratios, but mutations drastically reducing Us11 expression did not. Thus, HSV-1 lytic infection inhibits miRNA biogenesis at the step of nuclear export and does so in an ICP27- and viral DNA synthesis-dependent manner. This mechanism may benefit the virus by reducing expression of repressive miRNAs during lytic infection while permitting elevated expression during latency.IMPORTANCE Various mechanisms have been identified by which viruses target host small RNA biogenesis pathways to achieve optimal infection outcomes. Herpes simplex virus 1 (HSV-1) is a ubiquitous human pathogen whose successful persistence in the host entails both productive ("lytic") and latent infection. Although many HSV-1 miRNAs have been discovered and some are thought to help control the lytic/latent switch, little is known about regulation of their biogenesis. By characterizing expression of both pre-miRNAs and mature miRNAs under various conditions, this study revealed striking differences in miRNA biogenesis between lytic and latent infection and uncovered a regulatory mechanism that blocks pre-miRNA nuclear export and is dependent on viral protein ICP27 and viral DNA synthesis. This mechanism represents a new virus-host interaction that could limit the repressive effects of HSV-1 miRNAs hypothesized to promote latency and may shed light on the regulation of miRNA nuclear export, which has been relatively unexplored.

Keywords: ICP27; herpes simplex virus; latency; miRNAs; nuclear export.


Figures

FIG 1
FIG 1
HSV-1 pre-miRNA and mature miRNA expression in Neuro-2a and 293T cells. Neuro-2a and 293T cells were infected with HSV-1 strain KOS at MOIs of 30 and 10, respectively. At various times postinfection, cells were harvested and small RNAs (<200 bases) were purified. Following polyacrylamide gel electrophoresis, RNAs were transferred to membranes and probed for miRNA expression by Northern blot hybridization. Cell line names and times of cell harvest (in h) are indicated at the top of the Northern images. Positions of miRNA species are labeled to the right of the images. At the bottom are ethidium bromide (EtBr) staining signals from the gels at ∼80 bases showing uniform loading for the images above them. Pre/mature ratios calculated following band quantification are shown below the images for miR-H2 and miR-H4. This experiment was performed twice. Similar results were also obtained for the specific time points indicated in Fig. 2 (see also Fig. S1).
FIG 2
FIG 2
HSV-1 pre-miRNA and mature miRNA expression in trigeminal ganglia at different times after infection or after reactivation from latency. Mice were mock infected or infected on the cornea with 2 × 105 PFU of HSV-1 strain KOS per eye. At the various days postinfection (dpi) indicated, trigeminal ganglia were collected for immediate RNA isolation. Additionally, at 30 dpi, some ganglia were explanted and cultivated for various days postexplantation (dpe) before RNA was isolated. Sixteen ganglia were pooled for each condition, and small RNAs (<200 bases) were isolated and analyzed by Northern blot hybridization. RNAs purified from Neuro-2a cells that had been mock infected or infected with HSV-1 strain KOS for 10 h were run alongside (first two lanes) the RNAs from ganglia to provide markers. The sources of RNAs and time points are indicated at the tops of each series (left and right, respectively) of Northern images. Positions of miRNA species are indicated to the right of the images. Ethidium bromide signals at ∼80 bases from the gels used for each series of Northern images are displayed at the bottom. Results of an independent experiment are shown in Fig. S1.
FIG 3
FIG 3
Conversion of pre-miRNA to mature miRNA during induced expression following lentiviral transduction. (A) 293T and Neuro-2a cells were stably transduced with an inducible pre-miR-H2 expressing lentivirus, resulting in 293TH2 and Neuro-2aH2 cell lines. After 1 μg/ml of Dox was added, cells were harvested at different times and analyzed by Northern blot hybridization for miR-H2 expression. Cell line names and time points are indicated at the tops of the images. Positions of miRNA species are labeled to the left. Ratios of band intensities of pre-miRNAs to those of miRNAs are shown at the bottom. The experiment using 293TH2 cells was performed twice; the experiment using Neuro-2aH2 cells was performed once. (B) As described for panel A, but the 293TH3/H4 and Neuro-2aH3/H4 cell lines were created by transduction using a lentivirus expressing miR-H3 and miR-H4, and miR-H3 and H4 expression levels were analyzed. These experiments were repeated with cells constructed using different lentivirus constructs expressing miR-H3 and/or miR-H4.
FIG 4
FIG 4
Stability of pre-miRNAs and miRNAs in lentivirus-transduced cells and HSV-1-infected cells. (A) miR-H2 expression from 293TH2 cells was induced by adding 1 μg/ml of Dox for 3 days. Then, 1 μg/ml of ActD was added to inhibit transcription. Cells were harvested at the times indicated at the top of the image and were analyzed by Northern blot hybridization for miR-H2 expression. Uniform loading on the gel used for the Northern blot hybridization was demonstrated by ethidium bromide staining (shown at the bottom). This experiment was performed once. (B) As described for panel A, but 293TH3/H4 cells were used and the levels of expression of miR-H3 (upper panel) and miR-H4 (lower panel) were analyzed. This experiment was repeated with cells constructed using different lentivirus vectors expressing miR-H3 and/or miR-H4. (C) 293T cells were infected with HSV-1 strain KOS (MOI = 10). At 2 hpi, 1 μg/ml ActD was added, and cells were harvested at the times indicated at the top of the images and analyzed by Northern blot hybridization for miR-H2 expression. The upper image shows pre-miR-H2 expression (mature miR-H2 was not detectable at that time point). The bottom images show the ethidium bromide-stained gel at ∼80 bases. (D) As described for panel C, but ActD was added at 8 hpi, and miR-H1 (upper panel) and miR-H2 (lower panel) were analyzed. Positions of miRNA species are indicated to the left. The experiments shown in panels C and D were performed twice; additionally, results for miR-H4 are shown in Fig. S2.
FIG 5
FIG 5
miR-138 expression in lentivirus-transduced cells and in cells infected with recombinant HSV-1 expressing miR-138. (A) 293T cells were stably transduced with an inducible pre-miR-138-1-expressing lentivirus, resulting in the 293T138 cell line. After 1 μg/ml of Dox was added, cells were harvested at the times indicated at the top of the image and analyzed by Northern blot hybridization for miR-138 expression. Pre/mature ratios calculated following band quantification are shown at the bottom. This experiment was performed twice. (B) Genomic location of inserted pre-miR-138-1-expressing sequences. The HSV-1 genome is depicted as a horizontal line at the top with long repeat sequences (TRL and IRL) and short repeat sequences (IRS and TRS), which are shown as dark and light gray boxes, respectively. An expanded view of the insertion location is shown below the horizontal line, with bars representing protein coding sequences, arrows representing transcripts and gene names provided to the left. As shown at the bottom, pre-miR-138-1 and flanking sequences were inserted between coding sequences of Us11 and Us12, resulting in a recombinant virus designated WTLyt138. (C) Replication kinetics in Vero cells (MOI = 0.02). Each point represents the average of titers from three biological replicates (the experiment was performed three times), and the vertical bars represent standard deviations. (D) 293T cells were infected with WTLyt138 (MOI = 5). The image shows an autoradiogram of the Northern blot of RNAs isolated from the cells at the hours postinfection (hpi) indicated at the top of the panel, hybridized for miR-138. Positions of pre-miR-138-1 and miR-138 are indicated to the left. Pre/mature ratios calculated following band quantification are shown at the bottom. This experiment was performed three times; additionally, similar results were obtained at two time points in Fig. 7F.
FIG 6
FIG 6
Nuclear export of pre-miRNA is blocked at late times during HSV-1 lytic infection. 293T cells were mock infected or infected with WTLyt138 virus (MOI = 5) for 5 or 12 h, at which times cells were harvested either for direct RNA purification (total) or for separation into nuclear and cytoplasmic fractions prior to RNA purification. The resulting RNAs were subjected to Northern blot hybridization for analysis of the RNAs indicated to the right of the panels. Mock infection and times postinfection (pi) are indicated at the top of the panel. The fractions are identified above the images. T, total RNA; N, nuclear fraction; C, cytoplasmic fraction. Mature miR-H1 was not detected in this experiment. The gel stained with ethidium bromide at ∼80 to ∼110 bases is shown in the bottom panel. An image from a longer exposure of the miR-138 signals is shown to the left of the main panel for miR-138. This experiment was performed twice. Additionally, similar results were obtained for miR-H6 in KOS-infected or KOS1.1-infected cells (Fig. 7E; see also Fig. S4).
FIG 7
FIG 7
Impairment of miRNA biogenesis is dependent on ICP27 and viral DNA synthesis but not on Us11. (A) Us11 expression from WT and mutant viruses. 293T cells were infected with the viruses indicated at the top of the panel (MOI = 5) and harvested at 16 hpi for Western blot analysis. The proteins analyzed are identified to the left of the panel. This experiment was performed three times. (B) Us11 deletion does not affect viral miRNA biogenesis. 293T cells were infected (MOI = 5) with the viruses indicated at the top of the panel. At 16 hpi, cells were harvested and analyzed by Northern blot hybridization for miR-H1 and miR-H2 expression. This experiment was performed several times. (C) Effects of ICP27 deletion on miR-H2 biogenesis. Vero cells were mock infected or infected (MOI = 20) for 24 h with the viruses indicated at the top of the panel. Pre-miR-H2 and miR-H2 expression (top panel) and let-7a expression (bottom) were analyzed by Northern blot hybridization. This experiment was performed twice. (D) Effects of ICP27 deletion on miR-H6 biogenesis in Vero and E11 cells. Vero cells, or E11 cells, which complement ICP27 expression, were infected with the viruses indicated at the top of the panel (MOI = 20) for 24 h, when the cells were analyzed by Northern blot hybridization for miR-H6. Expression of let-7a as a loading control is shown at the bottom. This experiment was performed twice. (E) Relief of the block of nuclear export in the absence of ICP27. 293T cells were mock infected (lane 1) or infected with the viruses indicated at the top of the panel. At 12 hpi, total RNA was isolated from infected cells (T; lanes 1, 2, and 5) or from nuclear (N; lanes 3 and 6) or cytoplasmic (C; lanes 4 and 7) fractions and analyzed as described for Fig. 6 for miR-H6, U1, and lys-tRNA (as indicated to the right of the panel). This experiment was performed twice. (F) Effects of ACV and ActD on miRNA biogenesis. 293T cells were infected (MOI = 5) with WT-BAC (lane 1) as a negative control for miR-138 expression or with WTLyt138 (lanes 2 to 7), as indicated in the top two lines of the panel. Plus signs (+) on the next two lines indicate treatment with ACV at the time of infection (lanes 5 to 7) or with ActD at 8 hpi (lanes 3 and 6), respectively. ACV was added to block viral DNA synthesis, and ActD was added to block RNA synthesis to help assess the stability of pre-miR-138 and mature miR-138. Plus signs on the next two lines indicate whether infected cells were harvested for RNA isolation at 8 hpi (lanes 2 and 5) or 14 hpi (lanes 1, 3, 4, 6, and 7). The image below shows the results of Northern analysis of expression of pre-miR-138-1 and miR-138, as indicated to the left. Pre/mature ratios calculated following band quantification are displayed below the image. let-7a levels as loading controls are shown at the bottom. This experiment was performed twice.
FIG 8
FIG 8
Cartoon of proposed mechanism of regulation of miRNA biogenesis during HSV-1 infection. The cartoon is divided into a nuclear portion to the left and a cytoplasmic portion to the right, with vertical dotted lines representing the nuclear membrane. The upper and lower parts of the cartoon illustrate events occurring during lytic infection and latent infection, respectively. Pre-miRNA stem-loop structures are represented by hairpins. Lines terminating with arrowheads point from causes to results of events, with important factors shown above the arrows and with each red X indicating a loss of expression of important factors. Red lines terminating with perpendicular lines indicate events being blocked by ICP27 and/or lytic products dependent upon ICP27 for their synthesis, with the dashed line indicating a loss of the block.

Similar articles

Cited by

References

    1. Roizman B, Knipe DM, Whitley RJ. 2013. Herpes simplex virus, p 1823–1897. In Knipe DM, Howley PM, Cohen JI, Griffin DE, Lamb RA, Martin MA, Racianello VR, Roizman B (ed), Fields virology, 6th ed Lippincott Williams & Wilkins, Philadelphia, PA.
    1. Cui C, Griffiths A, Li G, Silva LM, Kramer MF, Gaasterland T, Wang XJ, Coen DM. 2006. Prediction and identification of herpes simplex virus 1-encoded microRNAs. J Virol 80:5499–5508. doi:10.1128/JVI.00200-06. - DOI - PMC - PubMed
    1. Umbach JL, Kramer MF, Jurak I, Karnowski HW, Coen DM, Cullen BR. 2008. MicroRNAs expressed by herpes simplex virus 1 during latent infection regulate viral mRNAs. Nature 454:780–783. doi:10.1038/nature07103. - DOI - PMC - PubMed
    1. Jurak I, Kramer MF, Mellor JC, van Lint AL, Roth FP, Knipe DM, Coen DM. 2010. Numerous conserved and divergent microRNAs expressed by herpes simplex viruses 1 and 2. J Virol 84:4659–4672. doi:10.1128/JVI.02725-09. - DOI - PMC - PubMed
    1. Han Z, Liu X, Chen X, Zhou X, Du T, Roizman B, Zhou G. 2016. miR-H28 and miR-H29 expressed late in productive infection are exported and restrict HSV-1 replication and spread in recipient cells. Proc Natl Acad Sci U S A 113:E894–E901. doi:10.1073/pnas.1525674113. - DOI - PMC - PubMed

Publication types

MeSH terms