Epigenomic analysis reveals DNA motifs regulating histone modifications in human and mouse
- PMID: 30755522
- PMCID: PMC6397554
- DOI: 10.1073/pnas.1813565116
Epigenomic analysis reveals DNA motifs regulating histone modifications in human and mouse
Abstract
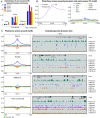
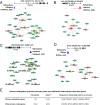
Histones are modified by enzymes that act in a locus, cell-type, and developmental stage-specific manner. The recruitment of enzymes to chromatin is regulated at multiple levels, including interaction with sequence-specific DNA-binding factors. However, the DNA-binding specificity of the regulatory factors that orchestrate specific histone modifications has not been broadly mapped. We have analyzed 6 histone marks (H3K4me1, H3K4me3, H3K27ac, H3K27me3, K3H9me3, H3K36me3) across 121 human cell types and tissues from the NIH Roadmap Epigenomics Project as well as 8 histone marks (with addition of H3K4me2 and H3K9ac) from the mouse ENCODE Consortium. We have identified 361 and 369 DNA motifs in human and mouse, respectively, that are the most predictive of each histone mark. Interestingly, 107 human motifs are conserved between the two species. In human embryonic cell line H1, we mutated only the found DNA motifs at particular loci and the significant reduction of H3K27ac levels validated the regulatory roles of the perturbed motifs. The functionality of these motifs was also supported by the evidence that histone-associated motifs, especially H3K4me3 motifs, significantly overlap with the expression of quantitative trait loci SNPs in cancer patients more than the known and random motifs. Furthermore, we observed possible feedbacks to control chromatin dynamics as the found motifs appear in the promoters or enhancers associated with various histone modification enzymes. These results pave the way toward revealing the molecular mechanisms of epigenetic events, such as histone modification dynamics and epigenetic priming.
Keywords: CRISPR; chromatin dynamics; cis-regulatory elements; epigenomics; locus specificity.
Conflict of interest statement
The authors declare no conflict of interest.
Figures


Similar articles
-
HebbPlot: an intelligent tool for learning and visualizing chromatin mark signatures.BMC Bioinformatics. 2018 Sep 3;19(1):310. doi: 10.1186/s12859-018-2312-1. BMC Bioinformatics. 2018. PMID: 30176808 Free PMC article.
-
DNA methylation regulates discrimination of enhancers from promoters through a H3K4me1-H3K4me3 seesaw mechanism.BMC Genomics. 2017 Dec 12;18(1):964. doi: 10.1186/s12864-017-4353-7. BMC Genomics. 2017. PMID: 29233090 Free PMC article.
-
Classification of Promoters Based on the Combination of Core Promoter Elements Exhibits Different Histone Modification Patterns.PLoS One. 2016 Mar 22;11(3):e0151917. doi: 10.1371/journal.pone.0151917. eCollection 2016. PLoS One. 2016. PMID: 27003446 Free PMC article.
-
Histone modifications for human epigenome analysis.J Hum Genet. 2013 Jul;58(7):439-45. doi: 10.1038/jhg.2013.66. Epub 2013 Jun 6. J Hum Genet. 2013. PMID: 23739122 Review.
-
Epigenetics and epigenomics: underlying mechanisms, relevance, and implications in crop improvement.Funct Integr Genomics. 2020 Nov;20(6):739-761. doi: 10.1007/s10142-020-00756-7. Epub 2020 Oct 21. Funct Integr Genomics. 2020. PMID: 33089419 Review.
Cited by
-
Identification of DNA motifs that regulate DNA methylation.Nucleic Acids Res. 2019 Jul 26;47(13):6753-6768. doi: 10.1093/nar/gkz483. Nucleic Acids Res. 2019. PMID: 31334813 Free PMC article.
-
Deciphering the genetic code of DNA methylation.Brief Bioinform. 2021 Sep 2;22(5):bbaa424. doi: 10.1093/bib/bbaa424. Brief Bioinform. 2021. PMID: 33432324 Free PMC article. Review.
-
An atlas of dynamic chromatin landscapes in mouse fetal development.Nature. 2020 Jul;583(7818):744-751. doi: 10.1038/s41586-020-2093-3. Epub 2020 Jul 29. Nature. 2020. PMID: 32728240 Free PMC article.
-
Epigenetic Modulation of GPER Expression in Gastric and Colonic Smooth Muscle of Male and Female Non-Obese Diabetic (NOD) Mice: Insights into H3K4me3 and H3K27ac Modifications.Int J Mol Sci. 2024 May 11;25(10):5260. doi: 10.3390/ijms25105260. Int J Mol Sci. 2024. PMID: 38791299 Free PMC article.
-
Deep Resequencing of the 1q22 Locus in Non-Lobar Intracerebral Hemorrhage.Ann Neurol. 2024 Feb;95(2):325-337. doi: 10.1002/ana.26814. Epub 2023 Oct 14. Ann Neurol. 2024. PMID: 37787451 Free PMC article.
References
Publication types
MeSH terms
Substances
Grants and funding
LinkOut - more resources
Full Text Sources

