. 2019 Feb 26;116(9):3454-3459.
doi: 10.1073/pnas.1819082116. Epub 2019 Feb 12.

Mid-infrared feed-forward dual-comb spectroscopy

Affiliations

Mid-infrared feed-forward dual-comb spectroscopy

Zaijun Chen et al. Proc Natl Acad Sci U S A. .

Abstract

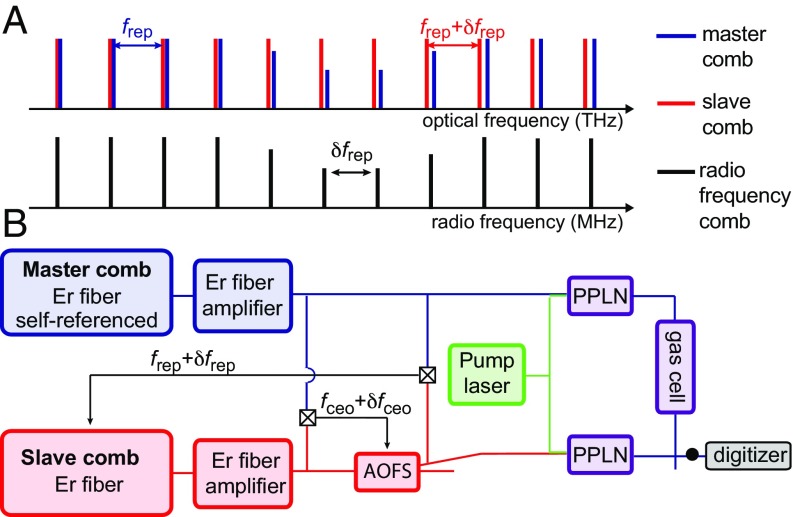
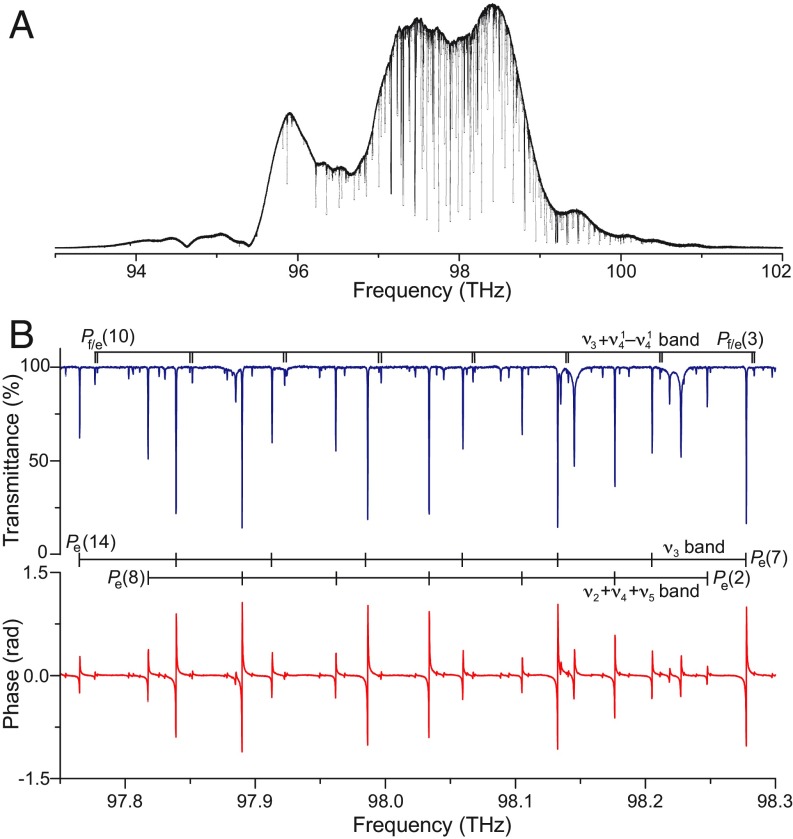
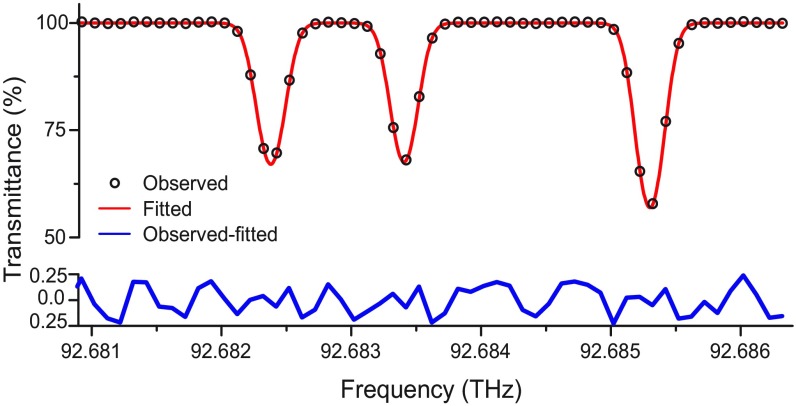
Mid-infrared high-resolution spectroscopy has proven an invaluable tool for the study of the structure and dynamics of molecules in the gas phase. The advent of frequency combs advances the frontiers of precise molecular spectroscopy. Here we demonstrate, in the important 3-µm spectral region of the fundamental CH stretch in molecules, dual-comb spectroscopy with experimental coherence times between the combs that exceed half an hour. Mid-infrared Fourier transform spectroscopy using two frequency combs with self-calibration of the frequency scale, negligible contribution of the instrumental line shape to the spectral profiles, high signal-to-noise ratio, and broad spectral bandwidth opens up opportunities for precision spectroscopy of small molecules. Highly multiplexed metrology of line shapes may be envisioned.

Keywords: frequency comb; laser spectroscopy; mid-infrared; molecular spectroscopy.


Conflict of interest statement

The authors declare no conflict of interest.

Figures

Fig. 1.
Fig. 1.
(A) Frequency-domain principle of dual-comb spectroscopy. Beat notes between pairs of lines of two optical combs, with a spacing of frep and frepfrep, respectively, generate a radio-frequency comb of line spacing δfrep. The radio-frequency comb can be digitally processed. (B) Experimental setup for mid-infrared broadband dual-comb spectroscopy using feed-forward control of the relative CEO frequency. AOFS, acousto-optic frequency shifter.
Fig. 2.
Fig. 2.
Experimental dual-comb spectrum with resolved comb lines, recorded within 1,742 s. (A) Entire apodized spectrum: 82,000 individual comb lines spanning 8.2 THz are resolved. (B) Detail of the unapodized representation of A showing the (J′ = 13, Ka′ = 1, Kc′ = 13)–(J″ = 14, Ka″ = 0, Kc″ = 14) line in a P branch of the ν9 band of 12C2H4 sampled by the comb lines of 100-MHz spacing. (C) Magnified unapodized representation of A showing eight individual comb lines with their cardinal sine instrumental line shape. The frequency scale is converted to the optical scale, thus the transform-limited width of 6.8 Hz of the radio-frequency comb lines appears as 5.3 MHz in the optical domain.
Fig. 3.
Fig. 3.
Experimental dual-comb spectrum of ethylene sampled at exactly the comb-line spacing of 100 MHz in the region of 92 THz. (A) The amplitude of the FT provides the transmission spectrum. (B) Magnified representation of the transmittance (Top) and dispersion (Bottom) spectra around 91.25 THz. Note that the transmittance y axis does not go to zero. Some rotational assignments (39), in the P branch of the ν9 band, are given as an illustration. The strong lines are unresolved doublets of the (K′a = 5, ΔKa = K′aKa = −1, ΔKc = K′cKc = ±1) series, while the ΔKc = ±1 doublets are resolved for (K′a = 4, ΔKa = −1). Ka (respectively, Kc) is the quantum number for the projection of the rotational angular momentum (excluding electron and nuclear spin) onto the inertial axis of smallest moment (respectively, largest moment). Prime and double primes refer to upper and lower states, respectively. (C) Magnified representation of the transmittance (Top) and dispersion (Bottom) spectra around 94.56 THz. The intensity of the spectral envelope of our dual-comb system is significantly weaker here, in the region of Q branch of the (K′a = 7, Ka = 6, ΔKc = −1) lines of the ν9 band.
Fig. 4.
Fig. 4.
Evolution of the average signal-to-noise ratio with the measurement time in an ethylene spectrum. The fit of a line to the experimental data shows a slope of 0.506 (5) indicating that the signal-to-noise ratio shows dependence with the square root of the measurement time. The spectrum corresponding to a measurement time of 1,742 s is shown in Figs. 2 and 3.
Fig. 5.
Fig. 5.
Experimental spectrum of acetylene in the region of the ν3 band with a resolution of 100 MHz. (A) The entire spectrum is measured within 2,050.2 s. (B) Transmittance and dispersion spectra in the region of the P branch of the ν3 band of 12C2H2. The assignments for a selection of strong and weak lines are provided (36). The lines with a broader pedestal are due to atmospheric water vapor, outside the cell, in the beam path.
Fig. 6.
Fig. 6.
Portion of the transmittance spectrum of 12C2H4 (black open dots, labeled observed), magnifying three rovibrational lines. The transmittance y scale in the spectrum stops at 50%.The experimental profile is satisfactorily fitted by a Doppler line shape (red line, labeled fitted). The standard deviation of the residuals (“observed–fitted”) is at the noise level. The y scale of the residuals is magnified compared with that of the top.

Similar articles

Cited by

References

    1. Hänsch TW. Nobel lecture: Passion for precision. Rev Mod Phys. 2006;78:1297–1309.
    1. Picqué N, Hänsch TW, Frequency comb spectroscopy. Nat Photonics, in press
    1. Baumann E, et al. Spectroscopy of the methane ν3 band with an accurate midinfrared coherent dual-comb spectrometer. Phys Rev A. 2011;84:062513.
    1. Ycas G, et al. High-coherence mid-infrared dual-comb spectroscopy spanning 2.6 to 5.2 µm. Nat Photonics. 2018;12:202–208.
    1. Chen Z, Yan M, Hänsch TW, Picqué N. A phase-stable dual-comb interferometer. Nat Commun. 2018;9:3035. - PMC - PubMed

Publication types

LinkOut - more resources