. 2019 Feb 26;116(9):3502-3507.
doi: 10.1073/pnas.1814204116. Epub 2019 Feb 12.

Dynamically stiffened matrix promotes malignant transformation of mammary epithelial cells via collective mechanical signaling

Affiliations

Dynamically stiffened matrix promotes malignant transformation of mammary epithelial cells via collective mechanical signaling

Matthew G Ondeck et al. Proc Natl Acad Sci U S A. .

Abstract

Breast cancer development is associated with increasing tissue stiffness over years. To more accurately mimic the onset of gradual matrix stiffening, which is not feasible with conventional static hydrogels, mammary epithelial cells (MECs) were cultured on methacrylated hyaluronic acid hydrogels whose stiffness can be dynamically modulated from "normal" (<150 Pascals) to "malignant" (>3,000 Pascals) via two-stage polymerization. MECs form and remain as spheroids, but begin to lose epithelial characteristics and gain mesenchymal morphology upon matrix stiffening. However, both the degree of matrix stiffening and culture time before stiffening play important roles in regulating this conversion as, in both cases, a subset of mammary spheroids remained insensitive to local matrix stiffness. This conversion depended neither on colony size nor cell density, and MECs did not exhibit "memory" of prior niche when serially cultured through cycles of compliant and stiff matrices. Instead, the transcription factor Twist1, transforming growth factor β (TGFβ), and YAP activation appeared to modulate stiffness-mediated signaling; when stiffness-mediated signals were blocked, collective MEC phenotypes were reduced in favor of single MECs migrating away from spheroids. These data indicate a more complex interplay of time-dependent stiffness signaling, spheroid structure, and soluble cues that regulates MEC plasticity than suggested by previous models.

Keywords: epithelial-to-mesenchymal transition; hyaluronic acid; hydrogel; mammary.


Conflict of interest statement

The authors declare no conflict of interest.

Figures
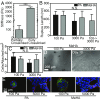
Fig. 1.
Fig. 1.
Tunable MeHA hydrogels have similar properties to PA hydrogels. (A) MeHA stiffness is plotted for hydrogels that were cross-linked in a two-stage process (26). Data represent mean ± SD in triplicate (n > 100 measurements per bar). ***P < 10−3 from an unpaired Student t test. (B) Type I collagen attachment is shown by rupture length of the tether pulled off of the surface as in Wen et al. (27) to assess protein-hydrogel coupling. No statistical difference by two-way ANOVA was found between 100 Pa and 3,000 Pa hydrogels fabricated using MeHA or PA as well as MeHA hydrogels that were stiffened using the two-stage process (n > 100 measurements over three independent gels per bar). (C) Initial MEC attachment is plotted as a function of stiffness or substrate. No statistical difference by two-way ANOVA was found (n = 3 hydrogels containing over 50 cells per bar). (D) Phase images demonstrating MCF10A cell response on 100 and 3,000 Pa MeHA substrates. (Scale bar: 200 µm.) (E) Fluorescent images of E-cadherin (green), Laminin V (red), and nuclei (blue) for both 100 and 3,000 Pa substrates made using either polyacrylamide (PA) or MeHA (16, 17). N.S., not significant.
Fig. 2.
Fig. 2.
MeHA substrates have tunable stiffness to interrogate MEC response to dynamic stiffening. (A) Hydrogel stiffness was measured using AFM for substrates after the initial polymerization step (prestiffened) and then after the second polymerization step (poststiffened). Each color corresponds to a different UV duration in the presence of the Irgacure 2959 (n = 6 hydrogels with >20 measurements per gel for each bar). ***P < 10−3 from a paired Student t test between the prestiffened and poststiffened states of each substrate. (B) MECs were cultured as indicated and stained for actin (red) and nuclei (blue). (C) Cell aspect ratio is plotted with each color corresponding to the stiffening regiment in A. The dashed line at 1.5 indicates an approximate transition point from spherical to nonspherical morphology. The percentage of data below the transition is shown, indicating the fraction of the population that remains spherical. *P < 0.05, **P < 1 × 10⁻², and ***P < 1 × 10⁻³ from an unpaired Student t test (n > 15 spheroids per condition). N.S., not significant.
Fig. 3.
Fig. 3.
Dynamically stiffened MeHA substrates influence MEC stiffness response. (A) On culture days 2, 4, 6, 8, and 10 on 100 Pa substrates, samples were stiffened to ∼3,000 Pa. Data represent mean ± SD for polymerization from first batch of MeHA (n = 6 hydrogels with >100 measurements per bar). ***P < 10−3 from an unpaired Student t test. (B) Representative brightfield images of MECs cultured on MeHA substrates with variable times for stiffening corresponding to A and indicated by row (middle columns); total culture time for dynamically stiffened gels are indicated for each row plus the time indicated by each column. For reference, MECs cultured on substrates with stiffness of 100 Pa (Left) and 3,000 Pa (Right) are shown with each row corresponding to the indicated culture day. (C) Quantification of the percent spheroids remaining as a function of the days after stiffening. Data are sorted by preculture time (n = 2 biological replicates with ≥2 gels with 80–341 spheroids measured per condition; for 8 d before culture, n = 1 biological replicate with four gels with 70–135 spheroids measured per gel). ****P < 1 × 10⁻⁴ for time after stiffening and ***P < 1 × 10⁻³ for stiffening day from a two-way ANOVA with *P < 0.05 for Tukey’s post hoc analysis versus other individual conditions.
Fig. 4.
Fig. 4.
Ability of MECs to respond to stiffness-mediated changes is size independent. (A) Schematic shows how aggrewell plates were used to precluster cells before seeding onto 100 and 3,000 Pa substrates to investigate the dependence on spheroid size or maturity. (B and D) Spheroids made with 250 and 500 cells, respectively, were seeded onto 100 and 3,000 Pa substrates, and selected 100 Pa hydrogels were stiffened at day 2. Images show resulting morphology at indicated days. White arrowheads denote the spheroids remaining on substrates 5 d after plating. (C and E) The percent spheroids remaining are shown as a function of days after replating with the day of stiffening indicated for 250 and 500 cells per spheroid, respectively. *P < 0.05 for Tukey’s post hoc analysis versus other conditions (n = 2 biological replicates containing 33–67 spheroids or EMT cluster per condition for each time point).
Fig. 5.
Fig. 5.
MEC spreading is not cell autonomous. (A) Schematic depicting 1° and 2° screens of spheroids that were cultured on stiffened hydrogels during the 1° screen. Cells undergoing EMT were separated from spheroids using the method in SI Appendix, Fig. S6 and replated in the 2° screen on 100 Pa, 3,000 Pa, or a substrate stiffened from 100 to 3,000 Pa. (B and D) Representative images up to day 5 after replating from the 2° screen of cells isolated from spheroid and EMT regions of the primary screen, respectively. For substrates that were stiffened (Middle), timing of matrix stiffening is noted. White arrowheads denote the spheroids remaining on substrates 5 d after plating. (C and E) The percent spheroids remaining are shown as a function of days after replating with the day of stiffening indicated for cells isolated from spheroids and EMT regions of the primary screen, respectively (n = 2 biological replicates containing 10–71 spheroid or EMT cluster per condition for each time point). *P < 0.05, **P < 1 × 10⁻², and ***P < 1 × 10⁻³ for Tukey’s post hoc analysis versus other conditions at the same time point. Two-way ANOVA was not significant (NS) for effect of EMT vs. spheroid.
Fig. 6.
Fig. 6.
TWIST and SMAD localization in spherical and spread MECs. (A) TWIST (green) and SMAD2/3 (red) immunofluorescent imaging of MECs on compliant and stiff substrates. Images show cells that have cytoplasmic localization of TWIST and SMAD (open arrowheads) on compliant gels and nuclear localization (filled arrowheads) on stiff gels. (B) Plot of the nuclear to cytoplasmic intensity ratio for Twist and SMAD2/3 for the indicated conditions (n = 100 cells). Lines delineate separation of data between compliant and stiff. (C) TWIST and SMAD2/3 immunofluorescent imaging for MECs on stiffened substrates. Arrowheads indicate cells that are cytoplasmic or nuclear localized. (D) Plot of the nuclear to cytoplasmic intensity ratio for Twist and SMAD on stiffened substrates (n = 100 cells). The lines from B were used to identify cells as either positive or negative for the markers.
Fig. 7.
Fig. 7.
YAP and SMAD localization in spherical and spread MECs. (A) YAP (green) and SMAD2/3 (red) immunofluorescent imaging of MECs on compliant and stiff substrates. Images show cells that have cytoplasmic localization of YAP and SMAD2/3 (open arrowheads) on compliant gels and nuclear localization (filled arrowheads) on stiff gels. (B) Plot of the nuclear to cytoplasmic intensity ratio for YAP and SMAD2/3 for the indicated conditions (n = 100 cells). Lines delineate separation of data between compliant and stiff. (C) YAP and SMAD2/3 immunofluorescent imaging for MECs on stiffened substrates. Arrowheads indicate cells that are cytoplasmic or nuclear localized. (D) Plot of the nuclear to cytoplasmic intensity ratio for YAP and SMAD2/3 on stiffened substrates (n = 100 cells). The lines from B were used to identify cells as either positive or negative for the markers.
Fig. 8.
Fig. 8.
YAP and SMAD inhibition reduces number of spread cells on stiffened gels. (A) Images demonstrating spread cells on stiffened substrates and cells treated with Galunisertib and Verteporfin. (B) Total number of spread cells per spheroid was plotted for untreated and treated cells. *P < 0.05, **P < 1 × 10⁻², and ***P < 1 × 10⁻³ for Tukey’s post hoc analysis. (C) Mechanism describing inhibition of YAP and SMAD nuclear localization on MECs spreading.

References

    1. Lo CM, Wang HB, Dembo M, Wang YL. Cell movement is guided by the rigidity of the substrate. Biophys J. 2000;79:144–152. - PMC - PubMed
    1. Happe CL, Tenerelli KP, Gromova AK, Kolb F, Engler AJ. Mechanically patterned neuromuscular junctions-in-a-dish have improved functional maturation. Mol Biol Cell. 2017;28:1950–1958. - PMC - PubMed
    1. Choi YS, et al. The alignment and fusion assembly of adipose-derived stem cells on mechanically patterned matrices. Biomaterials. 2012;33:6943–6951. - PMC - PubMed
    1. Yeung T, et al. Effects of substrate stiffness on cell morphology, cytoskeletal structure, and adhesion. Cell Motil Cytoskeleton. 2005;60:24–34. - PubMed
    1. Engler AJ, Sen S, Sweeney HL, Discher DE. Matrix elasticity directs stem cell lineage specification. Cell. 2006;126:677–689. - PubMed

Publication types

MeSH terms