. 2019 Feb 12;10(1):711.
doi: 10.1038/s41467-019-08441-5.

A genetically encoded single-wavelength sensor for imaging cytosolic and cell surface ATP

Affiliations

A genetically encoded single-wavelength sensor for imaging cytosolic and cell surface ATP

Mark A Lobas et al. Nat Commun. .

Abstract

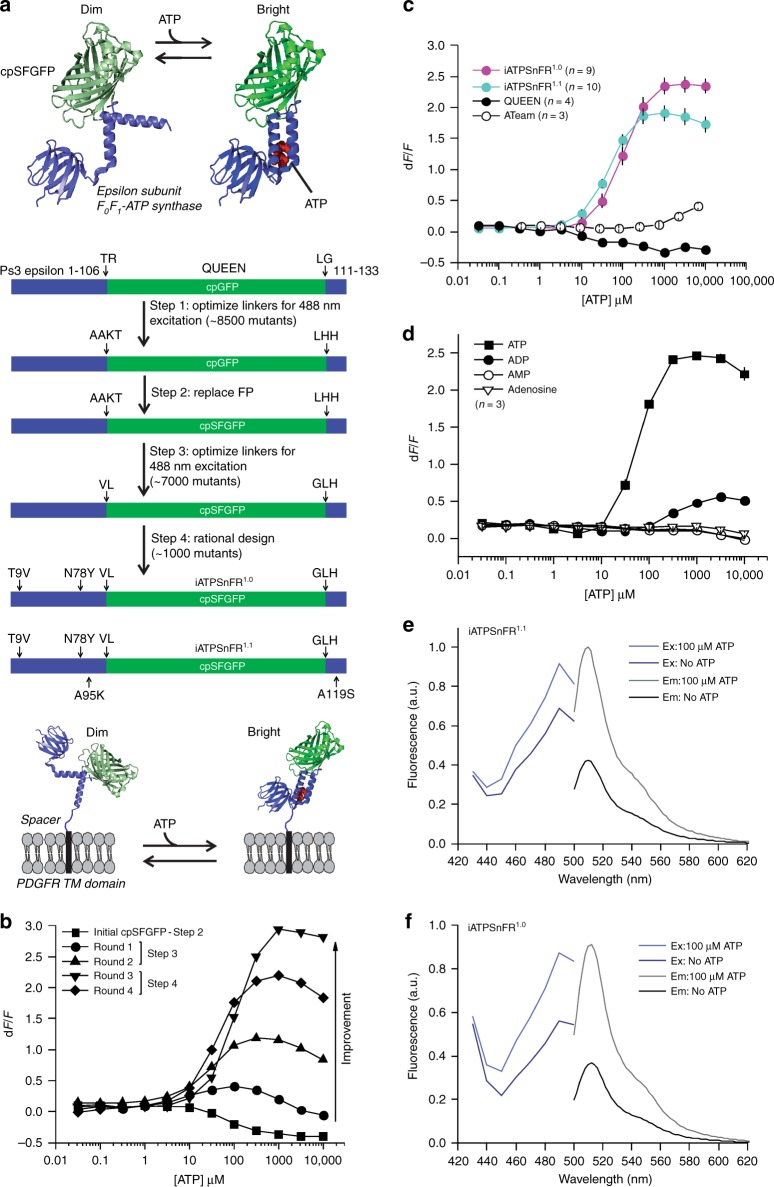
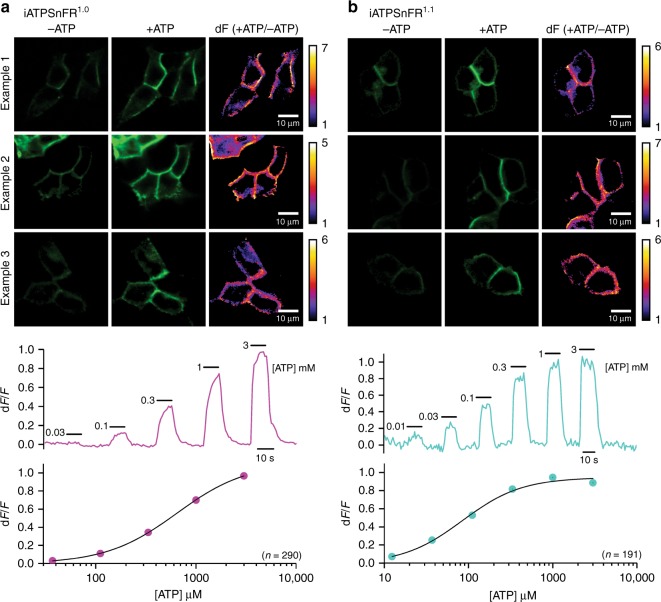
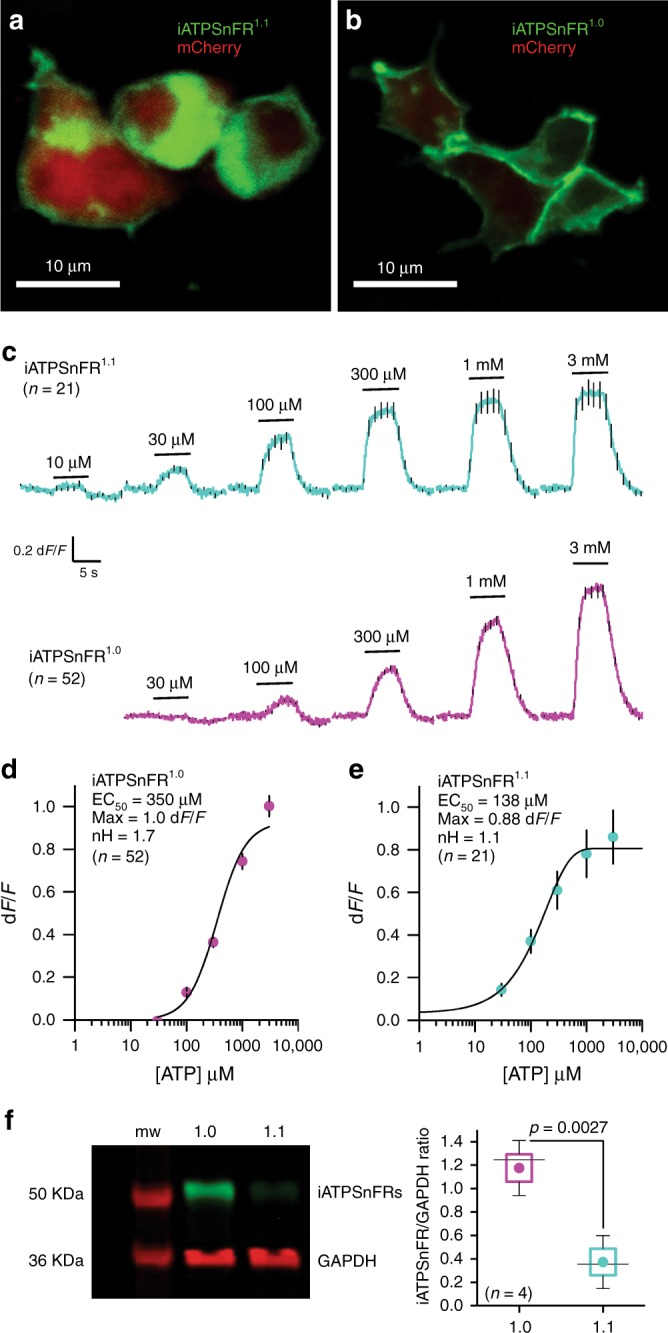
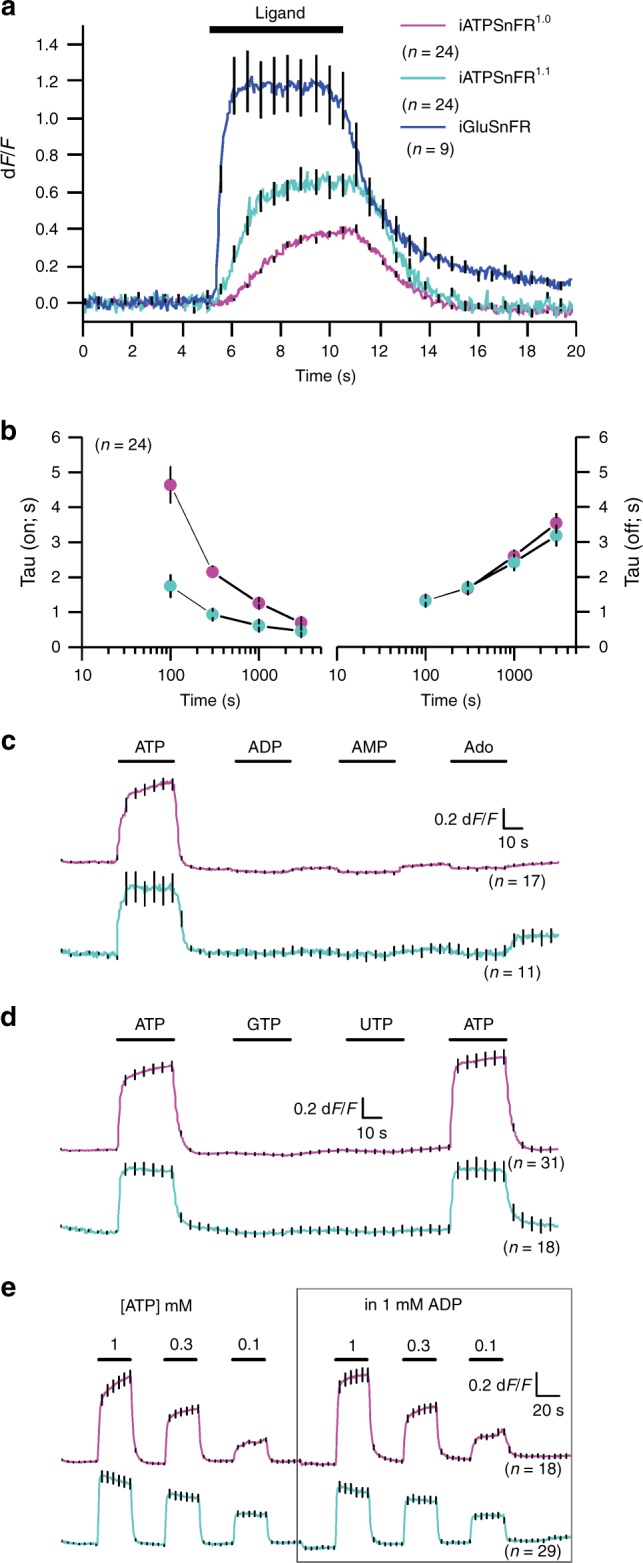
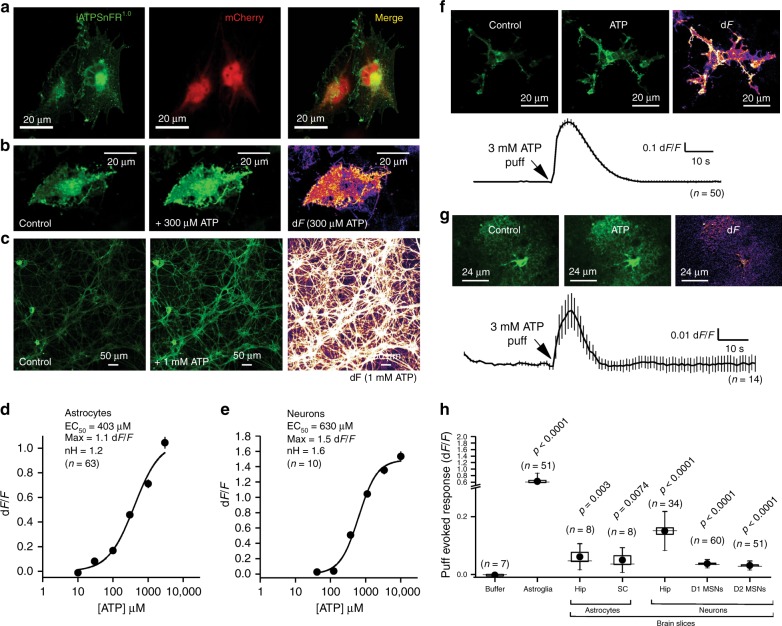
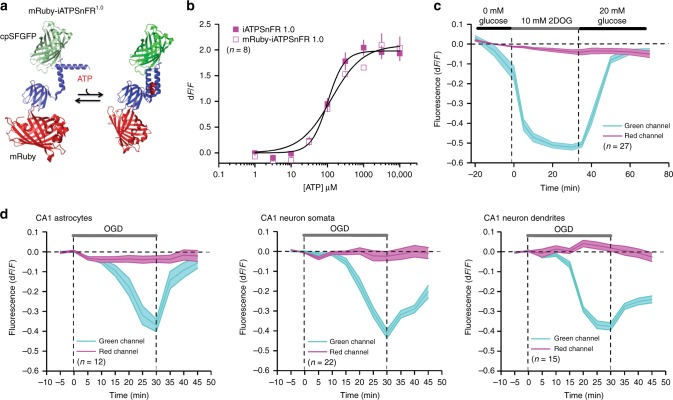
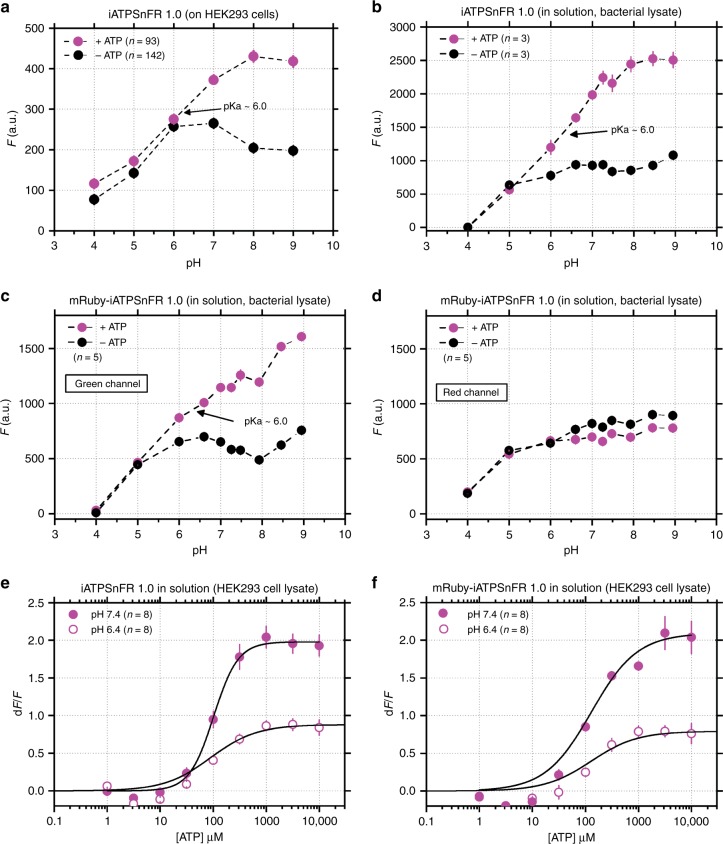
Adenosine 5' triphosphate (ATP) is a universal intracellular energy source and an evolutionarily ancient, ubiquitous extracellular signal in diverse species. Here, we report the generation and characterization of single-wavelength genetically encoded fluorescent sensors (iATPSnFRs) for imaging extracellular and cytosolic ATP from insertion of circularly permuted superfolder GFP into the epsilon subunit of F0F1-ATPase from Bacillus PS3. On the cell surface and within the cytosol, iATPSnFR1.0 responds to relevant ATP concentrations (30 μM to 3 mM) with fast increases in fluorescence. iATPSnFRs can be genetically targeted to specific cell types and sub-cellular compartments, imaged with standard light microscopes, do not respond to other nucleotides and nucleosides, and when fused with a red fluorescent protein function as ratiometric indicators. After careful consideration of their modest pH sensitivity, iATPSnFRs represent promising reagents for imaging ATP in the extracellular space and within cells during a variety of settings, and for further application-specific refinements.


Conflict of interest statement

The authors declare no competing interests.

Figures

Fig. 1
Fig. 1
Design and optimization of a single-wavelength ATP sensor. a Schematic showing the design and workflow used to optimize QUEEN-7µ into a single-wavelength ATP sensor with the goal of displaying the sensor on the surface of cells. b Dose–response curves of iATPSnFR over several successive rounds of mutagenesis (Ex: 488 nm, Em: 515 nm). Fluorescence quenching at very high ATP concentrations can be observed in addition to binding-dependent increases. c Dose–response curves for purified ATeam, QUEEN-7µ, iATPSnFR1.0, and iATPSnFR1.1. ATeam dose–response curves were acquired with Ex: 435 nm and Em: 530 nm. The other constructs were with Ex: 488 nm, Em: 515 nm. d Dose–response curves of purified iATPSnFR1.1 to ATP, ADP, AMP, and adenosine. e, f Excitation and emission spectra for iATPSnFR1.0 and iATPSnFR1.1 in solution (the traces are the average from 48 replicates each in a 96-well plate). The error bars represent the s.e.m. and in some cases are smaller than the symbols used for the mean. When greater than one (in the case of exemplar traces and graphs), n is provided in the figure panels and refers to the number of independent evaluations
Fig. 2
Fig. 2
Representative images and traces for responses measured with cell surface iATPSnFRs. a The upper panels show three examples of ATP responses for HEK293 cells expressing iATPSnFR1.0. The lower panels show representative traces and an average dose–response curve from 290 cells. b As in (a), but for iATPSnFR1.1. The dose–response curve represents an average from 191 cells. In the dose–response curves, the error bars represent the s.e.m. and in some cases are smaller than the symbols used for the mean. n numbers are provided in the figure panels and refer to the number of cells
Fig. 3
Fig. 3
Characterization of cell surface iATPSnFRs in HEK293 cells. a Single planes from a confocal z-stack of transiently transfected HEK293 cells expressing cytoplasmic mCherry and membrane-displayed iATPSnFR1.0. b As in (a), but for iATPSnFR1.1 transiently expressed in HEK293 cells. c Average traces for iATPSnFR1.1 (green) and iATPSnFR1.0 (red) over a range of concentrations from 10 µM to 3 mM measured with wide field epifluorescence imaging. d, e Dose–response curves for iATPSnFR1.0 and iATPSnFR1.1 displayed on the surface of HEK293 cells. Sensitivity (EC50), total dynamic range (Max) and cooperativity (nH) shown. f Representative Western blot from HEK293 cells transfected with iATPSnFR1.0 or iATPSnFR1.1 probed for GFP (iATPSnFRs) and GAPDH (loading control). The full-uncropped gel is shown in Supplementary Figure 9. In panel (f), the graph shows the quantification of iATPSnFR expression from four Western blots normalized to GAPDH loading control. The circle represents the mean, the box the s.e.m., the whiskers the s.d., and the horizontal line the median. The data were compared with an un-paired Students t test. In the other panels, the error bars represent the s.e.m. and in some cases are smaller than the symbols used for the mean. n numbers are provided in the figure panels and refer to the number of cells for panels (c and d) and independent evaluations for panel (f)
Fig. 4
Fig. 4
Assessment of the kinetics and ligand selectivity of cell surface ATP sensors. a Traces for cell-displayed iATPSnFR1.0, iATPSnFR1.1, and iGluSnFR kinetics from fast-solution change experiments. We could change solutions in under ~10 ms. b Shows the τon and τoff for iATPSnFR1.0 and iATPSnFR1.1 at various ATP concentrations. c Shows the response of iATPSnFR1.0 and iATPSnFR1.1 to ATP, ADP, AMP, and adenosine (1 mM applications). d The response of iATPSnFR1.0 and iATPSnFR1.1 to ATP, GTP, and UTP (1 mM applications). e Traces of iATPSnFR1.0 and iATPSnFR1.1 with three different concentrations of ATP (1, 0.3, and 0.1 mM) with and without 1 mM ADP. ADP has little effect on iATPSnFR responses. The error bars represent the s.e.m. and in some cases are smaller than the symbols used for the mean. n numbers are provided in the figure panels and refer to the number of cells
Fig. 5
Fig. 5
Characterization of cell surface and cytosolic iATPSnFR1.0 in astrocytes and neurons. a A single plane from a confocal z-stack of a U373MG cell expressing cytoplasmic mCherry and membrane-displayed iATPSnFR1.0. b Confocal images of U373MG cells expressing iATPSnFR1.0 before ATP application (control) and during a 300 µM ATP application (+ATP), as well as the change in fluorescence (dF). c Confocal images of hippocampal neurons before ATP application (control) and during 1 mM ATP application, as well as the change in fluorescence (dF). d, e Dose–response curves for iATPSnFR1.0 when displayed on the surface of U373MG astroglia and hippocampal neurons. f A confocal image of a U373MG astroglia cell transfected with iATPSnFR1.0 before a 3 mM puff of ATP (control), during the puff (ATP), as well as the change in fluorescence (dF). An average trace from all cells with the s.e.m. is also shown. g Representative hippocampal astrocyte in acute brain slice expressing iATPSnFR1.0 before the application of ATP (control), during the application of 3 mM ATP (ATP), and the dF. An average trace from all cells with the s.e.m. is also shown. h Scatter graph summary of the effect of 3 mM ATP on iATPSnFR1.0 expressed in the cell types indicated. In panel (h), the circle represents the mean, the box the s.e.m., the whiskers the s.d., and the horizontal line the median. p Values are shown for statistical comparisons to the buffer puff control using un-paired Student’s t tests. Abbreviations: hip hippocampus, SC spinal cord, MSNs medium spiny neurons. Note broken y-axis. In other panels, the error bars represent the s.e.m. and in some cases are smaller than the symbols used for the mean. n numbers are provided in the figure panels and refer to the number of cells
Fig. 6
Fig. 6
Characterization of cytosolic mRuby-iATPSnFR1.0. a Cartoon schematic of mRuby-iATPSnFR1.0: ATP binding is schematized to show an increase in cpSFGFP fluorescence, whereas mRuby fluorescence remains unchanged. b Dose–response curves for iATPSnFR1.0 in relation to mRuby-iATPSnFR1.0 in HEK293 cell lysates. c Changes in fluorescence of mRuby-iATPSnFR1.0 (green and red channels) before, during, and after inhibition of glycolysis with 2DOG in HEK293 cells. d Changes in fluorescence of mRuby-iATPSnFR1.0 (green and red channels) during oxygen-glucose deprivation in hippocampal brain slices. Data from astrocytes as well as CA1 pyramidal neuronal cell bodies and dendrites are shown. The error bars represent the s.e.m. and in some cases are smaller than the symbols used for the mean. n numbers are provided in the figure panels and refer to the number of cells
Fig. 7
Fig. 7
Assessments of how iATPSnFR1.0 was affected by pH. a–d Effect of pH on the unbound and ATP bound fluorescence of the indicated constructs. e, f Comparison of the effect of ATP on the fluorescence of the indicated constructs at pH 6.4 and 7.4. The error bars represent the s.e.m. and in some cases are smaller than the symbols used for the mean. n numbers are provided in the figure panels and refer to the number of cells in panel (a), and number of independent evaluations in (bf)

References

    1. Lohmann K. On the pyrophosphate fraction in muscle. Naturwissenschaften. 1929;17:624–625.
    1. Burnstock G, Verkhratsky A. Evolutionary origins of the purinergic signalling system. Acta Physiol. 2009;195:415–447. doi: 10.1111/j.1748-1716.2009.01957.x. - DOI - PubMed
    1. Holton FA, Holton P. The capillary dilator substances in dry powders of spinal roots; a possible role of adenosine triphosphate in chemical transmission from nerve endings. J. Physiol. 1954;126:124–140. doi: 10.1113/jphysiol.1954.sp005198. - DOI - PMC - PubMed
    1. Holton P. The liberation of adenosine triphosphate on antidromic stimulation of sensory nerves. J. Physiol. 1959;145:494–504. doi: 10.1113/jphysiol.1959.sp006157. - DOI - PMC - PubMed
    1. Burnstock G. Purinergic nerves. Pharmacol. Rev. 1972;24:509–581. - PubMed

Publication types

MeSH terms