. 2019 Feb 12;10(1):718.
doi: 10.1038/s41467-019-08636-w.

Soil carbon sequestration accelerated by restoration of grassland biodiversity

Affiliations

Soil carbon sequestration accelerated by restoration of grassland biodiversity

Yi Yang et al. Nat Commun. .

Abstract

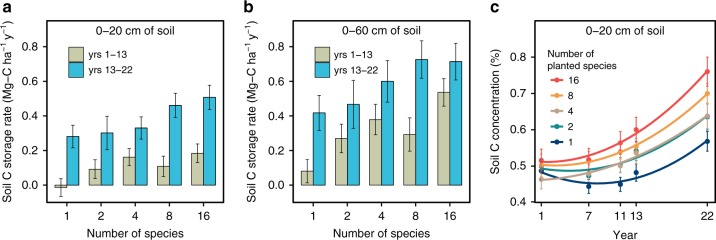
Agriculturally degraded and abandoned lands can remove atmospheric CO2 and sequester it as soil organic matter during natural succession. However, this process may be slow, requiring a century or longer to re-attain pre-agricultural soil carbon levels. Here, we find that restoration of late-successional grassland plant diversity leads to accelerating annual carbon storage rates that, by the second period (years 13-22), are 200% greater in our highest diversity treatment than during succession at this site, and 70% greater than in monocultures. The higher soil carbon storage rates of the second period (years 13-22) are associated with the greater aboveground production and root biomass of this period, and with the presence of multiple species, especially C4 grasses and legumes. Our results suggest that restoration of high plant diversity may greatly increase carbon capture and storage rates on degraded and abandoned agricultural lands.


Conflict of interest statement

The authors declare no competing interests.

Figures

Fig. 1
Fig. 1
Change in soil C over 22 years. a, b Average annual soil C storage rates over years 1–13 (green bars) and years 13–22 (blue bars) in upper 20 cm of soil (a) and in upper 60 cm (b) (Supplementary Table 1). Bars are means with standard errors. c Dynamics of soil C concentration in upper 20 cm of soil for plots planted with 1, 2, 4, 8, or 16 perennial grassland species (Supplementary Table 2). Dots are means with standard errors; fitted curves are quadratic
Fig. 2
Fig. 2
Change in root C over 24 years. a Change in root C in upper 30 cm of soil under different experimentally imposed levels of plant species diversity. Dots indicate mean root C at a given year; curves fitted with log functions; the number on each curve indicates plant species diversity. b Total root C storage after 24 years of growth in upper 60 cm of soil. Numbers in white indicate mean total root C storage, error bars indicate standard errors, and numbers in black indicate soil depth increments (cm)
Fig. 3
Fig. 3
Higher-diversity plots versus the best species in monoculture. a Soil C storage rate over the entire 22 years for the 0–60 cm soil profile. b Mean root biomass for the 0–60 cm soil profile (average of 2006, 2015, and 2017). c Mean productivity from 2012 to 2016. The numbers at the top of each panel are proportions of mixture plots surpassing the best performing monoculture species. Proportions increase with diversity for all three measures. Monocultures values are means of plots planted to a given species
Fig. 4
Fig. 4
Functional composition and traits influence root biomass and soil C storage. a Soil C storage rates over the entire 22 years for the 0–60 cm profile. b Mean root biomass for the 0–60 cm soil profile (average of 2006, 2015, and 2017). c Mean root biomass of different functional groups in monoculture plots (0–30 cm soil profile, average of 2006, 2015, and 2017). d Fine root decomposition percentage of different functional groups (measured after 10 months of field incubation, which included ~5 winter months). In all panels, bars are means with standard errors. In a and b, dots indicate plot results: C4—plots with at least one C4 but without legume; L—plots with at least one legume but without C4; C4 + L—plots with at least one C4 and one legume; Other—forbs, C3, or woody; HD—16-species plots, which include both C4 and legume (of typically 3–4 species each). In c and d for monoculture plots, L means legume

References

    1. Lal R. Soil carbon sequestration impacts on global climate change and food security. Science. 2004;304:1623–1627. doi: 10.1126/science.1097396. - DOI - PubMed
    1. Wei, X., Shao, M., Gale, W. & Li, L. Global pattern of soil carbon losses due to the conversion of forests to agricultural land. Sci. Rep. 4, 4062 (2015). - PMC - PubMed
    1. Davidson EA, Ackerman IL. Changes in soil carbon inventories following cultivation of previously untilled soils. Biogeochemistry. 1993;20:161–193. doi: 10.1007/BF00000786. - DOI
    1. Lal R. World cropland soils as a source or sink for atmospheric carbon. Adv. Agron. 2001;71:145–191. doi: 10.1016/S0065-2113(01)71014-0. - DOI
    1. Sanderman J, Hengl T, Fiske GJ. Soil carbon debt of 12,000 years of human land use. Proc. Natl Acad. Sci. 2017;114:9575–9580. doi: 10.1073/pnas.1706103114. - DOI - PMC - PubMed

Publication types