. 2019 Feb 12;10(1):714.
doi: 10.1038/s41467-019-08582-7.

Inhibition of upper small intestinal mTOR lowers plasma glucose levels by inhibiting glucose production

Affiliations

Inhibition of upper small intestinal mTOR lowers plasma glucose levels by inhibiting glucose production

T M Zaved Waise et al. Nat Commun. .

Abstract

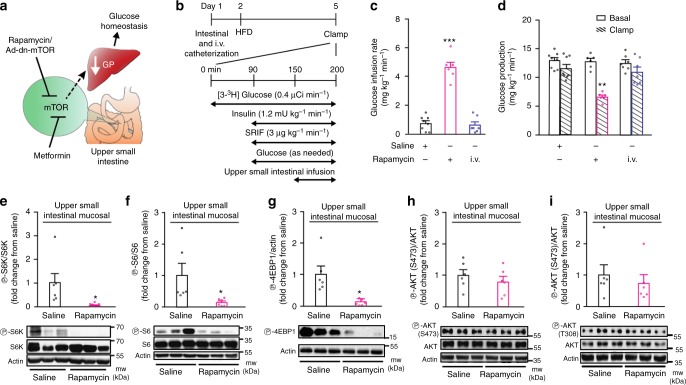
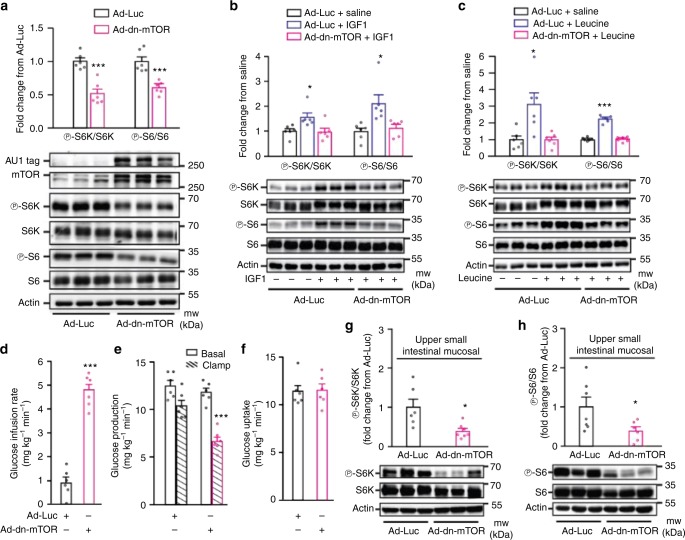
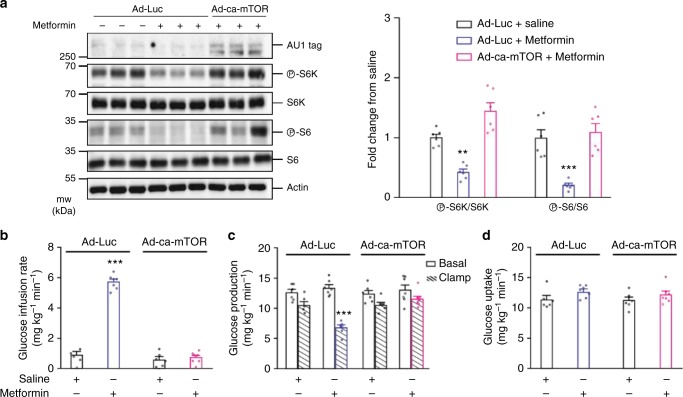
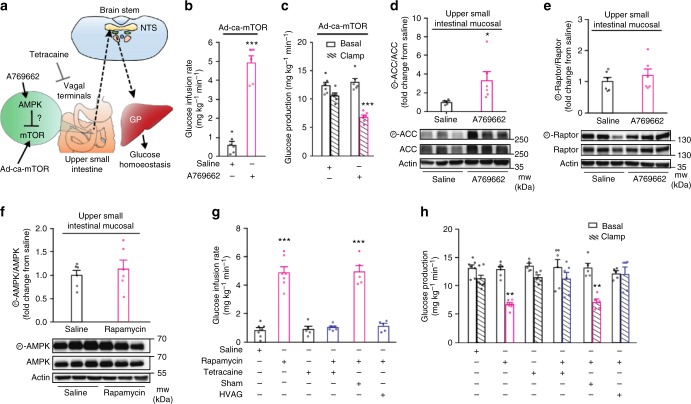
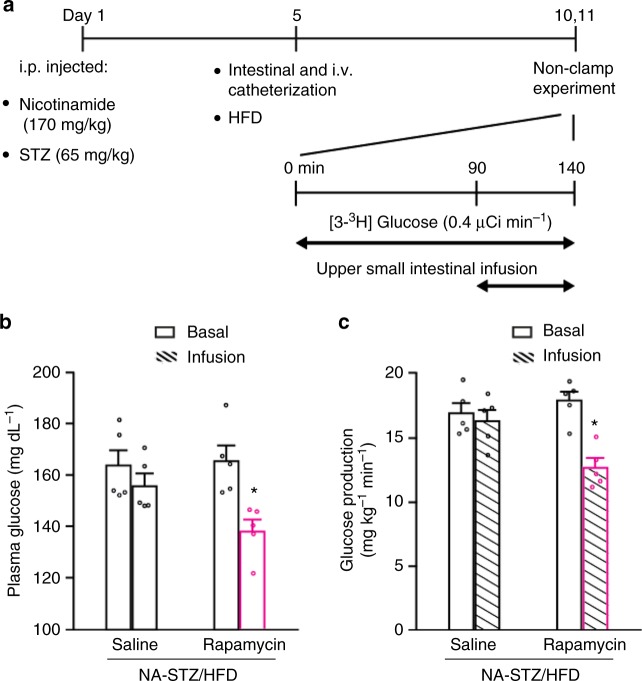
Glucose homeostasis is partly controlled by the energy sensor mechanistic target of rapamycin (mTOR) in the muscle and liver. However, whether mTOR in the small intestine affects glucose homeostasis in vivo remains unknown. Here, we first report that delivery of rapamycin or an adenovirus encoding the dominant negative acting mTOR-mutated protein into the upper small intestine is sufficient to inhibit small intestinal mTOR signaling and lower glucose production in rodents with high fat diet-induced insulin resistance. Second, we found that molecular activation of small intestinal mTOR blunts the glucose-lowering effect of the oral anti-diabetic agent metformin, while inhibiting small intestinal mTOR alone lowers plasma glucose levels by inhibiting glucose production in rodents with diabetes as well. Thus, these findings illustrate that inhibiting upper small intestinal mTOR is sufficient and necessary to lower glucose production and enhance glucose homeostasis, and thereby unveil a previously unappreciated glucose-lowering effect of small intestinal mTOR.


Conflict of interest statement

The authors declare no competing interests.

Figures

Fig. 1
Fig. 1
Upper small intestinal rapamycin infusion lowers glucose production and inhibits mTOR signaling. a Schematic representation of the working hypothesis. b Experimental procedure and pancreatic (basal insulin)–euglycemic clamp protocol. SRIF, somatostatin; µCi, microcurie. c, d The glucose infusion rate (c) and glucose production (d) during the clamp in HFD rats infused with upper small intestinal saline (n= 8) or rapamycin (n= 6) or with intravenous (i.v.) rapamycin (n= 7). **p< 0.01 or ***p< 0.001 vs. all other groups as determined by ANOVA with Tukey’s post hoc test. ei Quantitative analysis and representative western blot of phosphorylated S6K (e), S6 (f), 4EBP1 (g), AKT (S473) (h), and AKT (T308) (i) protein expression in the upper small intestinal mucosa of HFD rats infused for 50 min with upper intestinal saline or rapamycin. The phosphorylation level was quantified by densitometry and data are presented as fold increase in rapamycin (n= 6) over the saline (n= 6) treated samples. Actin, loading control. *p< 0.05 vs. saline as calculated by unpaired t-test. Values are shown as mean ± s.e.m.
Fig. 2
Fig. 2
Molecular inhibition of upper small intestinal mTOR lowers glucose production. ac Representative western blot and quantitative analysis of phosphorylated S6K and S6 protein expression normalized to their respective total in PC12 cells infected with Ad-dn-mTOR and treated with saline (a), IGF1 (b), or leucine (c) compare to cells infected with Ad-Luc and treated with saline. AU1, tag protein for mTOR construct; actin, loading control. a ***p < 0.001 as calculated by unpaired t-test (n = 6 for each group); b, c *p < 0.05 or ***p < 0.001 vs. all other groups as determined by ANOVA with Tukey’s post hoc test (n = 6 for each group). df The glucose infusion rate (d), glucose production (e), and glucose uptake (f) during the clamp in HFD-fed rats with upper small intestinal Ad-Luc (n = 6) or Ad-dn-mTOR (n = 6). ***p< 0.001 vs. Ad-Luc as calculated by unpaired t-test. g, h Quantitative analysis and representative western blot of phosphorylated S6K (g) and S6 (h) protein expression normalized to their respective total in the upper small intestinal mucosal tissue of HFD rats with either Ad-Luc (n = 6 for S6k, and 7 for S6) or Ad-dn-mTOR (n = 7 for S6k, and 6 for S6). *p < 0.05 vs. Ad-Luc as calculated by unpaired t-test. Actin, loading control. Values are shown as mean ± s.e.m.
Fig. 3
Fig. 3
Upper small intestinal mTOR inhibition is necessary for metformin action. a Representative western blot (left) and quantitative analysis (right) of phosphorylated S6K, and S6 protein expression normalized to their respective total protein expression in HEK293 cells infected with either Ad-Luc or Ad-ca-mTOR and then treated with saline or metformin for 12–16 h. AU1, tag protein for mTOR construct; Actin, loading control. **p< 0.01 or ***p< 0.001 vs. all other groups as determined by ANOVA with Tukey’s post hoc test (n = 6 for each group). bd Glucose infusion rate (b), glucose production (c), and glucose uptake (d) during the clamp in HFD-fed rats infected with either upper small intestinal Ad-Luc or Ad-ca-mTOR and infused with upper intestinal saline (n = 6 for each group) or metformin (n= 7 for each group). ***p< 0.001 vs. all other groups as determined by ANOVA with Tukey’s post hoc test. Values are shown as mean ± s.e.m.
Fig. 4
Fig. 4
Inhibition of upper small intestinal mTOR activates a gut–brain axis to lower hepatic glucose production. a Schematic representation of working hypothesis. b, c Glucose infusion rate (b) and glucose production (c) during the clamps in HFD rats infected with upper small intestinal Ad-ca-mTOR and infused with upper intestinal A769662 or saline. ***p< 0.001 vs. saline; determined by unpaired t-test (n = 6 for each group). d, e Quantitative analysis and representative western blot of phosphorylated ACC (d) and raptor (e) protein expression in the upper intestinal mucosa of Ad-ca-mTOR infected HFD rats infused with upper intestinal saline or A769662. Actin, loading control. *p< 0.05 vs. saline as calculated by unpaired t-test (n = 5 for saline, and 6 for A769662 in ACC, and 6/group in raptor). f Western blot of phosphorylated AMPK protein expression in the upper small intestinal mucosa of HFD rats infused with upper intestinal saline or rapamycin. Actin, loading control. *p< 0.05 vs. saline as calculated by unpaired t-test (n = 6 for each group). g, h Glucose infusion rate (g) and glucose production (h) during clamps in HFD rats infused with upper small intestinal saline (n = 7), rapamycin (n = 7), tetracaine (n = 5), rapamycin + tetracaine (n = 6), rapamycin + sham (n= 5) or hepatic vagal branch vagotomy (HVAG) (n= 5). **p < 0.01 or ***p < 0.001 vs. saline, tetracaine, tetracaine + rapamycin, and HVAG + rapamycin; determined by ANOVA with Tukey’s post hoc test. Values are shown as mean ± s.e.m.
Fig. 5
Fig. 5
Inhibition of upper small intestinal mTOR lowers glucose in diabetic rats. a Experimental procedure and non-clamp experimental protocol. b, c Plasma glucose levels (b) and glucose production (c) in NA–STZ/HFD-induced hyperglycemic rats infused with upper small intestinal saline or rapamycin. *p< 0.05 vs. saline as compared by unpaired t-test; n= 5 for each group. Values are shown as mean ± s.e.m.

Similar articles

Cited by

References

    1. Heitman J, Movva NR, Hall MN. Targets for cell cycle arrest by the immunosuppressant rapamycin in yeast. Science. 1991;253:905–909. doi: 10.1126/science.1715094. - DOI - PubMed
    1. Dennis PB, et al. Mammalian TOR: a homeostatic ATP sensor. Science. 2001;294:1102–1105. doi: 10.1126/science.1063518. - DOI - PubMed
    1. Li J, Kim SG, Blenis J. Rapamycin: one drug, many effects. Cell. Metab. 2014;19:373–379. doi: 10.1016/j.cmet.2014.01.001. - DOI - PMC - PubMed
    1. Zoncu R, Efeyan A, Sabatini DM. mTOR: from growth signal integration to cancer, diabetes and ageing. Nat. Rev. Mol. Cell Biol. 2011;12:21–35. doi: 10.1038/nrm3025. - DOI - PMC - PubMed
    1. Laplante M, Sabatini DM. mTOR signaling in growth control and disease. Cell. 2012;149:274–293. doi: 10.1016/j.cell.2012.03.017. - DOI - PMC - PubMed

Publication types