. 2019 Feb 12;10(1):708.
doi: 10.1038/s41467-018-07953-w.

Biallelic VARS variants cause developmental encephalopathy with microcephaly that is recapitulated in vars knockout zebrafish

Collaborators, Affiliations

Biallelic VARS variants cause developmental encephalopathy with microcephaly that is recapitulated in vars knockout zebrafish

Aleksandra Siekierska et al. Nat Commun. .

Abstract

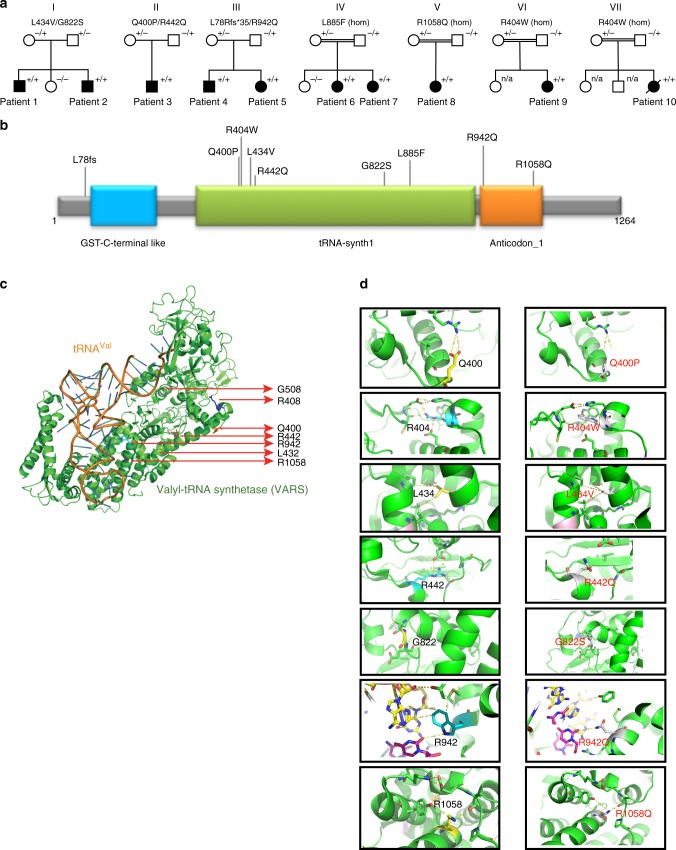
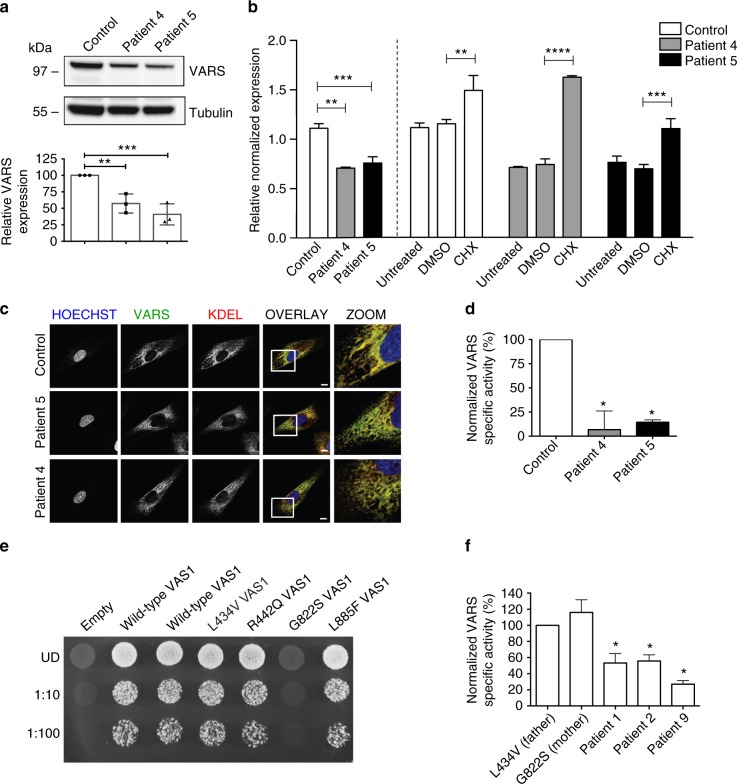
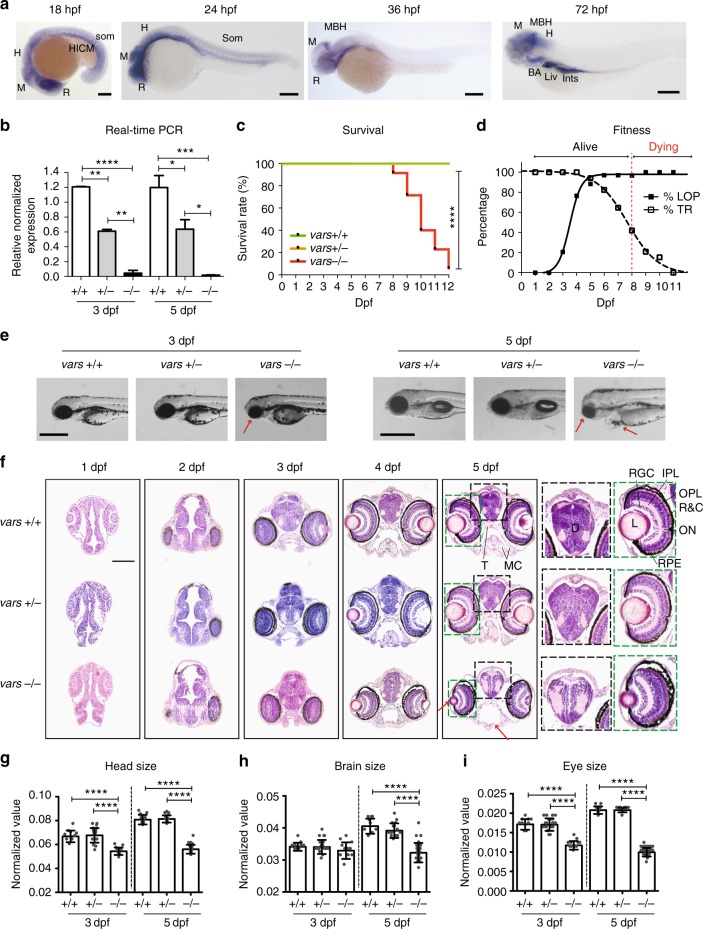
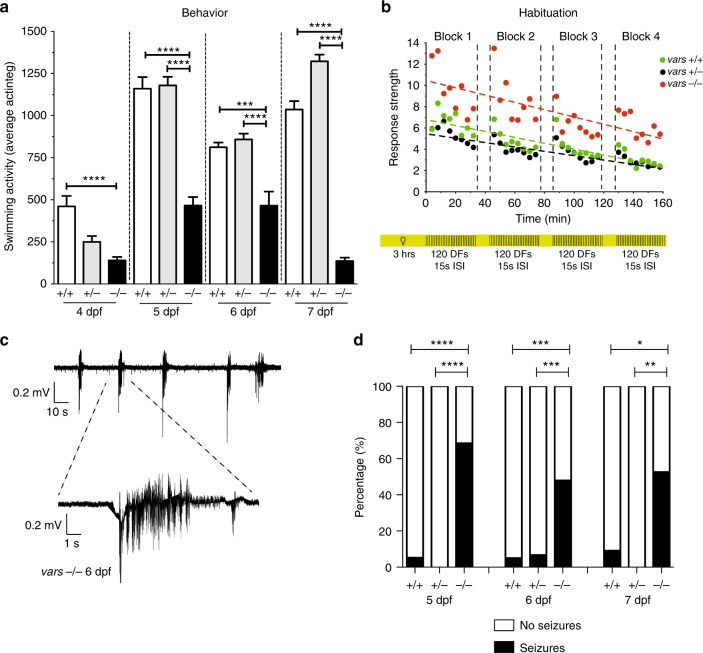
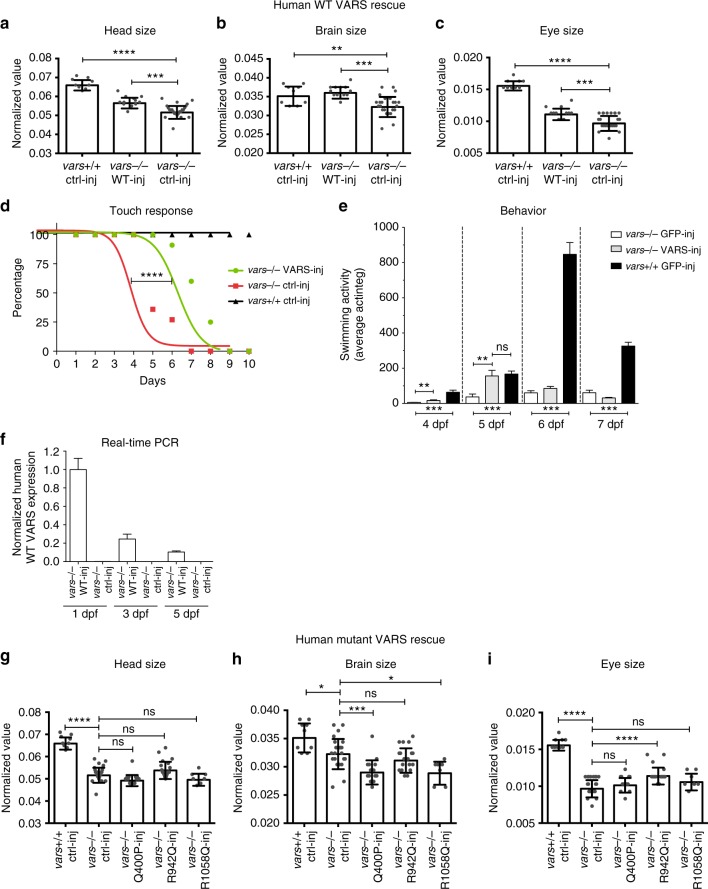
Aminoacyl tRNA synthetases (ARSs) link specific amino acids with their cognate transfer RNAs in a critical early step of protein translation. Mutations in ARSs have emerged as a cause of recessive, often complex neurological disease traits. Here we report an allelic series consisting of seven novel and two previously reported biallelic variants in valyl-tRNA synthetase (VARS) in ten patients with a developmental encephalopathy with microcephaly, often associated with early-onset epilepsy. In silico, in vitro, and yeast complementation assays demonstrate that the underlying pathomechanism of these mutations is most likely a loss of protein function. Zebrafish modeling accurately recapitulated some of the key neurological disease traits. These results provide both genetic and biological insights into neurodevelopmental disease and pave the way for further in-depth research on ARS related recessive disorders and precision therapies.


Conflict of interest statement

J.R.L. has stock ownership in 23andMe, is a paid consultant for Regeneron Pharmaceuticals, has stock options in Lasergen, Inc., is on the Scientific Advisory Board of Baylor Genetic (BG) and is a co-inventor on multiple United States and European patents related to molecular diagnostics for inherited neuropathies, eye diseases, and bacterial genomic fingerprinting. The Department of Molecular and Human Genetics at Baylor College of Medicine derives revenue from molecular genetic testing offered in the BG Laboratories. All the remaining authors declare no competing interests.

Figures

Fig. 1
Fig. 1
Identification of VARS variants in seven families with developmental encephalophaties and in silico predictions. a Pedigrees of the seven families diagnosed with VARS mutations. b Location of the identified VARS variants on protein level (InterPro/P26640). c Ribbon cartoon model of the Thermus thermophilus VARS-tRNA complex, highlighting the residues corresponding to those substituted in the human model. d Pair-wise comparisons between the wild-type (left) and mutant (right) residues for predicted changes in local contacts with tRNA or other amino acids. Hydrogen bonds were indicated as dotted yellow lines
Fig. 2
Fig. 2
In vitro studies support variant pathogenicity. a Western blot performed on patient-derived fibroblasts from patients 4 and 5 of family 3 carrying the L78Rfs*35/R942Q VARS variant showed almost 50% reduction in VARS protein. Values are mean of three separate experiments. Error bars represent SD. b RT-qPCR on the fibroblasts showed almost complete absence of the frameshift allele at mRNA level, treatment with cycloheximide caused a partial increase in expression of the frameshift allele, which was not seen with DMSO-treated control. Values are mean of three separate experiments performed in triplicate. Error bars represent SD. c Immunocytochemistry highlighted the nucleus (Hoechst), VARS and KDEL, a marker for endoplasmatic reticulum. VARS co-localizes with KDEL. There was no difference in localization between the control line and the patient fibroblasts. d VARS and TARS aminoacylation activity measured in extracts from the patient fibroblasts. The data were normalized to ATTC fibroblasts. VARS aminoacylation activity was measured in technical triplicate at three separate passages, and TARS activity was measured once in technical triplicate. Data are represented as mean-specific activity and error bars represent SEM. * indicates significant difference from control. e A haploid yeast strain deleted for endogenous VAS1 was transformed with a LEU2-bearing pRS315 vector containing wild-type VAS1, the indicated mutant form of VAS1, or no insert (empty). Cultures for each strain (labeled along the top) were either undiluted (UD) or diluted 1:10 or 1:100 and then spotted on solid medium containing 5-FOA to determine whether the VAS1 alleles complement loss of endogenous VAS1 at 30 °C. Only G822S shows absent growth indicating a functional null allele. f VARS and TARS aminoacylation activity measured in extracts from patient-derived lymphoblasts of patients 1 and 2 (L434V/G822S) and their parents and patient 9 (R404W). Data were normalized to the paternal cells. VARS aminoacylation activity was measured in technical triplicate at three separate passages, and TARS activity was measured once in technical triplicate. Data are represented as mean-specific activity and error bars represent SEM. * indicates significant difference from L434V paternal lymphoid cells. In a, b, d, and f one-way ANOVA with Tukey’s multiple comparisons test was used. Significant values are noted **p < 0.01, ***p < 0.001, and ****p < 0.0001
Fig. 3
Fig. 3
vars−/− larvae display severe developmental phenotype with early lethality. a Spatiotemporal expression patterns of vars by whole-mount RNA in situ hybridization at 18, 24, 36, and 72 hpf. BA Branchial Arches; H Hindbrain; HICM Hematopoietic Intermediate Cell Mass; Ints Intestine; Liv Liver; MBH Midbrain-Hindbrain boundary; M Midbrain; R Retina. Scale bars = 200 μm b RT-qPCR data demonstrating the expression of total vars in vars+/+, vars+/−, and vars−/− larvae at 3 and 5 dpf. Values are mean of three separate experiments performed in triplicate. c Kaplan–Meier survival curve of vars+/+ (n = 37), vars+/− (n = 82), and vars−/− (n = 34) larvae. d Graph illustrating changes in loss-of-posture and touch response of vars−/− larvae throughout the life span. Only the surviving larvae were included. e Representative lateral and dorsal bright-field images of 3 and 5 dpf vars+/+, vars+/−, and vars−/− larvae (scale bar, 500 μm). Pericardial edema, small eye, and periocular swelling around the eye were marked with arrows. f H&E histological staining of paraffin-embedded coronary sections from the forebrain of 1–5 dpf vars+/+, vars+/−, and vars−/− larvae (scale bar, 100 μm). Magnification of the disruption in the organization of the brain and the eye for 5 dpf vars+/+, vars+/−, and vars−/− was marked with black and green stripped line, respectively. Red arrows point out some structural abnormalities. D diencephalon; IPL inner plexiform layer; L lens; MC mandibular cartilage; ON optic nerve; OPL outer plexiform layer; R&C rods and cones; RGC retinal ganglion cell; T trabecula. gi Comparison of the individual measurements for head size g, brain size h, and eye size i for vars+/+, vars+/−, and vars−/− at 3 dpf (n = 9, n = 20 and n = 11, respectively) and 5 dpf (n = 9, n = 14 and n = 24, respectively). In b and gi one-way ANOVA with Tukey’s multiple comparisons test was used. Values are mean of three separate experiments. In c log-rank (Mantel-Cox) test was used. Error bars represent SD. Significant values are noted as ***p < 0.001 and ****p < 0.0001
Fig. 4
Fig. 4
vars−/− larvae show cognitive deficits and spontaneous seizure like behavior. a Behavioral activity (average total movement) of vars+/+ (n = 58), vars+/− (n = 108), and vars−/− (n = 58) larvae from 4 to 7 dpf expressed in actinteg units. Values are mean of three separate experiments. b Habituation assay performed on 6 dpf vars+/+ (n = 19), vars+/− (n = 47), and vars−/− (n = 30) larvae was composed of four blocks with 120 DFs with 15 s ISI (regions with black and yellow stripes), alternated by 10 min of light (yellow areas). The linear slopes between the actinteg responses were calculated (dotted lines) and compared between the different genotype groups (green circles—vars+/+, black circles—vars+/−, and red circles—vars−/−). DF dark flashes, ISI interstimulus intervals. Values are mean of two separate experiments. c Representative recording from optic tectum of 6 dpf vars−/− larva displaying polyspike discharges. Top trace represents typical pattern of epileptiform activity. Bottom trace shows magnification of the epileptiform event. d Percentage of larvae exhibiting spontaneous electrographic activity recorded from 5 dpf vars+/+ (n = 19), vars+/− (n = 31), and vars−/− (n = 35), 6 dpf vars+/+ (n = 20), vars+/− (n = 30) and vars−/− (n = 48) and 7 dpf vars+/+ (n = 12), vars+/− (n = 13) and vars−/− (n = 19) larvae. Abnormal brain activity was observed in 68.57% (24/35) 5 dpf vars−/−, 5.26% (1/19) 5 dpf vars+/+, 47.62% (23/48) 6 dpf vars−/−, 5% (1/20) 6 dpf vars+/+, 6.67% (2/30) vars+/−, 52.63% (10/19) 7 dpf vars−/− and 8.33% (1/12) 7 dpf vars+/+. In a and b one-way ANOVA with Tukey’s multiple comparisons test was used. In d—Fisher’s exact test was used. Significant values are noted *p < 0.05, **p < 0.01, ***p < 0.001, and ****p < 0.0001. Error bars represent SD
Fig. 5
Fig. 5
Wild-type human VARS mRNA partially rescues early zebrafish phenotype, whereas mutated constructs do not. ac Comparison of the individual measurements for head size a, brain size b, and eye size c for WT human VARS-injected vars−/− larvae (n = 12). GFP-injected vars+/+ larvae (n = 9) were used as a positive control, whereas GFP-injected vars−/− larvae (n = 24) served as a negative control. Values are mean of three separate experiments. d Curves illustrating the evolution of touch response during the life span of vars−/− larvae injected with WT human VARS (n = 12) and GFP mRNA (n = 11) (negative control). vars−/− GFP-injected larvae were used as a positive control. e Average total movement of WT human VARS-injected (n = 10) and GFP-injected (n = 9) vars−/− larvae from 3 to 7 dpf. vars+/+ GFP-injected larvae (n = 14) were used as a control. f RT-qPCR data demonstrating expression levels of injected human WT VARS in vars−/− larvae at 1, 3, and 5 dpf. At 3 and 5 dpf there was 24.55% and 10.42% WT VARS mRNA left, respectively, in comparison to 1 dpf. Values are mean of three separate experiments performed in triplicate. gi Comparison of the individual measurements for head size g, brain size h, and eye size i for human mutated Q400P (n = 15), R942Q (n = 18) and R1058Q (n = 7) VARS-injected vars−/− larvae. GFP-injected WT larvae (n = 9) were used as a positive control, whereas GFP-injected vars−/− larvae (n = 24) served as a negative control. Values are mean of three separate experiments. In ac and gi one-way ANOVA with Tukey’s multiple comparisons test was used; in d—log-rank (Mantel-Cox) test; in e—unpaired t-test. Significant values are noted *p < 0.05, **p < 0.01, ***p < 0.001, and ****p < 0.0001. Error bars represent SD

References

    1. Antonellis A, Green ED. The role of aminoacyl-tRNA synthetases in genetic diseases. Annu. Rev. Genom. Hum. Genet. 2008;9:87–107. doi: 10.1146/annurev.genom.9.081307.164204. - DOI - PubMed
    1. Meyer-Schuman, R. & Antonellis, A. Emerging mechanisms of aminoacyl-tRNA synthetase mutations in recessive and dominant human disease. Hum. Mol. Genet.26, R114–R127 (2017). - PMC - PubMed
    1. Nagao A, Suzuki T, Katoh T, Sakaguchi Y, Suzuki T. Biogenesis of glutaminyl-mt tRNAGln in human mitochondria. Proc. Natl Acad. Sci. USA. 2009;106:16209–16214. doi: 10.1073/pnas.0907602106. - DOI - PMC - PubMed
    1. Ling J, Reynolds N, Ibba M. Aminoacyl-tRNA synthesis and translational quality control. Annu. Rev. Microbiol. 2009;63:61–78. doi: 10.1146/annurev.micro.091208.073210. - DOI - PubMed
    1. Guo M, Schimmel P. Essential nontranslational functions of tRNA synthetases. Nat. Chem. Biol. 2013;9:145–153. doi: 10.1038/nchembio.1158. - DOI - PMC - PubMed

Publication types

MeSH terms

Substances