. 2019 Feb 12;9(1):1820.
doi: 10.1038/s41598-018-38080-7.

Dendritic cell targeted Ccl3- and Xcl1-fusion DNA vaccines differ in induced immune responses and optimal delivery site

Affiliations

Dendritic cell targeted Ccl3- and Xcl1-fusion DNA vaccines differ in induced immune responses and optimal delivery site

Anna Lysén et al. Sci Rep. .

Erratum in

Abstract

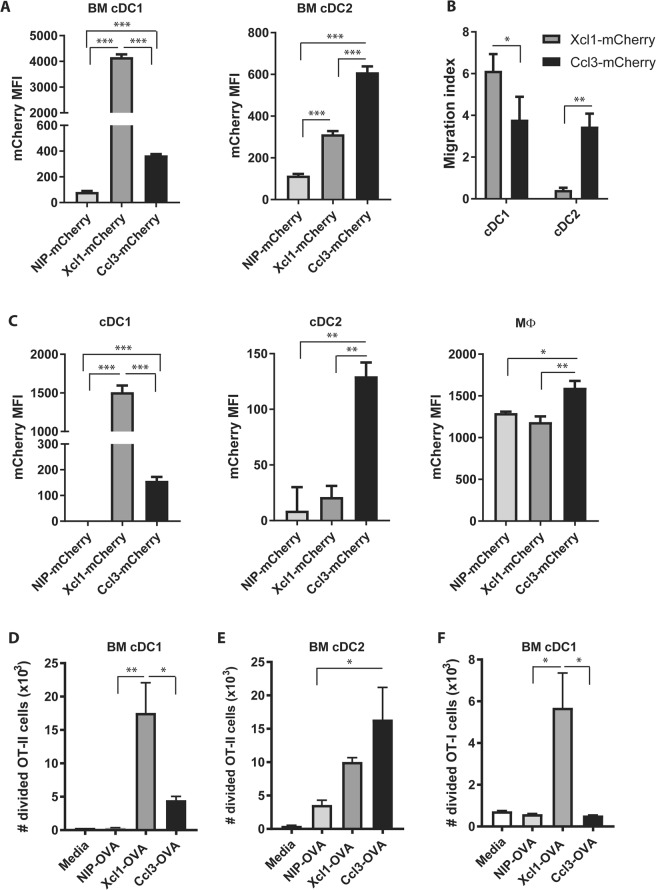
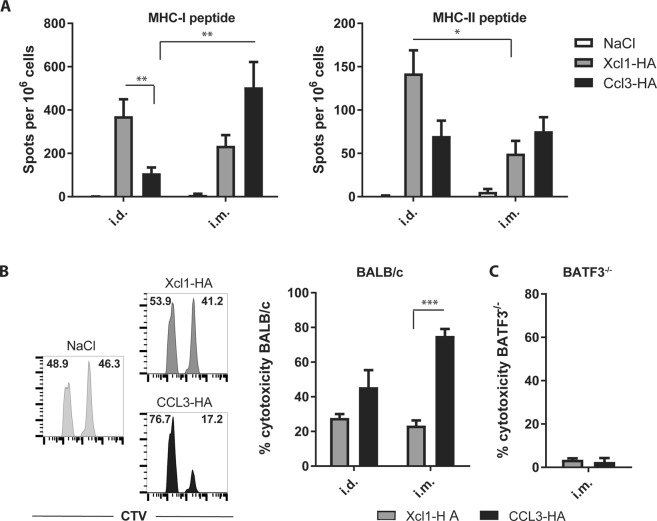
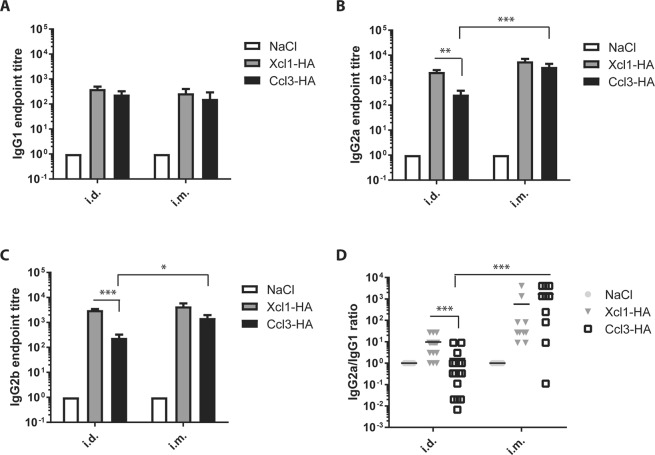
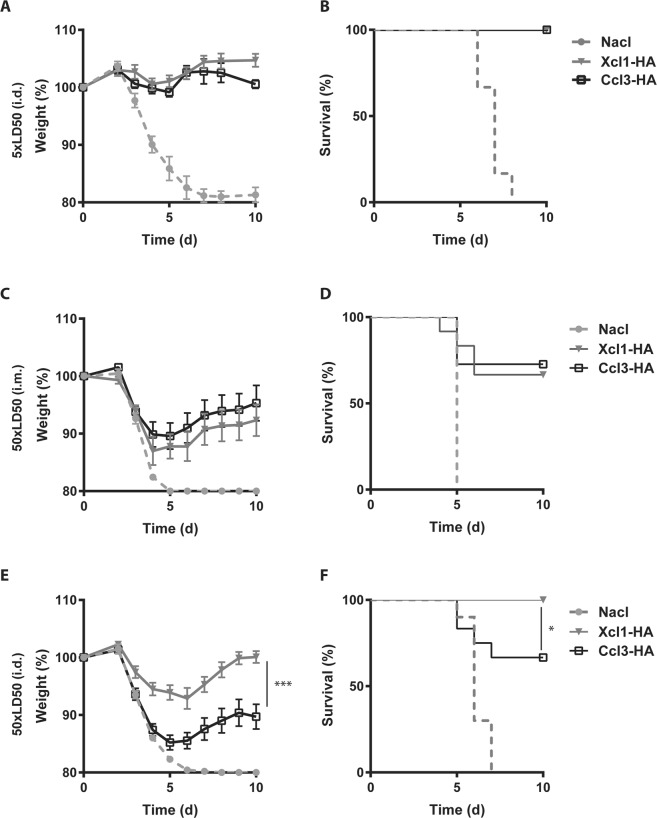
Fusing antigens to chemokines to target antigen presenting cells (APC) is a promising method for enhancing immunogenicity of DNA vaccines. However, it is unclear how different chemokines compare in terms of immune potentiating effects. Here we compare Ccl3- and Xcl1-fusion vaccines containing hemagglutinin (HA) from influenza A delivered by intramuscular (i.m.) or intradermal (i.d.) DNA vaccination. Xcl1 fusion vaccines target cDC1s, and enhance proliferation of CD4+ and CD8+ T cells in vitro. In contrast, Ccl3 target both cDC1 and cDC2, but only enhance CD4+ T cell proliferation in combination with cDC2. When Ccl3- or Xcl1-HA fusion vaccines were administered by i.m. DNA immunization, both vaccines induced Th1-polarized immune responses with antibodies of the IgG2a/IgG2b subclass and IFNγ-secreting T cells. After i.d. DNA vaccination, however, only Xcl1-HA maintained a Th1 polarized response and induced even higher numbers of IFNγ-secreting T cells. Consequently, Xcl1-HA induced superior protection against influenza infection compared to Ccl3-HA after i.d. immunization. Interestingly, i.m. immunization with Ccl3-HA induced the strongest overall in vivo cytotoxicity, despite not inducing OT-I proliferation in vitro. In summary, our results highlight important differences between Ccl3- and Xcl1- targeted DNA vaccines suggesting that chemokine fusion vaccines can be tailor-made for different diseases.


Conflict of interest statement

The TTO office of Oslo University and Oslo University Hospital has filed several patents on the use of Vaccibodies, on which B.B. is an inventor. B.B. is head of the scientific advisory board of the Vaccibody Company and holds shares in the company. The authors declare that there are no additional competing interests.

Figures

Figure 1
Figure 1
Characterization of Ccl3- and Xcl1-fusion vaccines. (A) BM DCs were incubated for 18 h with 0.5 μg Ccl3-, Xcl1- or anti-NIP-mCherry, and specific staining of cDC1 and cDC2 evaluated by flow cytometry after gating as indicated in Supplementary Fig. S1B. (B) Chemotaxis of BM DC were evaluated in transwell plates with 1.5 μg/ml Ccl3-, Xcl1- or anti-NIP-mCherry added to the bottom well. Migrated cells were identified as cDC1 or cDC2 by flow cytometry. The number of migrated cells were normalized to the number of spontaneously migrated cell when only medium was added to the bottom well. (C) In vivo targeting of APC. BALB/c mice were injected i.v. with 20 μg Ccl3-, Xcl1- or anti-NIP-mCherry. Spleens were harvested after 2 h and the mCherry staining of cDC1, cDC2 and macrophages analyzed by flow cytometry after gating as described in Supplementary Fig. S1D. (D,E) Proliferation of OT-II (D) and OT-I (E) cells after 4 days incubation with cDC1 or cDC2 and NIP-, Ccl3- or Xcl1-OVA. Number of proliferating cells was determined by CTV dye dilution by flow cytometry. Data shown are mean + SEM and representative of 2 independent experiments with (A) 6 replications or (B,D,E) 3 replications pr. group, or (C) 3 mice pr. group. Statistical analysis performed using (A,C) one-way ANOVA with Tukey’s multiple comparison test, (B) t-test, *p < 0.05, **p < 0.01, ***p < 0.001.
Figure 2
Figure 2
T cell responses after i.m. or i.d. DNA immunization. (A) IFNγ ELISPOT on splenocytes harvested from BALB/c mice 2 weeks after a single i.m. or i.d. immunization with plasmids encoding Xcl1-HA or Ccl3-HA. Splenocytes were stimulated with 2 μg/ml (left graph) IYSTVASSL (MHC-I restricted) or (right graph) HNTNGVTAACSHEG (MHC-II restricted) peptides. (B) In vivo cytotoxicity of BALB/c splenocytes pulsed with IYSTVASSL (CTVhigh) or a control peptide (DSSLQDGEFI) (CTVlow) before i.v. injection into BALB/c mice immunized two weeks prior with Xcl1-HA or CCL3-HA by i.m. or i.d. immunization. Representative histograms after i.m. DNA immunization are dispayed on the left. Percentage of CTVlow and CTVhigh cells are indicated within each histogram. The cytotoxicity data is summarized in the right graph. (C) Cytotoxicity assay as in (B) performed in BATF3 knockout mice i.m. immunized with Xcl1-HA or Ccl3-HA. (A) pooled from 3 independent experiments with 12–13 mice pr group, (B) pooled from 2 independent experiments with n = 10 mice pr group, and (C) data from one experiment with n = 4 mice pr group. Statistical analysis performed using non-parametric one-way ANOVA with Dunn’s multiple comparison test, *p < 0.05, **p < 0.01, ***p < 0.001.
Figure 3
Figure 3
Antibody responses after a single intramuscular (i.m.) or intradermal (i.d.) DNA immunization with Xcl1- and Ccl3-fusion vaccines containing influenza virus hemagglutinin. (A–C) Serum titers of IgG1 (A), IgG2a (B) and IgG2b (C) from BALB/c mice 2 weeks after a single i.m. or i.d. immunization with plasmids encoding Xcl1-HA or Ccl3-HA. D) IgG2a/IgG1 ratio of mice presented in A and B. (A–D) data presented are pooled from two independent experiments with n = 12–16 mice pr group. Statistical analysis performed using non-parametric one-way ANOVA with Dunn’s multiple comparison test, *p < 0.05, **p < 0.01, ***p < 0.001.
Figure 4
Figure 4
Xcl1-HA induces superior protection against a high dose of influenza virus after i.d. DNA immunization. (A) BALB/c mice  were challenged with 5xLD50 influenza A virus (PR8) 2 weeks after a single i.d. DNA immunization with Ccl3-HA or Xcl1-HA. Weight loss was monitored over time as a sign of disease progression. (B) Survival plot of the mice presented in A. (C) BALB/c mice were vaccinated once by i.m. DNA immunization with 50 μg plasmid encoding Xcl1-HA or Ccl3-HA and subsequently challenged with 50xLD50 influenza A virus (PR8) after 2 weeks. (D) Survival plot of mice presented in C. (E) BALB/c mice were immunized by i.d. DNA immunization with 25 μg plasmid encoding Xcl1-HA or Ccl3-HA and challenged with 50xLD50 PR8 after 2 weeks. (F) Survival plot of the mice presented in E. Data shown are from one single experiment with 6 mice pr group (A and B), or pooled from 2 independent experiments with 11–12 mice per group (C–F). Statistic analysis was performed using 2-way-anova (A,C and E), or Mantel Cox (B,D and F), *p < 0.05, ***p < 0.001.

References

    1. Aihara H, Miyazaki J. Gene transfer into muscle by electroporation in vivo. Nat Biotechnol. 1998;16:867–870. doi: 10.1038/nbt0998-867. - DOI - PubMed
    1. Biragyn A, Tani K, Grimm MC, Weeks S, Kwak LW. Genetic fusion of chemokines to a self tumor antigen induces protective, T-cell dependent antitumor immunity. Nat Biotechnol. 1999;17:253–258. doi: 10.1038/6995. - DOI - PubMed
    1. Kastenmuller W, Kastenmuller K, Kurts C, Seder RA. Dendritic cell-targeted vaccines–hope or hype? Nature reviews. Immunology. 2014;14:705–711. doi: 10.1038/nri3727. - DOI - PubMed
    1. Fredriksen AB, Bogen B. Chemokine-idiotype fusion DNA vaccines are potentiated by bivalency and xenogeneic sequences. Blood. 2007;110:1797–1805. doi: 10.1182/blood-2006-06-032938. - DOI - PubMed
    1. Grodeland G, Mjaaland S, Tunheim G, Fredriksen AB, Bogen B. The specificity of targeted vaccines for APC surface molecules influences the immune response phenotype. PloS one. 2013;8:e80008. doi: 10.1371/journal.pone.0080008. - DOI - PMC - PubMed

Publication types

LinkOut - more resources