. 2019 Feb 12;9(1):1835.
doi: 10.1038/s41598-018-38455-w.

Cdh2 coordinates Myosin-II dependent internalisation of the zebrafish neural plate

Affiliations

Cdh2 coordinates Myosin-II dependent internalisation of the zebrafish neural plate

Claudio Araya et al. Sci Rep. .

Erratum in

Abstract

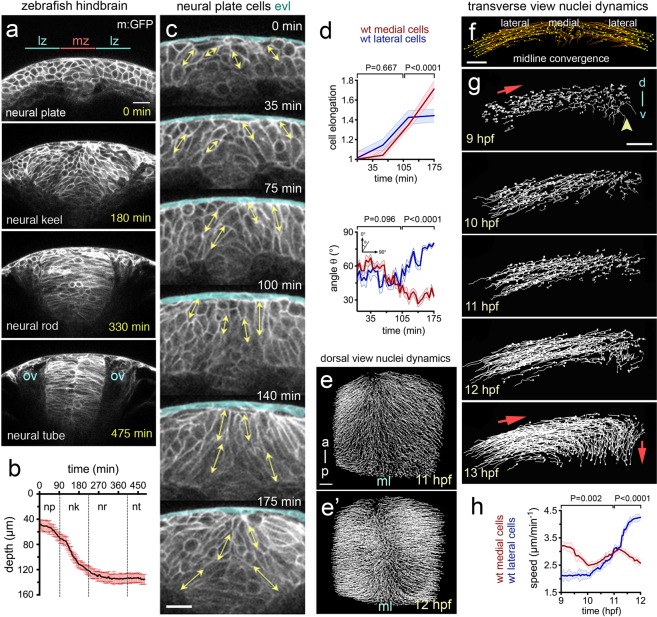
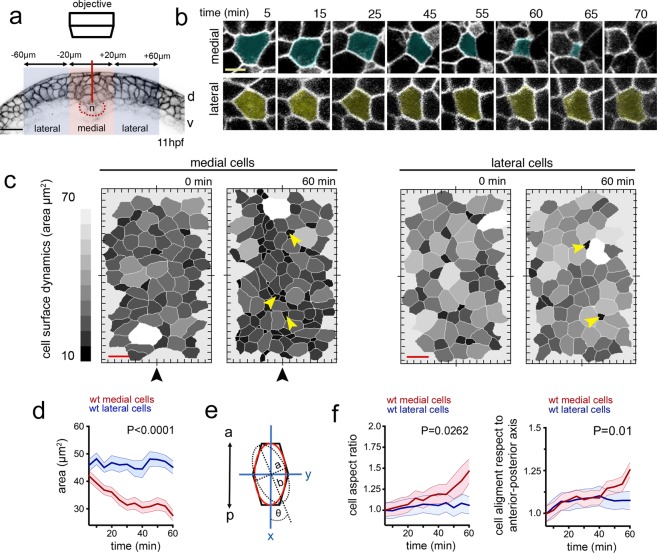
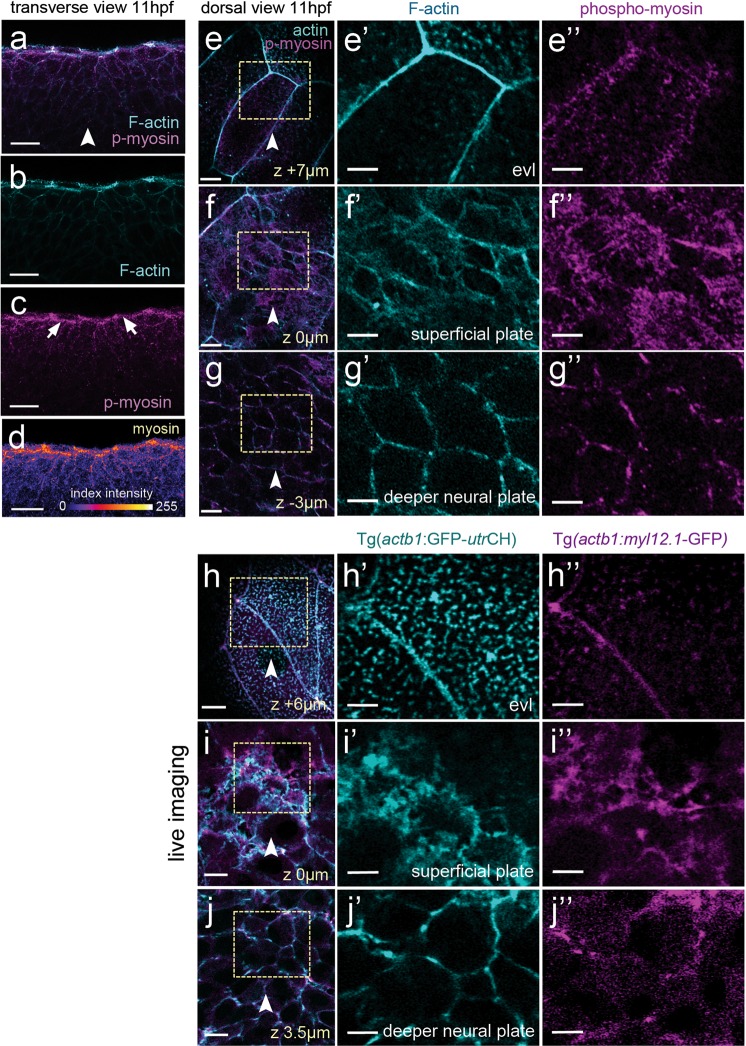
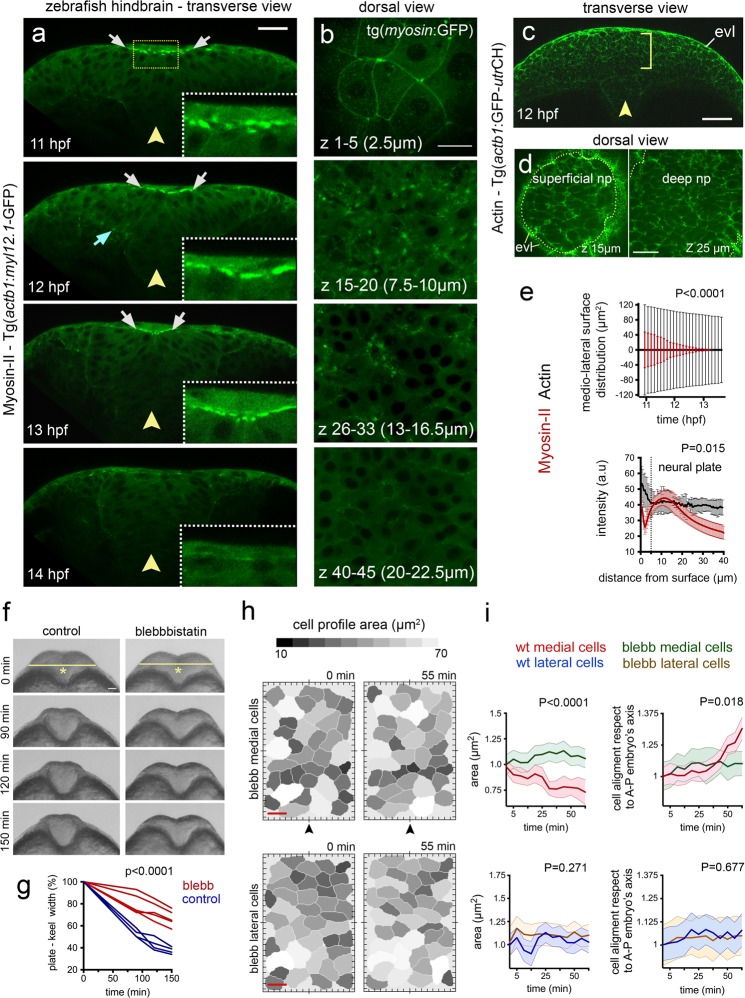
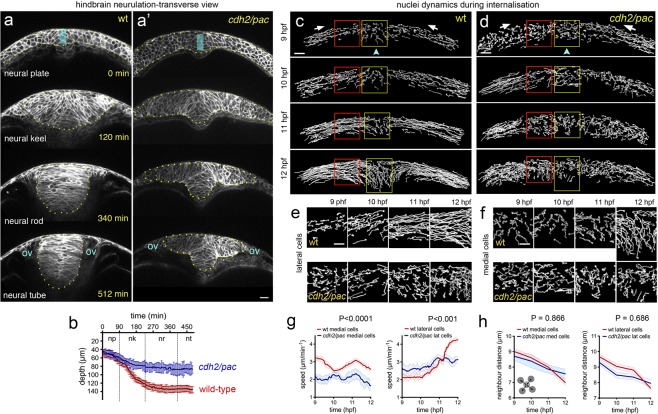
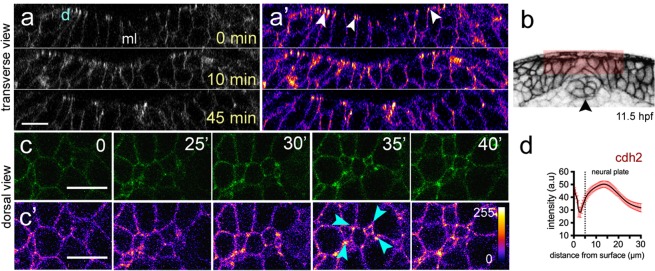
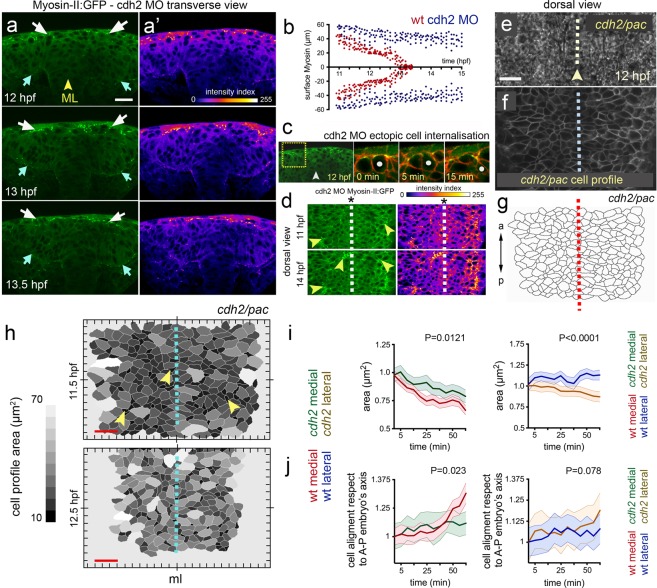
Tissue internalisation is a key morphogenetic mechanism by which embryonic tissues generate complex internal organs and a number of studies of epithelia have outlined a general view of tissue internalisation. Here we have used quantitative live imaging and mutant analysis to determine whether similar mechanisms are responsible for internalisation in a tissue that apparently does not have a typical epithelial organisation - the zebrafish neural plate. We found that although zebrafish embryos begin neurulation without a conventional epithelium, medially located neural plate cells adopt strategies typical of epithelia in order to constrict their dorsal surface membrane during cell internalisation. Furthermore, we show that Myosin-II activity is a significant driver of this transient cell remodeling which also depends on Cdh2 (N-cadherin). Abrogation of Cdh2 results in defective Myosin-II distribution, mislocalised internalisation events and defective neural plate morphogenesis. Our work suggests Cdh2 coordinates Myosin-II dependent internalisation of the zebrafish neural plate.


Conflict of interest statement

The authors declare no competing interests.

Figures

Figure 1
Figure 1
Cell and tissue dynamics during zebrafish neural plate internalisation. (a) Four transverse view confocal images depicting the neural plate, keel, rod and tube stages of wild-type zebrafish neurulation at hindbrain levels. Cells membranes labelled with CAAX-GFP. Scale bar is 20 µm and OV indicates otic vesicle as hindbrain landmark. The medial zone (mz) and lateral zone (lz) of the neural plate are indicated in (a) and each is 20 µm wide. (b) Time course showing depth of the neural anlage at the midline. Internalisation deepens the neural anlage by approximately 300% in the plate to keel transition (initial thickness ~42 µm on average vs final thickness ~138 µm on average, nembryos = 4). np, neural plate; nk, neural keel; nr, neural rod; and nt, neural tube. (c) Frames from transverse view time-lapse to illustrate cell profile changes during plate to keel transition. Double headed arrows illustrate examples of measurements of the long axis of cells used to quantify cell elongation. EVL (enveloping cell layer) is highlighted in pale blue. (d) Quantification of cell elongation and cell angle in medial and lateral zones during plate to keel transition. (e and e’) Projected views from dorsal surface of nuclei tracks at 11 hpf and 12 hpf. Nuclei tracked from movies of cells labelled with H2B-GFP. (f) Transverse view image of nuclei tracked during convergence to midline (10.5 hpf). Scale bar, 20 µm. (g) Transverse views of nuclei tracks of neural plate dynamics during convergence and internalisation (9–13 hpf, for simplicity only half of the neural plate is illustrated). Red arrows indicate tissue movement, and arrowhead indicates midline position. D, indicates dorsal, while v, indicates ventral. (h) Quantification of nuclei speeds for medial and lateral cells during convergence and internalisation (nembryos = 3, naverage of medial cells analysed = 90, naverage of lateral cells analysed = 80, 5 z-slice analysed in each embryo).
Figure 2
Figure 2
Dorsal cell surface dynamics during internalisation. (a) Schematic of the imaging approach to visualise dorsal cell surface profile during convergence and internalisation. Inverted LUT image depicts cell membrane outlines. D is dorsal, v is ventral, and n is notochord. Scale bar is 20 µm. (b) Tangential z-slices 5–7 µm below EVL were selected for automated segmentation of dorsal surface of superficial neural plate cells. Top panels: image of dorsal surface of medial cell over time (pseudocoloured in cyan). Bottom panels: images of dorsal surface of lateral cell over time (pseudocoloured in yellow). Scale bar, 5 µm and time is in minutes. (c) Dorsal surface profiles of medial and lateral populations of cells one hour apart. For simplicity only half of the neural plate is shown. Colour code indicates relative dorsal surface profile area in µm2, darker greys are smaller than lighter greys. Black arrowhead indicates midline position. Scale bar, 10 µm. (d) Mean dorsal surface area of medial (red) and lateral (blue) cells over time (nembryos = 4 wt analysed, P < 0.0001). (e) Schematic representation of a cell’s dorsal surface area to illustrate cell aspect ratio and alignment of this surface area to the anteroposterior axis of the embryo. (f) Quantification of surface aspect ratio and alignment to embryonic axis. In all graphs error bars indicate SEM.
Figure 3
Figure 3
Myosin and actin in the neural plate. (a–d) Transverse confocal section of neural plate stained for phosho-myosin and F-actin. (e,e”) Horizontal confocal section through EVL stained for phospho-myosin and F-actin. (f,f”) Horizontal confocal section at level of dorsal surface of neural plate cells stained for phospho-myosin and F-actin. (g,g”) Horizontal confocal section 3 µm below level of dorsal surface of neural plate cells stained for phospho-myosin and F-actin. (h–j”) Myosin and actin revealed in living neural plate by Tg(actb1:myl12.1-GFP) and Tg(actb1:GFP-utrCH) transgenic embryos. Sections equivalent to panels (e–g”). Scale bars are 5 µm.
Figure 4
Figure 4
Myosin distribution and function during convergence and internalisation. (a)Transverse confocal images depicting the distribution of the Myosin-II:GFP fusion protein using Tg(actb1:myl12.1-GFP) transgenic line during zebrafish neural plate internalisation. White arrows in (a) indicate medial accumulation of Myosin-II:GFP, while cyan arrow shows basal accumulation. Insets show dorsal medial zone at higher magnification. Yellow arrowheads indicate midline position. Scale bar is 20 µm. (b) Dorsal view confocal images of Myosin-II:GFP expression at different depths. Top image is in EVL (the superficial non-neural epithelium), then successive depths through the neural plate. Each image is a maximum intensity projection of 5 confocal slices. Scale bar, 10 µm. (c) Representative transverse view confocal images showing actin expression by using zebrafish Tg(actb1:GFP-utrCH) reporter line during early internalisation. Arrowhead shows midline and brackets indicate superficial-deep axis for quantification in (e, bottom graph). Scale bar, 30 µm and arrowhead indicates midline. (d) Dorsal view confocal images of Actin:GFP distribution at dorsal surface of neural plate and 10 µm deeper. Scale bar is 20 µm. (e) Top graph: quantification of medio-lateral surface distribution of Myosin-II:GFP (red) versus Actin:GFP (black) throughout internalisation. Bottom graph: quantification of Myosin-II:GFP (red) and Actin:GFP (black) pixel intensity distribution along the superficial (EVL first 5 µm) to deeper (ventral) axis of the neural plate (see methods for quantification procedure). A.U, indicates arbitrary units. (f) Transverse views of neural morphogenesis in control and Blebbistatin treated embryos. Scale bar is 20 µm. (g) Quantification of neural plate to keel transition in control and Blebbistatin treated embryos. (h) Dorsal cell surface profiles in medial and lateral zones of neural plate in control and Blebbistatin treated embryos. Scale bar, 10 µm and time is in minutes. Arrowheads indicate position of the tissue midline. (i) Quantification of dorsal cell surface profiles and alignment of dorsal surface areas to embryonic axis in control and Blebbistatin treated embryos (nembryos = 3, nmedial cells = 35, nlateral cells = 40). In all graphs, bars indicate SEM.
Figure 5
Figure 5
Defective cell and tissue internalisation in cdh2/pac mutants. (a-a’) Transverse confocal time-lapse images of tissue internalisation between wild-type (a) and cdh2/pac mutant (a’) embryos at hindbrain level. Cell membranes labelled with CAAX-GFP. ov, otic vesicle. Yellow dots outline neural tissue. (b) Comparative internalisation dynamics between wild-type (red) and cdh2/pac (blue) embryos as measured by depth of the neural primordium at its midline (cyan bar in a,a’). While in wild-type embryos, internalisation is responsible to deepens up to 70% of the neural primordium (~42 µm/~138 µm on average), cdh2/pac mutants average only 62% to wt values (~44 µm/~85 µm, nembryos = 4 cdh2/pac. Average depth; 85 µm cdh2/pac vs 138 µm wt). (c and d) Representative transverse images of nuclei tracks in wild-type (c) and cdh2/pac (d) neural plate cells during convergence and internalisation stages. Cdh2/pac nuclei show defective convergence and internalisation. (e) Higher magnification of lateral nuclei tracks taken from red boxes in (c,d). (f) Higher magnification of medial nuclei tracks taken from yellow boxes in (c,d). (g,h) Quantification of nuclei speeds and density between wild-type and cdh2/pac (nembryos = 3, naverage of medial cells analysed = 90, naverage of lateral cells analysed = 80, 5 z-slices analysed in each embryo). Scale bar in (a-f), 20 µm. Bars indicate SEM.
Figure 6
Figure 6
Cdh2 distribution during neural plate internalisation. (a,a’) Confocal transverse plane views of Cdh2-GFP at the dorsal surface of the neural plate. Cdh2-GFP is expressed throughout the cell membranes but is enriched at the dorsal surface (arrowheads). d, indicates dorsal surface. (b) Diagram indicating location of transverse views shown in (a,a’). (c,c’) Time-lapse frames of confocal images in dorsal view of the dorsal surface of the neural plate show that Cdh2-GFP is enriched at superficial surface in neural plate cells and at multi-cell interfaces. Fire lookup table indicating intensity values (0–255) in (c’). (d) Quantification of Cdh2-GFP intensity at different depths of the neural plate (nembryos = 4). Scale bars, 10 µm.
Figure 7
Figure 7
Cdh2 is required to organise midline Myosin-II during internalisation. (a) Frames from a transverse confocal time-lapse showing surface distribution of Myosin-II:GFP during cdh2 MO deficient neural plate internalisation (left panel). White arrows show surface Myosin-II:GFP distribution, while cyan arrows indicate basal Myosin-II:GFP accumulation. (a’) Fire lookup table indicating intensity values (0–255). (b) Comparative quantification of medio-lateral surface Myosin-II:GFP distribution between wild-type (red) and cdh2 MO (blue) during internalisation (nembryos = 5 wt, 4 cdh2 MO, P < 0.0001). (c) Representative example of ectopic cell internalisation in cdh2 MO (nembryos = 3, nectopic cells internalisation = 28). (d) Left panels: single dorsal confocal frames showing abnormal midline Myosin-II:GFP distribution in cdh2 MO embryos (arrowheads). Right panels: fire lookup table, showing intensity profile. Dashed line represent midline. (eg) Dorsal picture of cdh2 MO neural plate. (e) Bright field dorsal view images in cdh2/pac tissue by 12 hpf. Scale bar is 20 µm. (f) Single dorsal confocal slice depicting cells’ dorsal area profiles in cdh2/pac neural plate labelled with membrane-GFP (gray). (g) Automated cell area profile reconstruction from (f). a = anterior, p = posterior. Arrowhead and dashed lines in (eg) represent tissue midline. (h) Cdh2/pac mutant dorsal cell surface profiles during defective internalisation. Arrowheads indicate cell constriction events and dashed line represent tissue midline (ml). Scale bar, 10 µm and time is in hpf. (ij) Quantification of dorsal cell area profiles during cdh2/pac mutant internalisation. (i) Mean cell surface area between medial (wt red, cdh2/pac green left, P = 0.0121), and lateral cells (wt blue, cdh2/pac orange, P < 0.0001). (j) Comparative cell aligment along the anterior-posterior embryo’s axis between medial (wt red, cdh2/pac green left, P = 0.023), and lateral cells (wt blue, cdh2/pac orange, P = 0.078).

References

    1. Keller R, Shook D. The bending of cell sheets-from folding to rolling. Bmc Biol. 2011;9:90. doi: 10.1186/1741-7007-9-90. - DOI - PMC - PubMed
    1. Nikolopoulou E, Galea GL, Rolo A, Greene ND, Copp AJ. Neural tube closure: cellular, molecular and biomechanical mechanisms. Development. 2017;144:552–566. doi: 10.1242/dev.145904. - DOI - PMC - PubMed
    1. Heer NC, Martin AC. Tension, contraction and tissue morphogenesis. Development. 2017;144:4249–4260. doi: 10.1242/dev.151282. - DOI - PMC - PubMed
    1. Martin AC, Goldstein B. Apical constriction: themes and variations on a cellular mechanism driving morphogenesis. Development. 2014;141:1987–1998. doi: 10.1242/dev.102228. - DOI - PMC - PubMed
    1. Sweeton D, Parks S, Costa M, Wieschaus E. Gastrulation in Drosophila: the formation of the ventral furrow and posterior midgut invaginations. Development. 1991;112:775–89. - PubMed

Publication types

MeSH terms