. 2019 Feb 12;9(1):1879.
doi: 10.1038/s41598-019-38491-0.

DeepSOFA: A Continuous Acuity Score for Critically Ill Patients using Clinically Interpretable Deep Learning

Affiliations

DeepSOFA: A Continuous Acuity Score for Critically Ill Patients using Clinically Interpretable Deep Learning

Benjamin Shickel et al. Sci Rep. .

Abstract

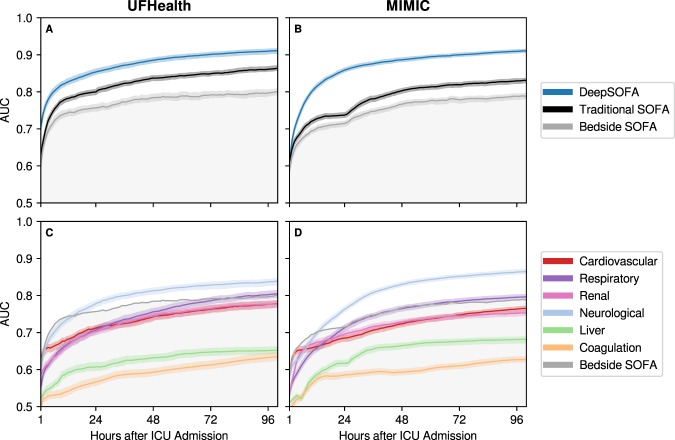
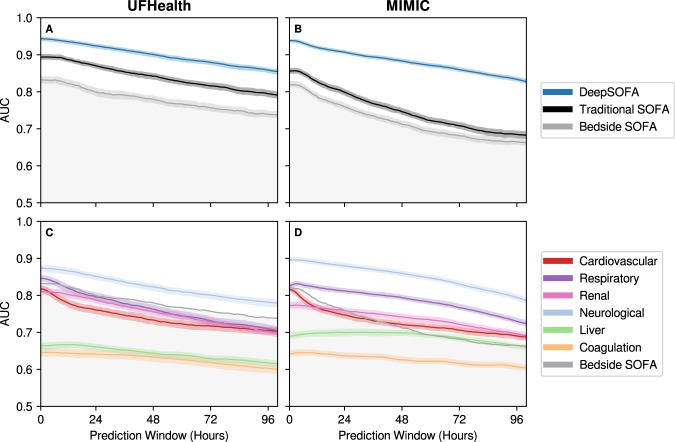
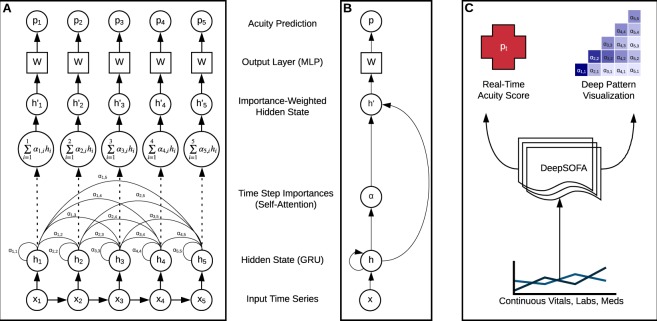
Traditional methods for assessing illness severity and predicting in-hospital mortality among critically ill patients require time-consuming, error-prone calculations using static variable thresholds. These methods do not capitalize on the emerging availability of streaming electronic health record data or capture time-sensitive individual physiological patterns, a critical task in the intensive care unit. We propose a novel acuity score framework (DeepSOFA) that leverages temporal measurements and interpretable deep learning models to assess illness severity at any point during an ICU stay. We compare DeepSOFA with SOFA (Sequential Organ Failure Assessment) baseline models using the same model inputs and find that at any point during an ICU admission, DeepSOFA yields significantly more accurate predictions of in-hospital mortality. A DeepSOFA model developed in a public database and validated in a single institutional cohort had a mean AUC for the entire ICU stay of 0.90 (95% CI 0.90-0.91) compared with baseline SOFA models with mean AUC 0.79 (95% CI 0.79-0.80) and 0.85 (95% CI 0.85-0.86). Deep models are well-suited to identify ICU patients in need of life-saving interventions prior to the occurrence of an unexpected adverse event and inform shared decision-making processes among patients, providers, and families regarding goals of care and optimal resource utilization.


Conflict of interest statement

The authors declare no competing interests.

Figures

Figure 1
Figure 1
DeepSOFA performance in two external validation cohorts. (A,B) Externally validated DeepSOFA, Bedside SOFA, and Traditional SOFA score accuracy in predicting in-hospital mortality, expressed as area under the receiver operating characteristic curve (AUC) for the first 100 hours following ICU admission. (C,D) Externally validated DeepSOFA accuracy for individual models corresponding to variable sets derived from SOFA organ system classification for the first 100 hours following ICU admission. Shaded regions represent 95% confidence intervals based on 100 bootstrapped iterations. Columns specify the validation cohort. DeepSOFA model validated in UFHealth (A,C) was trained using MIMIC, and DeepSOFA model validated in MIMIC (B,D) was trained using UFHealth. SOFA: Sequential Organ Failure Assessment.
Figure 2
Figure 2
Model accuracy for prediction windows of increasing time from hospital discharge or death. (A,B) Externally validated DeepSOFA, Bedside SOFA, and Traditional SOFA score accuracy in predicting in-hospital mortality, expressed as area under the receiver operating characteristic curve (AUC) for 100 hours preceding death or hospital discharge. (C,D) Externally validated DeepSOFA accuracy for individual models corresponding to variable sets derived from SOFA organ system classification for the 100 hours preceding death or hospital discharge. Shaded regions represent 95% confidence intervals based on 100 bootstrapped iterations. Columns specify the validation cohort. DeepSOFA model validated in UFHealth (A,C) was trained using MIMIC, and DeepSOFA model validated in MIMIC (B,D) was trained using UFHealth. SOFA: Sequential Organ Failure Assessment.
Figure 3
Figure 3
Externally validated DeepSOFA and Bedside SOFA score predicted mortality (A) for a single patient from the UFHealth cohort, correlated with vital signs (B), clinical events (D), and clinical interventions (E). Shown also are model self-attention weights (C) for each hour after ICU admission, where darker bars indicate increased model focus. Attention weights taken from the diagonal of full self-attention matrix and indicate how important the model believes each hour’s data is, as it is encountered in real-time. SOFA: Sequential Organ Failure Assessment, SpO2: oxygen saturation, MICU: Medical Intensive Care Unit, CT: computed tomography, ACLS: Advanced Cardiac Life Support, ROSC: return of spontaneous circulation.
Figure 4
Figure 4
Mean predicted mortality probabilities for externally validated DeepSOFA and Bedside SOFA models stratified by outcome. Probabilities shown both for first 100 hours after ICU admission (A,B) and final 100 hours before hospital discharge or death (C,D). Number of ICU encounters at each time point shown below each panel. Shaded regions around each line represent 95% confidence intervals based on 100 bootstrapped iterations. Gray shared area denotes hourly mortality rate for active ICU encounters. Columns specify the validation cohort. DeepSOFA model validated in UFHealth (A,C) was trained using MIMIC, and DeepSOFA model validated in MIMIC (B,D) was trained using UFHealth. SOFA: Sequential Organ Failure Assessment.
Figure 5
Figure 5
Visualized self-attention distributions for an example survivor and non-survivor from the UFHealth cohort, using DeepSOFA trained on the MIMIC cohort. Darker squares indicate increased model focus as a function of the passage of time (x-axis). Shown also are variable time series at each hour of the ICU stay, with initial and final measurement values shown on the left and right, respectively. MAP: mean arterial pressure, FiO2: fraction of inspired oxygen, PaO2: partial pressure of oxygen, SpO2: oxygen saturation, GCS: Glasgow Coma Scale.
Figure 6
Figure 6
Three identical views of our DeepSOFA model at increasing levels of abstraction, from most technical (A) to highest level operation (C). Panel A illustrates mortality prediction calculation for an example data segment x of five hours in the ICU and corresponding hourly acuity assessments p, where at each time point only the current and previous time steps are used in attention calculations and mortality predictions. Panel B displays a more general and compact form for the same stages of data transformation. Panel C describes the high-level inputs and outputs for DeepSOFA, where along with overall acuity assessment, interpretable prediction rationale by way of salient sequence patterns are visualized by a heatmap of self-attention weights. A more technical description of each stage of DeepSOFA can be found in the Supplemental Section Model Details.

References

    1. Vincent JL, et al. The SOFA (Sepsis-related Organ Failure Assessment) score to describe organ dysfunction/failure. On behalf of the Working Group on Sepsis-Related Problems of the European Society of Intensive Care Medicine. Intensive Care Med. 1996;22:707–710. - PubMed
    1. Ferreira F, Bota D, Bross A, Mélot C, Vincent J. Serial evaluation of the sofa score to predict outcome in critically ill patients. J. Am. Med. Assoc. 2001;286:1754–1758. - PubMed
    1. Vincent J-L, et al. Use of the SOFA score to assess the incidence of organ dysfunction/failure in intensive care units. Crit. Care Med. 1998;26:1793–1800. - PubMed
    1. Minne L, Abu-Hanna A, de Jonge E. Evaluation of SOFA-based models for predicting mortality in the ICU: A systematic review. Crit. Care. 2008;12:R161. - PMC - PubMed
    1. Badawi O, Liu X, Hassan E, Amelung PJ, Swami S. Evaluation of ICU Risk Models Adapted for Use as Continuous Markers of Severity of Illness Throughout the ICU Stay. Crit. Care Med. 2018;46:361–367. - PubMed

Publication types

MeSH terms