. 2019 Feb 12;9(1):1824.
doi: 10.1038/s41598-019-38528-4.

Development of Orthogonal Linear Separation Analysis (OLSA) to Decompose Drug Effects into Basic Components

Affiliations

Development of Orthogonal Linear Separation Analysis (OLSA) to Decompose Drug Effects into Basic Components

Tadahaya Mizuno et al. Sci Rep. .

Abstract

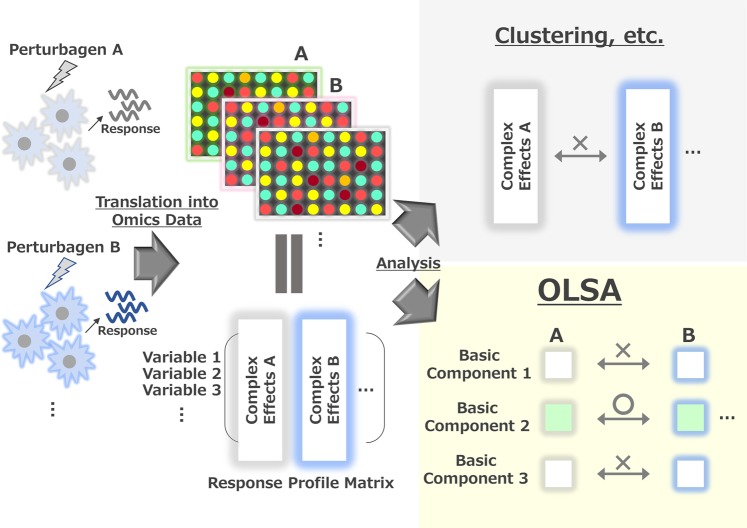
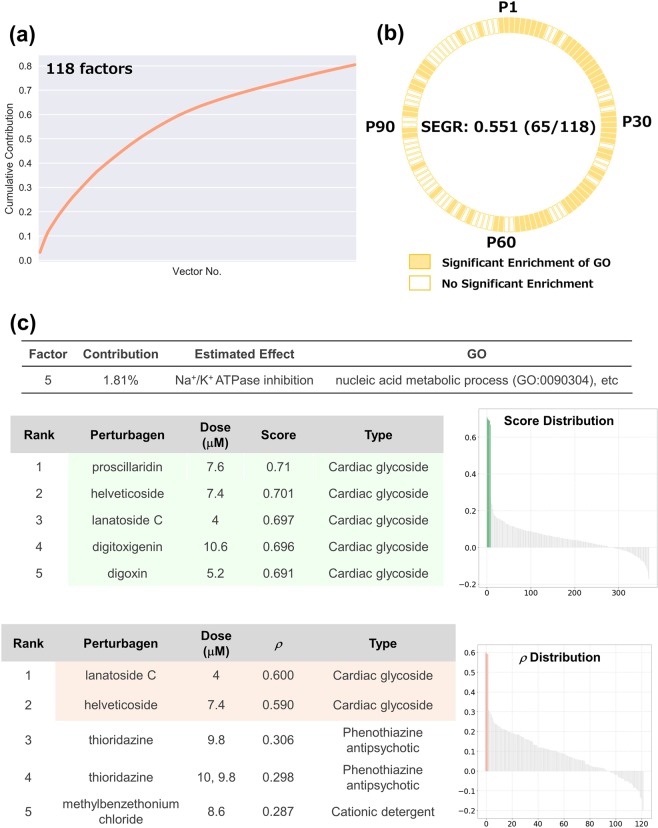
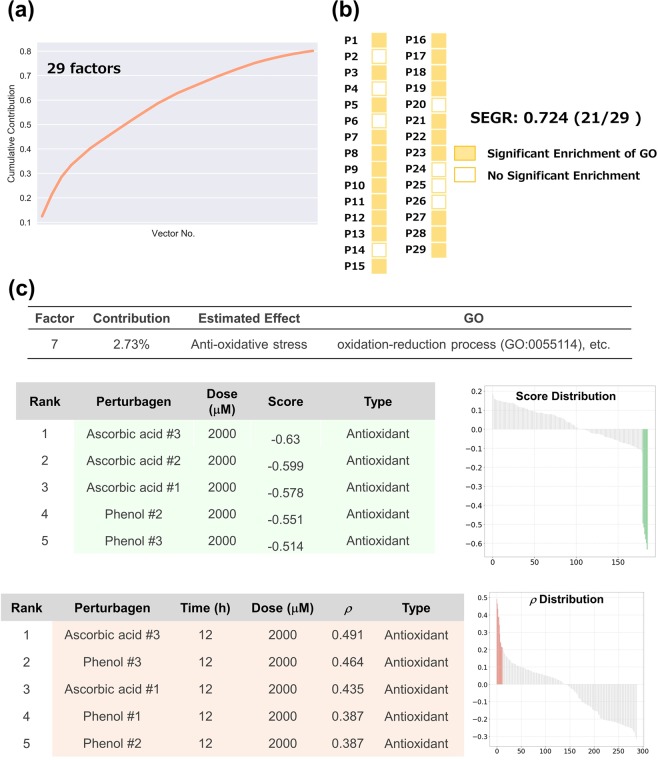
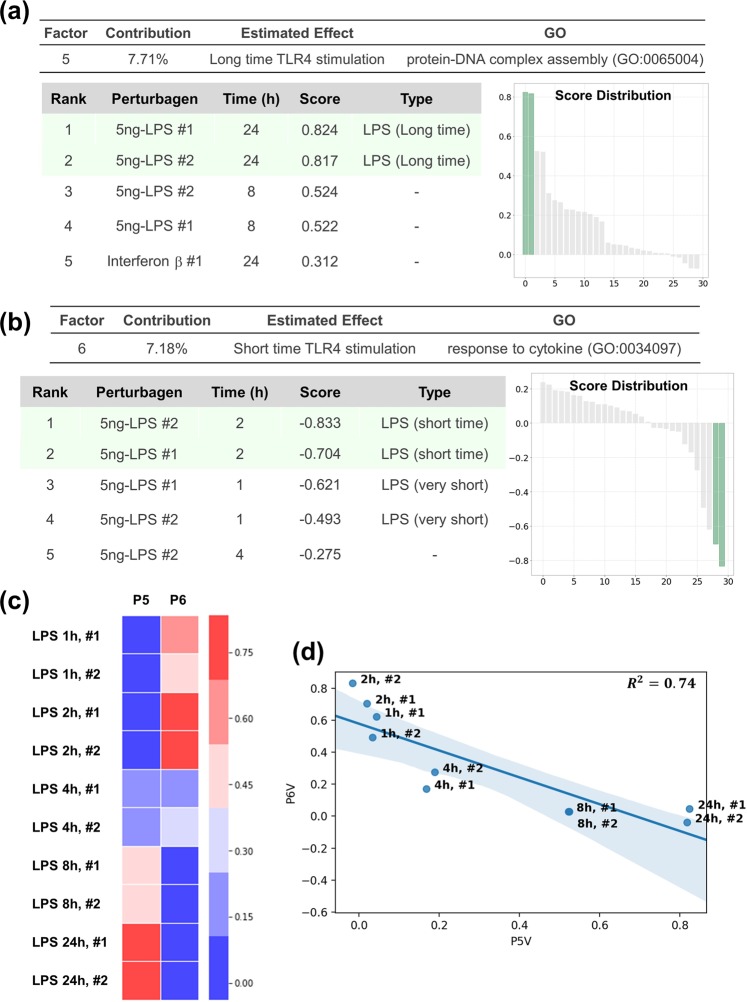
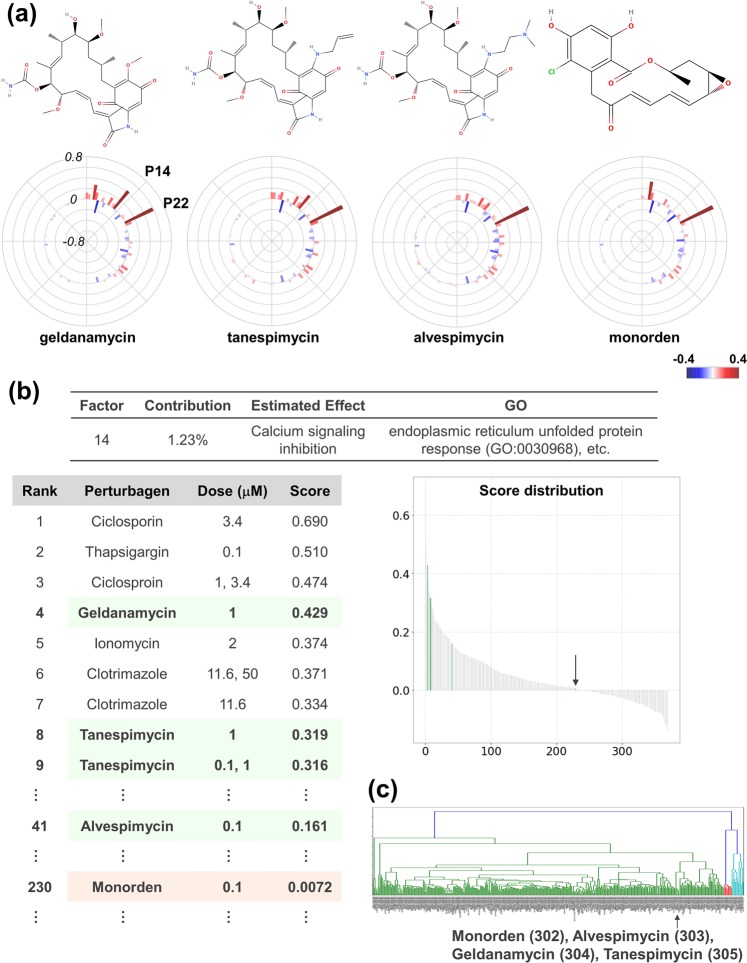
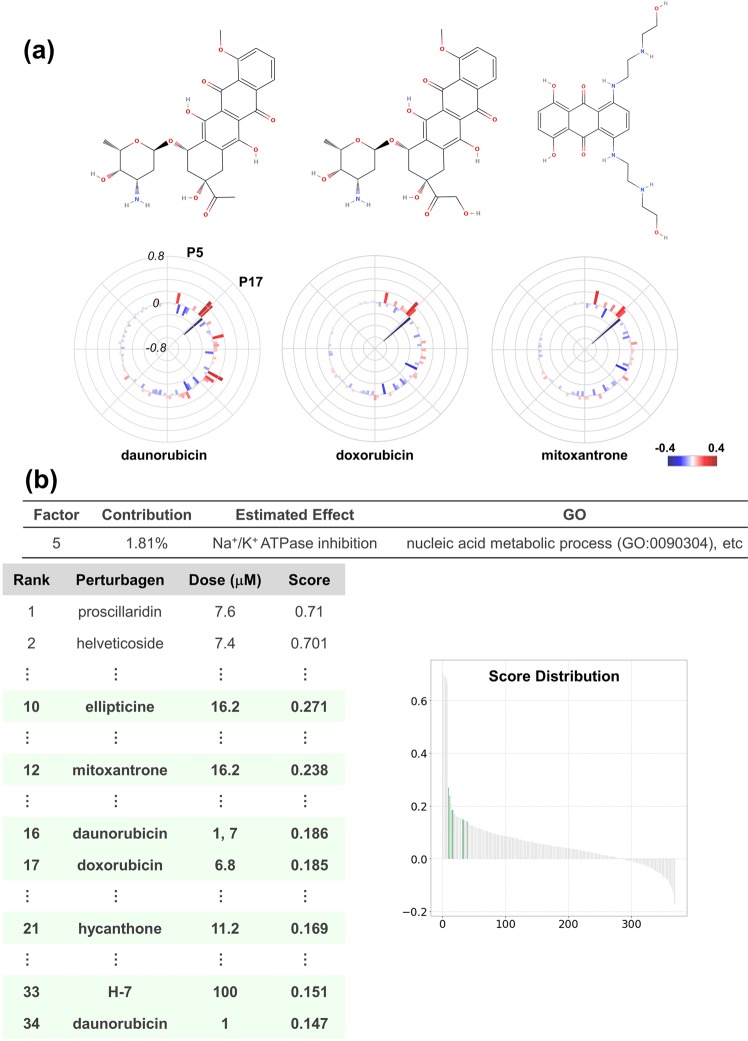
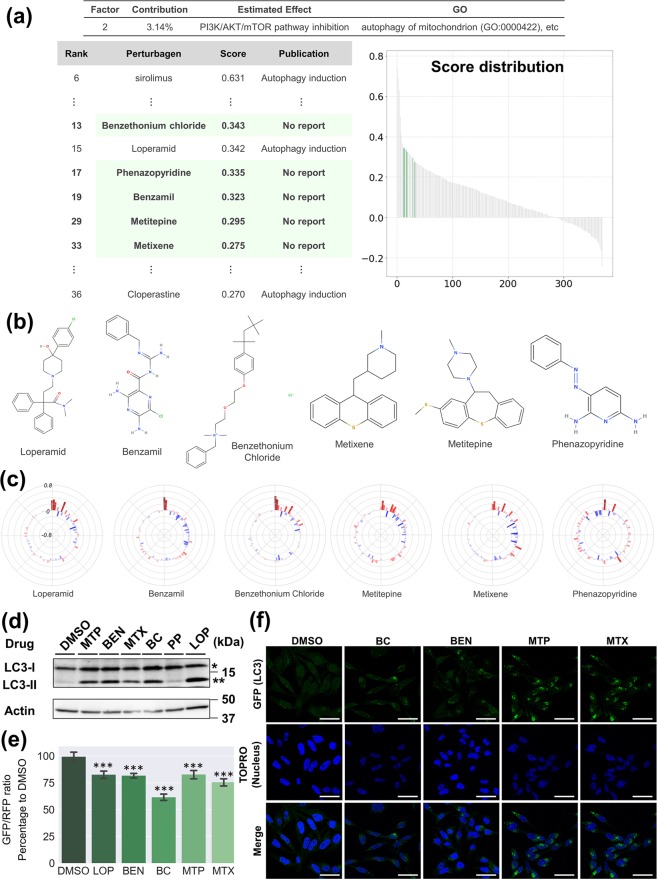
Drugs have multiple, not single, effects. Decomposition of drug effects into basic components helps us to understand the pharmacological properties of a drug and contributes to drug discovery. We have extended factor analysis and developed a novel profile data analysis method: orthogonal linear separation analysis (OLSA). OLSA contracted 11,911 genes to 118 factors from transcriptome data of MCF7 cells treated with 318 compounds in a Connectivity Map. Ontology of the main genes constituting the factors detected significant enrichment of the ontology in 65 of 118 factors and similar results were obtained in two other data sets. In further analysis of the Connectivity Map data set, one factor discriminated two Hsp90 inhibitors, geldanamycin and radicicol, while clustering analysis could not. Doxorubicin and other topoisomerase inhibitors were estimated to inhibit Na+/K+ ATPase, one of the suggested mechanisms of doxorubicin-induced cardiotoxicity. Based on the factor including PI3K/AKT/mTORC1 inhibition activity, 5 compounds were predicted to be novel inducers of autophagy, and other analyses including western blotting revealed that 4 of the 5 actually induced autophagy. These findings indicate the potential of OLSA to decompose the effects of a drug and identify its basic components.


Conflict of interest statement

The authors declare no competing interests.

Figures

Figure 1
Figure 1
The concept of orthogonal linear separation analysis of profile data. Illustration of OLSA application to response-profile data.
Figure 2
Figure 2
Analysis of cellular responses in MCF7 cells treated with 370 perturbagens. (a) The cumulative contribution curve of the factors contracting the training data set. The contribution of each factor to the total deviation was calculated and arranged in descending order. The cumulative contribution was calculated from the top and plotted. (b) Plot of the factors whose main constituents exhibit significant enrichment of gene ontology. Genes constituting a response vector were sorted by the square of each value. The top 1% of genes were subjected to GO (biological process) analysis using the Enrichment analysis of the Gene Ontology Consortium. Factors annotated with significant enrichment of GO after multiple-testing corrections (Benjamini–Hochberg method, α < 0.05) are depicted in yellow-filled squares. SEGR, significant enrichment of GO. (c) Analysis of P5 factor. P5 factor (the factor with the 5th highest contribution) scores and rho (ρ) of all compounds are arranged in descending order and plotted on the “Score Distribution” graph and “ρ Distribution” in each data set, respectively (upper, training; lower, test). Green or light salmon in the graph indicates a “cardiac glycoside”. The rank, name, dose, and score of the top 5 compounds are shown.
Figure 3
Figure 3
Analysis of cellular responses in HepG2 cells treated with 62 genotoxic compounds. (a) The cumulative contribution curve of the factors comprising the training data set. The contribution of each factor to the total deviation was calculated and arranged in descending order. The cumulative contribution was calculated from the top and plotted. (b) Plot of the factors whose main constituents exhibit significant enrichment of gene ontology. Genes constituting a response vector were sorted by the square of each value. The top 1% of genes were subjected to GO (biological process) analysis using the Enrichment analysis of Gene Ontology Consortium. Factors annotated with significant enrichment of GO after multiple-testing corrections (Benjamini–Hochberg method, α < 0.05) are depicted in yellow-filled squares. SEGR, significant enrichment of GO. (c) Analysis of P7 factor. P7 factor scores and rho (ρ) of all compounds are arranged in descending order and plotted on the “Score Distribution” graph and “ρ Distribution” in each data set, respectively (upper, training; lower, test). Green in the graph indicates ascorbic acid and light salmon indicates phenol. The rank, name, dose, and score of the top 10 compounds are shown. “–” and “#” indicate not investigated in the literature survey and the number of biological replicates, respectively.
Figure 4
Figure 4
Analysis of inflammatory responses in macrophages. (a) Analysis of the P5 factor. P5 factor scores and rho (ρ) of all compounds are arranged in descending order and plotted on the “Score Distribution” graph and “ρ Distribution” in each data set, respectively (upper, training; lower, test). Green or light salmon in the graph indicates 24-h LPS treatment. The rank, name, dose, and score of the top 10 treatments are shown. “–”, “#”, and “5 ng-” indicate without 24-h LPS treatment, the sample number of biological replicates, and 5 ng/mL treatment, respectively. (b) Analysis of the P6 factor using the method described in a. Green or light salmon in the graph indicates 2-h LPS treatment. The rank, name, dose, and score of the top 10 treatments are shown. “–” indicates no 2-h LPS treatment. (c) Heatmap comparing the scores of P5 and P6 factors. 1 h, …, 24 h and #1, #2 indicate 1 h-, …, 24 h treatment and the number of biological replicates, respectively. (d) Scatter plot of the scores of P5 and P6 factors. The blue line and area indicate the regression line and the 95% confidence interval. R2, the coefficient of determination.
Figure 5
Figure 5
Decomposition of Hsp90-inhibitor effect. (a) Structures and response scores of Hsp90 inhibitors. Structures were obtained from MolView (http://molview.org/). Response scores are plotted as a bar chart in polar co-ordinates with heatmap. (b) Analysis of the P14 factor. P14 factor scores of all compounds are arranged in descending order and plotted on the “Score Distribution” graph. Green with an arrow in the graph indicates geldanamycin-type inhibitors and light salmon with an arrow indicates monorden. The rank, name, dose, and score are shown. (c) Clustering analysis of MCF7 cells data set of CMap. The MCF7 cells data set of CMap was subjected to clustering analysis with the Ward method. An arrow indicates the cluster where Hsp90 inhibitors belong. The numbers following the compound names indicate the ordinal numbers from the left.
Figure 6
Figure 6
Decomposition of topoisomerase-inhibitor effect. (a) Structures and polar charts of response scores of topoisomerase inhibitors: daunorubicin, doxorubicin, and mitoxantrone. For daunorubicin, 7 μM-dose data were employed considering the higher effect on the transcriptional network than that of 1 μM. Structures were obtained from MolView (http://molview.org/). Response scores are plotted as a bar chart in polar co-ordinates with heatmap. (b) Analysis of the P5 factor. P5 factor scores of all compounds are arranged in descending order and plotted on the “Score Distribution” graph. Green in the graph indicates topoisomerase inhibitors. The rank, name, dose, and score are shown.
Figure 7
Figure 7
Identification of autophagy regulators. (a) Analysis of the P2 factor. P2 factor scores of all compounds are arranged in descending order and plotted on the “Score Distribution” graph. Green in the graph indicates the compounds with a high P2 score, but without reports about autophagy. The rank, name, dose, and score are shown. (b) Structures of the compounds tested in this study. Structures were obtained from MolView (http://molview.org/). (c) Polar charts of response scores of the compounds tested. Response scores are plotted as a bar chart in polar co-ordinates with heatmap. (d) Western blotting analysis of HeLa cells treated with the compounds tested. HeLa cells were treated with the compounds tested at the indicated concentration for 24 h. The whole-cell lysate was analysed by western blotting using anti-LC3 antibody. *LC3-I, **LC3-II. Full-length blots are presented in Supplementary Fig. S7d. (e) Autophagy flux evaluation of GFP-LC3-RFP-LC3ΔG-HeLa cells treated with the compounds tested. HeLa cells expressing GFP-LC3-RFP-LC3ΔG were treated with the compounds tested using the method described in D. GFP and RFP signals were quantified with a Tecan Infinite M200 plate reader and the GFP/RFP ratio was calculated. Each bar represents the mean ± SE, n = 6. Significance test was conducted with the Turkey–Kramer method and only significant differences between DMSO and the tested compounds are shown: ***P < 0.001. (f) Imaging analysis of GFP-LC3-RFP-LC3ΔG-HeLa cells treated with the compounds tested. HeLa cells expressing GFP-LC3-RFP-LC3ΔG were treated with the compounds tested using the method described in D, fixed with 4% paraformaldehyde, stained with TO-Pro-3 iodide, and the fluorescence signals were detected with a TCS SP5 confocal microscope. Green signals indicate GFP (LC3) and blue signals the TO-Pro-3 iodide (nucleus). Scale bars correspond to 50 μm. In (df), a representative result of at least two independent experiments is shown.

References

    1. Weinstein JN. Searching for pharmacogenomic markers: The synergy between omic and hypothesis-driven research. Dis. Markers. 2001;17:77–88. doi: 10.1155/2001/435746. - DOI - PMC - PubMed
    1. Andrusiak K, Piotrowski JS, Boone C. Chemical-genomic profiling: Systematic analysis of the cellular targets of bioactive molecules. Bioorganic Med. Chem. 2012;20:1952–1960. doi: 10.1016/j.bmc.2011.12.023. - DOI - PubMed
    1. Kim J, Shin M. An integrative model of multi-organ drug-induced toxicity prediction using gene-expression data. BMC Bioinformatics. 2014;15:1–9. - PMC - PubMed
    1. Lamb J, et al. The Connectivity Map: using gene-expression signatures to connect small molecules, genes, and disease. Science. 2006;313:1929–1935. doi: 10.1126/science.1132939. - DOI - PubMed
    1. Subramanian A, et al. A Next Generation Connectivity Map: L1000 Platform and the First 1,000,000 Profiles. Cell. 2017;171:1437–1452.e17. doi: 10.1016/j.cell.2017.10.049. - DOI - PMC - PubMed

Publication types

MeSH terms