

Sedoheptulose-1,7-bisphospate Accumulation and Metabolic Anomalies in Hepatoma Cells Exposed to Oxidative Stress
- PMID: 30755786
- PMCID: PMC6348915
- DOI: 10.1155/2019/5913635
Sedoheptulose-1,7-bisphospate Accumulation and Metabolic Anomalies in Hepatoma Cells Exposed to Oxidative Stress
Abstract
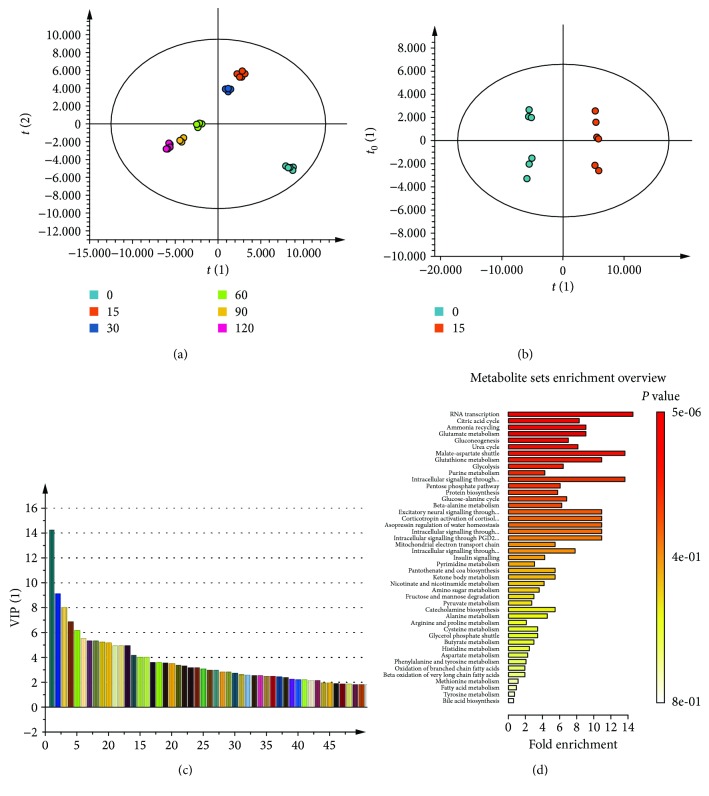
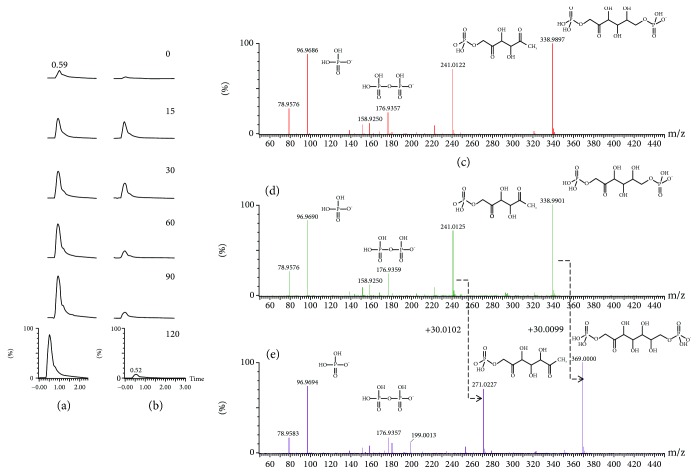
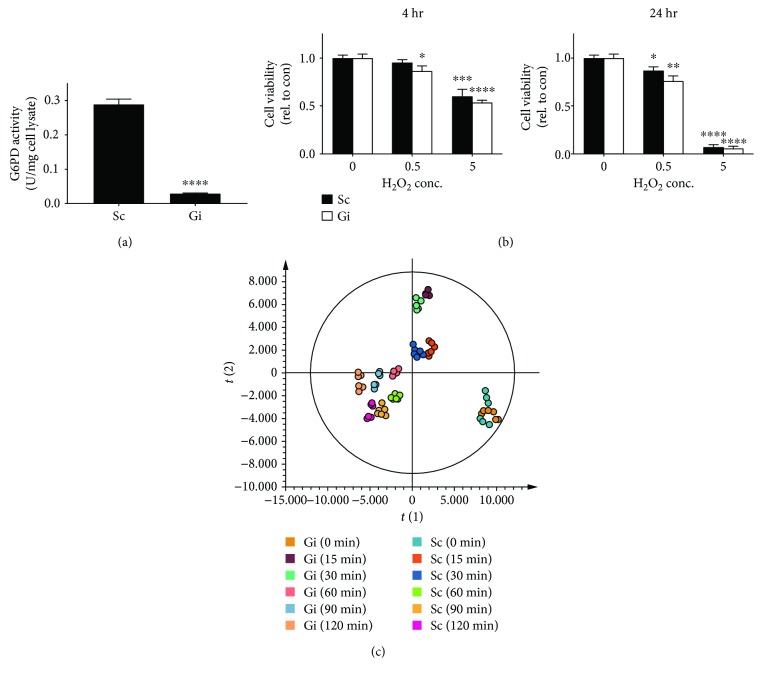
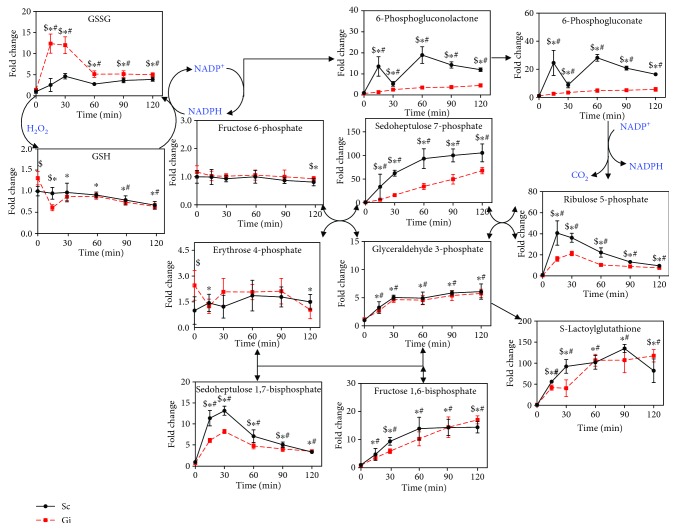
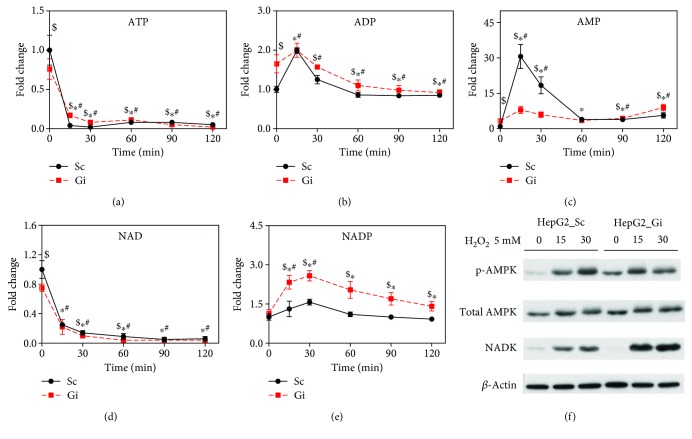
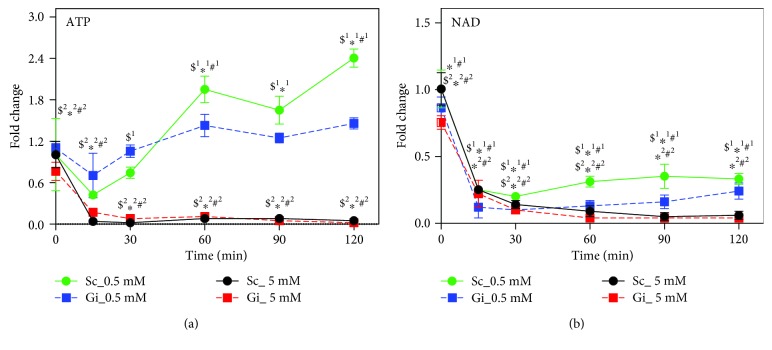
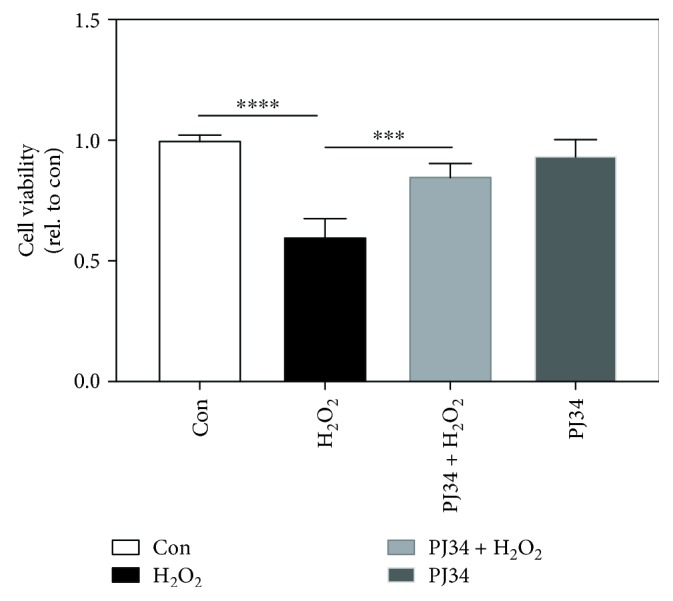
We have previously shown that GSH depletion alters global metabolism of cells. In the present study, we applied a metabolomic approach for studying the early changes in metabolism in hydrogen peroxide- (H2O2-) treated hepatoma cells which were destined to die. Levels of fructose 1,6-bisphosphate and an unusual metabolite, sedoheptulose 1,7-bisphosphate (S-1,7-BP), were elevated in hepatoma Hep G2 cells. Deficiency in G6PD activity significantly reduced S-1,7-BP formation, suggesting that S-1,7-BP is formed in the pentose phosphate pathway as a response to oxidative stress. Additionally, H2O2 treatment significantly increased the level of nicotinamide adenine dinucleotide phosphate (NADP+) and reduced the levels of ATP and NAD+. Severe depletion of ATP and NAD+ in H2O2-treated Hep G2 cells was associated with cell death. Inhibition of PARP-mediated NAD+ depletion partially protected cells from death. Comparison of metabolite profiles of G6PD-deficient cells and their normal counterparts revealed that changes in GSH and GSSG per se do not cause cell death. These findings suggest that the failure of hepatoma cells to maintain energy metabolism in the midst of oxidative stress may cause cell death.
Figures
Similar articles
-
Characterization of global metabolic responses of glucose-6-phosphate dehydrogenase-deficient hepatoma cells to diamide-induced oxidative stress.Free Radic Biol Med. 2013 Jan;54:71-84. doi: 10.1016/j.freeradbiomed.2012.10.557. Epub 2012 Nov 6. Free Radic Biol Med. 2013. PMID: 23142419
-
Inability to maintain GSH pool in G6PD-deficient red cells causes futile AMPK activation and irreversible metabolic disturbance.Antioxid Redox Signal. 2015 Mar 20;22(9):744-59. doi: 10.1089/ars.2014.6142. Epub 2015 Feb 10. Antioxid Redox Signal. 2015. PMID: 25556665 Free PMC article.
-
Novel role of TRPV2 in promoting the cytotoxicity of H2O2-mediated oxidative stress in human hepatoma cells.Free Radic Biol Med. 2015 Dec;89:1003-13. doi: 10.1016/j.freeradbiomed.2015.09.020. Epub 2015 Oct 9. Free Radic Biol Med. 2015. PMID: 26456053
-
Nicotinamide prevents sweet beverage-induced hepatic steatosis in rats by regulating the G6PD, NADPH/NADP+ and GSH/GSSG ratios and reducing oxidative and inflammatory stress.Eur J Pharmacol. 2018 Jan 5;818:499-507. doi: 10.1016/j.ejphar.2017.10.048. Epub 2017 Oct 22. Eur J Pharmacol. 2018. PMID: 29069580
-
Retinoic acid-related orphan receptor alpha reprograms glucose metabolism in glutamine-deficient hepatoma cells.Hepatology. 2015 Mar;61(3):953-64. doi: 10.1002/hep.27577. Epub 2015 Jan 28. Hepatology. 2015. PMID: 25346526
Cited by
-
Metabolic Reprogramming of Host Cells in Response to Enteroviral Infection.Cells. 2020 Feb 18;9(2):473. doi: 10.3390/cells9020473. Cells. 2020. PMID: 32085644 Free PMC article.
-
Selenium Modulates Cancer Cell Response to Pharmacologic Ascorbate.Cancer Res. 2022 Oct 4;82(19):3486-3498. doi: 10.1158/0008-5472.CAN-22-0408. Cancer Res. 2022. PMID: 35916672 Free PMC article.
-
Muscle Metabolome Profiles in Woody Breast-(un)Affected Broilers: Effects of Quantum Blue Phytase-Enriched Diet.Front Vet Sci. 2020 Aug 4;7:458. doi: 10.3389/fvets.2020.00458. eCollection 2020. Front Vet Sci. 2020. PMID: 32851035 Free PMC article.
-
Combined metabolome and transcriptome analysis reveals key components of complete desiccation tolerance in an anhydrobiotic insect.Proc Natl Acad Sci U S A. 2020 Aug 11;117(32):19209-19220. doi: 10.1073/pnas.2003650117. Epub 2020 Jul 28. Proc Natl Acad Sci U S A. 2020. PMID: 32723826 Free PMC article.
-
Metabolic adaptation supports enhanced macrophage efferocytosis in limited-oxygen environments.Cell Metab. 2023 Feb 7;35(2):316-331.e6. doi: 10.1016/j.cmet.2022.12.005. Epub 2022 Dec 29. Cell Metab. 2023. PMID: 36584675 Free PMC article.
References
MeSH terms
Substances
LinkOut - more resources
Full Text Sources
Medical
Miscellaneous
